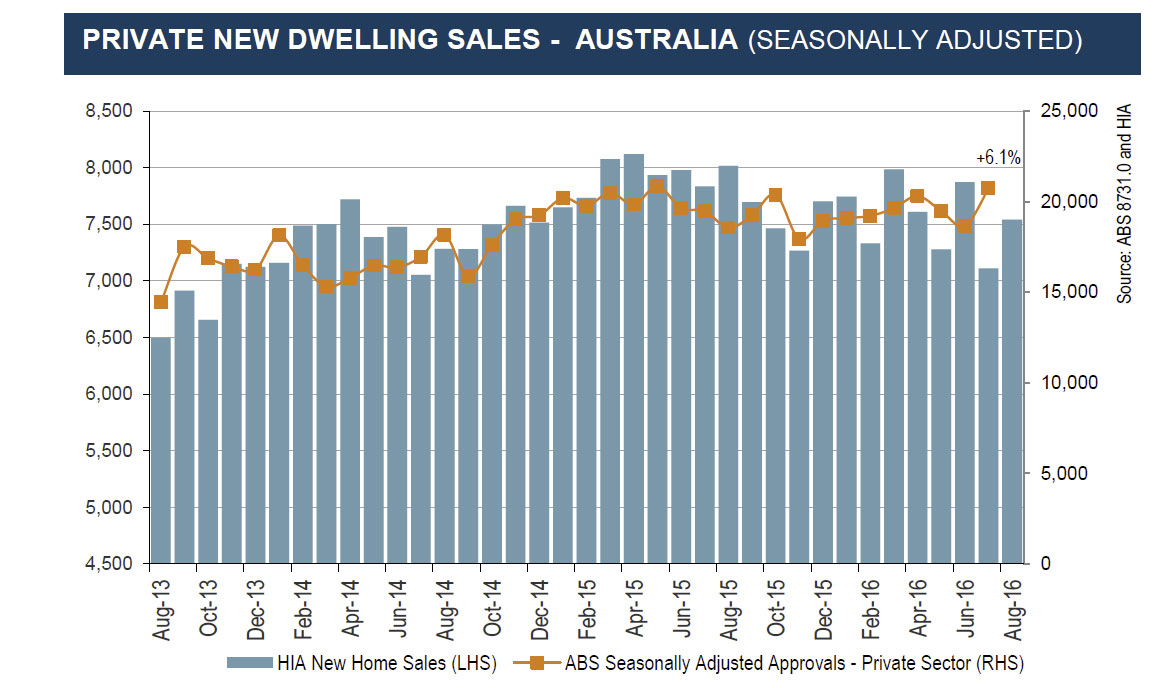
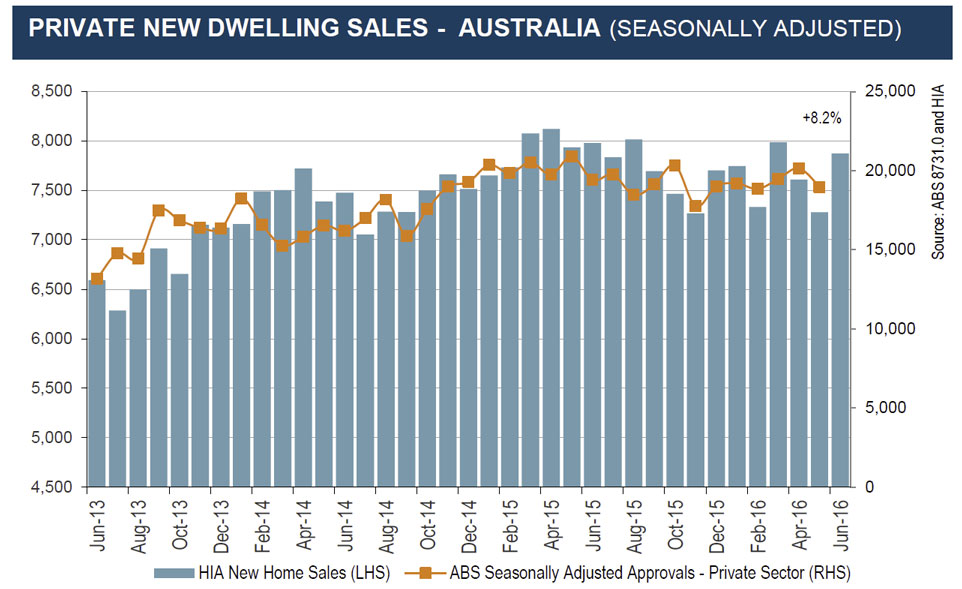
The monthly HIA survey of Australia’s largest volume builders reveals that total seasonally-adjusted new home sales increased in September 2016, the second consecutive month of growth.
Within the month, growth was driven by detached house sales which rose by 3.8 per cent, while sales of units eased back by 0.8 per cent over the same period. However, Victoria was the only state to record an increase in new home sales over this period with 14.0 per cent growth in sales over the past year.
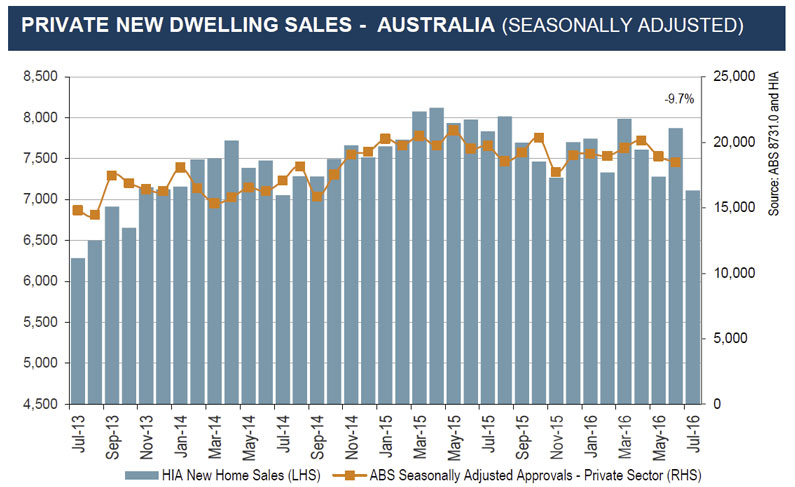
In fact, detached house sales fell in four out of the five states covered by the report, an exact reversal of the situation in August. During September 2016, the largest fall in sales was recorded in South Australia (-23.0 per cent), followed by Western Australia (-17.2 per cent), New South Wales (-12.9 per cent) and Queensland (-2.6 per cent).
“During September, HIA’s New Home Sales grew by 3.8 per cent, a further increase on the 2.9 per cent rate of growth over the previous month,” remarked HIA Senior Economist, Shane Garrett.
“However, the mix of available indictors suggests that new home building activity has now passed its peak and that the 2015/16 financial year will not be matched in terms new dwelling starts. This is particularly the case for multi-residential sales, which have eased by 6.2 per cent during the September 2016 quarter compared with the same period a year earlier”.