The Vicious Circle of Stamp Duty

Few things have as detrimental an impact as stamp duty on household finances, according to the Housing Industry Association. This is based on the results contained in the HIA’s Summer 2015 edition of Stamp Duty Watch publication.

During November 2015, the typical stamp duty bill nationally rose to $19,045 from $17,653 in June, an increase of 7.9 per cent. The cost of stamp duty is equivalent to almost four months’ worth of earnings, with stamp duty causing mortgage repayments to increase by $1,165 per year, or $34,955 over a 30-year loan term.

“The cost of stamp duty has a significant negative multiplier effect causing a downward financial spiral for households,” explained HIA Senior Economist, Shane Garrett.

“Apart from the immediate effect of being over $19,000 worse off, stamp duty results in mortgage interest payments increasing by about $15,900,”

“Damage from the tide of stamp duty doesn’t stop there. Homebuyers have smaller deposits after stamp duty is paid and must bear larger mortgage debt. As a result, significantly higher LMI charges must then be paid. On a standard home purchase of $527,000, stamp duty can push the LMI premium up by another $7,855. If that’s not bad enough, a further layer of mortgage interest is added on top of the LMI premium if it is capitalised.”

“The end result is that the typical stamp duty bill of $19,045 can snowball up to about $50,000 once LMI and mortgage interest are factored in. This is an unacceptable burden to place on ordinary homebuyers.”

“As state governments rely more and more on revenue from stamp duty, they have been blinded to the obvious consequences of these costs have on prospective first home buyers. Last week’s Productivity Commission report also noted the huge disincentive that stamp duty places on older households wishing to downsize”.

During November 2015, NT homebuyers continued to suffer the highest stamp duty bills ($25,600), followed by Victoria ($24,700) and NSW ($23,600). Queensland continued to offer the lowest stamp duty bills by a comfortable margin ($6,300) followed by Tasmania ($9,300). Stamp duty bills are the fourth highest in the ACT ($18,400) with WA in fifth place ($16,300) and SA in sixth ($15,400).

HIA Says New Home Sales Held Up Well In October

The HIA New Home Sales Report, a survey of Australia’s largest volume builders, reveals that while sales volumes are off their peak they are still holding up relatively well.

The latest update – for October 2015 – reveals a decline of 3.0 per cent in total seasonally adjusted new home sales. Detached house sales fell by 4.1 per cent while the sale of ‘multi-units’ notched up a 1.0 per cent gain.

HIA-Dec-2015In the month of October 2015 detached house sales declined in four out of the five the mainland states. Detached house sales fell by 9.3 per cent in Victoria, 5.4 per cent in Western Australia, 0.9 per cent in Queensland and 0.8 per cent in New South Wales. Detached house sales increased by 2.6 per cent in South Australia.

Stronger New Dwelling Approvals in October

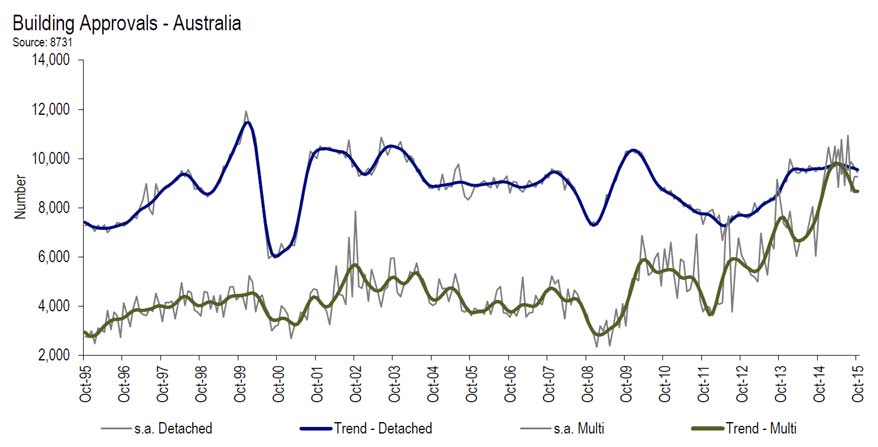
ABS figures released today show that building approvals increased by 3.9 per cent in October, the second consecutive month of growth, said the Housing Industry Association.

During October, total seasonally-adjusted new dwelling approvals rose to 19,652, the strongest monthly result since the all-time record high reached in July. The distribution of the growth was mixed, however; while multi-unit approvals increased by 10.1 per cent during October, detached house approvals fell by 2.1 per cent during the month. The back-to-back increases in approvals during September and October were the first consecutive monthly increases since the beginning of the year.

HIA-Approvals-October-2015During October 2015, total seasonally adjusted new home building approvals saw the largest increase in South Australia (+23.4 per cent), followed by New South Wales (+22.0 per cent) and Victoria (+21.2 per cent). Approvals fell in Tasmania (-41.6 per cent), Queensland (-28.7 per cent) and Western Australia (-1.1 per cent). In trend terms, approvals saw a 7.1 per cent increase in the NT but declined by 10.8 percent in the Australian Capital Territory.

Housing Affordability Deteriorates

The HIA Affordability Index for the September 2015 quarter indicates that housing affordability has deteriorated further, said the Housing Industry Association.

“Sluggish earnings growth and the strong pace of dwelling price growth in the two key markets means that home purchase moved beyond the reach of a greater number of Australian households,” explained HIA Senior Economist, Shane Garrett.

During the September 2015 quarter, housing affordability worsened by 4.0 per cent compared with the previous quarter and was 2.1 per cent less favourable than the same time last year. Developments in the eight capital cities were more detrimental from an affordability perspective, with a 4.1 per cent deterioration occurring compared with the previous quarter. Compared with a year ago, affordability in the capital cities is 3.6 per cent less favourable. However, affordability actually improved in six of the fourteen markets included in the report.

“Affordability is now at its least favourable since the final quarter of 2014,” noted Shane Garrett. “The two interest rate reductions in the first half of this year provided a temporary respite from the perspective of affordability,” Shane Garrett pointed out. “The surge in dwelling prices in Sydney and Melbourne, along with near stagnant earnings growth means that the pendulum has since swung backwards to the detriment of affordability.”

“Over 210,000 new dwellings were commenced during the 2014/15 financial year, an all-time high,” said Shane Garrett. “This remarkable pipeline of supply has helped soothe affordability pains in some markets. Were it not for the exceptional level of new home building, Australia’s affordability challenge would be even more severe.”

“In the round, the odds are still stacked far too heavily against the goal of more affordable housing. The burden of taxation on new housing is huge, which is exacerbated by chronic shortages of new residential land in key markets. This effect flows through to the existing housing stock in a way that puts potential buyers at a disadvantage. The unilateral increase in variable mortgage rates over the past month is further aggravating the situation,” concluded Shane Garrett.
Housing-Affordability-Sept-2015

New Home Sales Are Down – HIA

The HIA New Home Sales Report, a survey of Australia’s largest volume builders, showed monthly new home sales declined by 4.0 per cent in September 2015, with the level of activity down from the April peak by 5.2 per cent.

“The decline in total new home sales was reflected in both the detached and non-detached segments of the market in September 2015,” said HIA economist, Diwa Hopkins. “Following the peak level of sales that occurred in April this year, sales activity has trended lower only very modestly. This augers well for actual new home building activity in 2015/16. A fresh record level of building activity during this financial year could have been achieved – and could have been of strong benefit to the broader domestic economy – but increasingly restrictive credit conditions are likely to curtail the boom in new home building. The deterioration in credit conditions is likely to weigh more heavily on new home building activity beyond 2015/16. We have therefore pared back our forecasts for activity over our forecast horizon beyond the end of the current financial year.”

In the month of September 2015 detached house sales declined in four out of the five the mainland states. Detached house sales declined by 19.8 per cent South Australia, 8.6 per cent in Western Australia, 5.9 per cent in Queensland and 0.5 per cent in New South Wales. In Victoria, detached house sales increased by 3.1 per cent.

HIA-New-Home-Sales-Sept-2015

National Residential Land Sales Increased by 17.6 per cent to June 2015

The latest HIA-CoreLogic RP Data Residential Land Report provided by the Housing Industry Association, and CoreLogic RP Data, shows there was some relief from the tight conditions in Australia’s residential land market in the June 2015 quarter.

In the June 2015 quarter, national residential land sales increased by 17.6 per cent, while the weighted median residential lot price increased by 0.6 per cent over the quarter to be 5.2 per cent higher than 12 months earlier.

“Today’s update shows that a rise in land sales was accompanied by an easing off in the pace of price increase in Australia’s residential land market,” said HIA economist, Diwa Hopkins. “This compares with previous quarters which saw strong price increases amid declining land sales.”

“While the June quarter result is an encouraging development, what needs to occur is similar results being sustained over the longer run. That is, a larger and more consistent flow of shovel-ready land needs to be brought online.”

“For this to happen, policy reform needs to address the key land supply bottlenecks including unnecessarily long planning delays; slow and insufficient release of residential land; excessive and inappropriate infrastructure funding arrangements, and; excessive zoning restrictions,” added Ms Hopkins.

According to CoreLogic RP Data research director, Tim Lawless, the break in the trend of declining land sales is a positive outcome after three consecutive quarters of declining sales.

“A 17 per cent jump in vacant land sales is impressive, but land sales remain lower than the June quarter of last year and comes after three quarters where volumes consistently fell and prices rose. The most encouraging sign is that this quarterly rise in vacant land sales is broad based with five of the six states showing a substantial boost in sales.”

“With detached housing approvals remaining relatively flat since early 2014, the likelihood of this recent surge in vacant land sales developing into a stronger trend is unlikely.”

Home Sales Higher In August – HIA

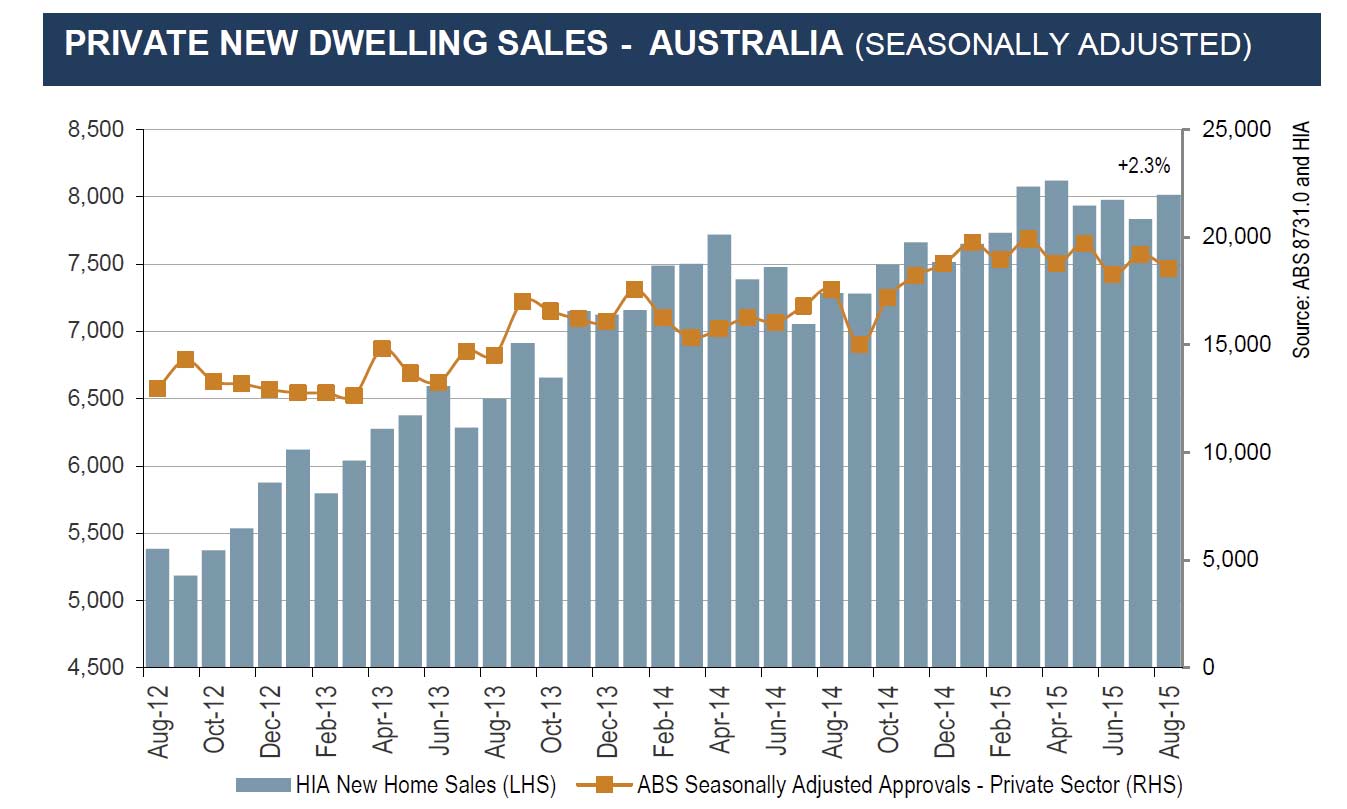
The HIA New Home Sales Report, a survey of Australia’s largest volume builders, recorded an increase in August 2015, with the level of activity only just short of the high reached in April this year. They report a decline in unit sales, but a rise in houses.

“Total seasonally adjusted new home sales increased by 2.3 per cent in August this year, driven by a 3.5 per cent rise in detached house sales,” said economist, Diwa Hopkins. “Multi-unit sales, however, declined by 1.7 per cent.”

“It is becoming increasingly apparent that total sales activity has already peaked this year, but today’s update shows that sales are remaining elevated.”

“The overall developments in both HIA New Home Sales and the equivalent ABS measure, building approvals, are consistent with our outlook for actual new home building activity in 2015/16.”

“We’re forecasting total dwelling commencements to ease back from what we expect to have been the peak level in the financial year just passed, but still remain elevated.”

Detached house sales increased by 3.5 per cent in August 2015, but were 5.1 per cent below the monthly peak that occurred back in April 2014. For ‘multi-units’, it is May 2015 that is shaping up to represent a peak in monthly sales, with declines occurring in each of the subsequent months. Multi-unit sales in August this year were down from the May level by 8.5 per cent.

In the month of August detached house sales increased in four out of the five the mainland states. Detached house sales increased by 10.2 per cent South Australia, 7.0 per cent in Queensland, 3.2 per cent in New South Wales and 3.4 per cent in Victoria. In Western Australia, detached house sales declined by 1.4 per cent.

HIA-Sales-August-2015

New Home Sales Past Peak – HIA

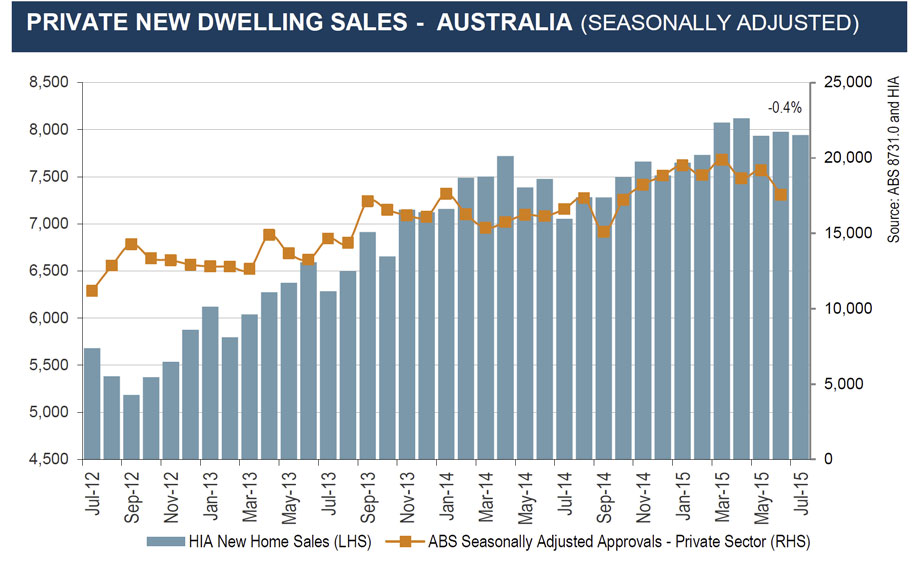
The HIA New Home Sales Report, a survey of Australia’s largest volume builders, showed a very modest decline of 0.4%. HIA say key leading indicators of home building, including HIA New Home Sales, suggest little prospect for further growth in new home construction in 2015/16.

Detached house sales increased by 0.7 per cent in July this year. The annual peak for detached house sales has passed. Over the three months to July this year detached house sales fell by 2.8 per cent to be 3.4 per cent lower when compared to the three months to July 2014. ‘Multi-unit’ sales peaked in May this year and fell by 4.2 per cent in July following a decline of 2.9 per cent in June. Over the three months to July this year multi-unit sales increased by 8.3 per cent, but it was the strength of the May result that drove the quarterly outcome.

In the month of July 2015 detached house sales increased by 4.2 per cent in New South Wales. Detached house sales fell by 2.3 per cent in Victoria and by 4.9 per cent in Western Australia. Sales were close to flat for the month in Queensland (-0.6 per cent) and South Australia (-0.2 per cent).

HIAHomeSalesJuly2015

New Home Sales Still Strong – HIA

The HIA New Home Sales Report, a survey of Australia’s largest volume builders, recorded its fifth rise in six months in June 2015. Total seasonally adjusted new home sales increased by 0.5 per cent in June. Detached houses drove the modest increase in new home sales with a 1.7 per cent rise offsetting a 2.9 per cent decline in the sale of multi-units.

The HIA say New South Wales and Victoria continue to display upward momentum in detached house sales, but the other three mainland states are heading in the opposite direction. In the month of June 2015 detached house sales increased by 3.5 per cent in NSW, 1.5 per cent in Victoria, and 4.2 per cent in Queensland. Detached house sales fell by 2.0 per cent in South Australia in June, while in Western Australia sales eased by 0.9 per cent. In the June 2015 quarter detached house sales increased by 7.9 per cent in NSW and 0.6 per cent in Victoria. Sales fell for the quarter in Queensland (-7.0 per cent), SA (-10.2 per cent), and WA (-3.1 per cent).

HIANewDwellings-June-2015

Housing Affordability Deteriorates in Mid 2015 – HIA

The HIA Affordability Index fell in the June 2015 quarter, signalling a deterioration in affordability conditions, said the Housing Industry Association industry.

“The positive impact of a second interest rate cut for the year in May was overwhelmed by an increase in the CoreLogic RP Data median dwelling price and the persistence of sluggish earnings growth,” said HIA Chief Economist, Dr Harley Dale. “The net negative impact of these factors saw the national HIA Affordability Index fall by 2.9 per cent to 79.7 in the June 2015 quarter.”

“The national affordability result masks wide variations around the country, an unsurprising finding given the lack of geographical consistency to the current residential cycle,” Harley Dale said.

During the June 2015 quarter, affordability deteriorated by 3.6 per cent in capital city markets, driven by Sydney and Melbourne. This was in stark contrast to a 2.7 per cent improvement for regional Australia. Compared with the June quarter last year, capital city affordability worsened by 0.6 per cent, while in regional Australia affordability saw a 5.2 per cent improvement.

“The large differences in the results for the capital city Affordability Index and its regional counterpart, together with the variation in outcomes between capital cities, exposes the folly of sweeping generalisations which refer to an Australian housing boom,” said Harley Dale. “That is simply not what is occurring – in many parts of Australia the extremely low interest rate environment is delivering historically favourable affordability conditions.”

“It is against this backdrop that authorities have escalated their requirements for the rationing of credit to residential investors. The risk is that this will obstruct new housing supply, aggravating affordability conditions in markets around Australia,” concluded Harley Dale.

HIA-Affordability-Jun-2015