Residential Property Now Worth A Record $5.5 Trillion

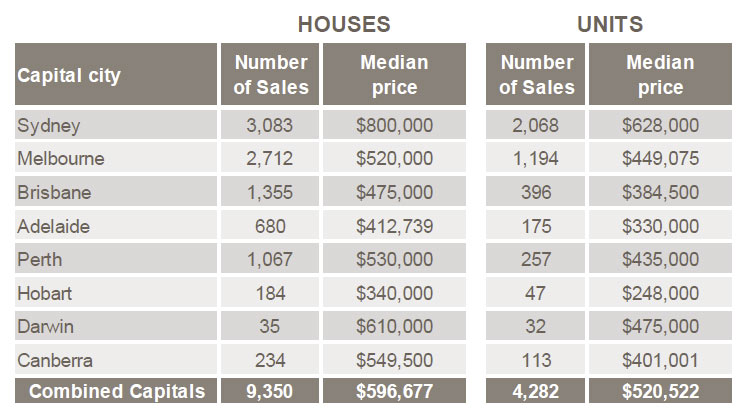
The ABS released their data on Residential Property Prices to March 2015. The total value of Australia’s 9.5 million residential dwellings increased to $5.5 trillion. The mean price of dwellings in Australia is now $576,100, an increase of $8,400 over the quarter. Sydney continues to drive residential property price increases with the Residential Property Price Index (RPPI) for Sydney rising 3.1 per cent in the March quarter 2015 and 13.1 per cent in the previous year. Established house prices for Sydney rose 3.8 per cent and attached dwelling prices rose 2.2 per cent.

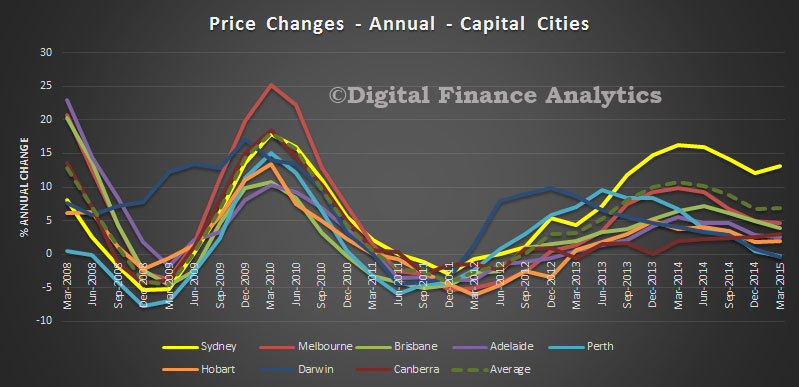
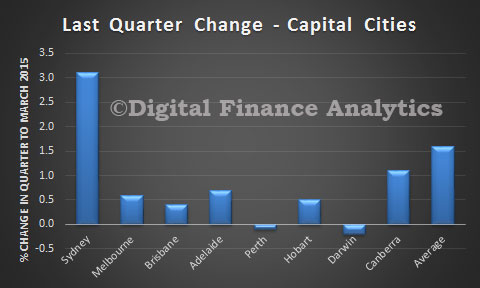
The price index for residential properties for the weighted average of the eight capital cities rose 1.6% in the March quarter 2015. The index rose 6.9% through the year to the March quarter 2015. The capital city residential property price indexes rose in Sydney (+3.1%), Melbourne (+0.6%), Brisbane (+0.4%), Adelaide (+0.7%), Canberra (+1.1%) and Hobart (+0.5%) and fell in Darwin (-0.2%) and Perth (-0.1%). Annually, residential property prices rose in Sydney (+13.1%), Melbourne (+4.7%), Brisbane (+3.9%), Adelaide (+2.5%), Canberra (+3.0%) and Hobart (+1.9%) and fell in Darwin (-0.4%) and Perth (-0.3%).

House-Price-CHanges-to-March-2015-Trend
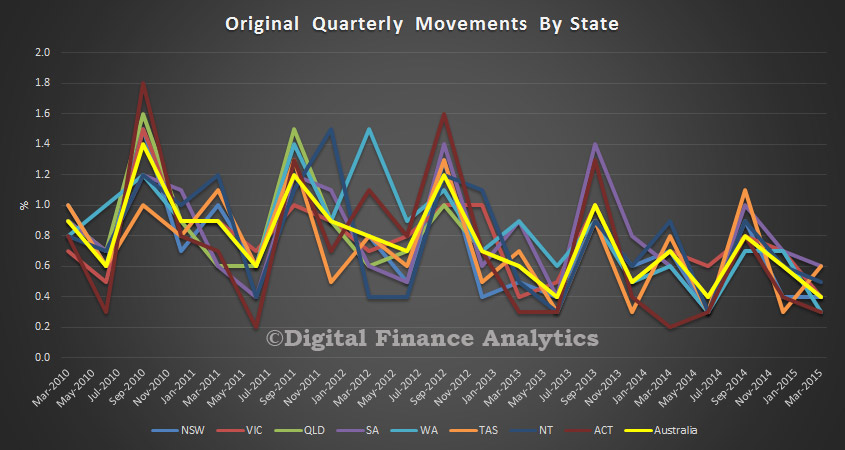
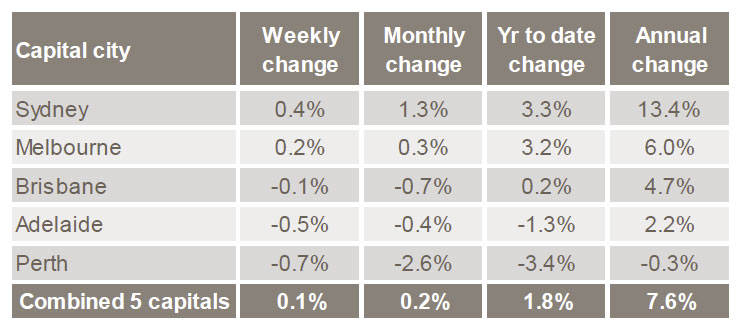
We see how Sydney steamed ahead of other states in the last quarter.

House-Price-Change-March-Q-2015
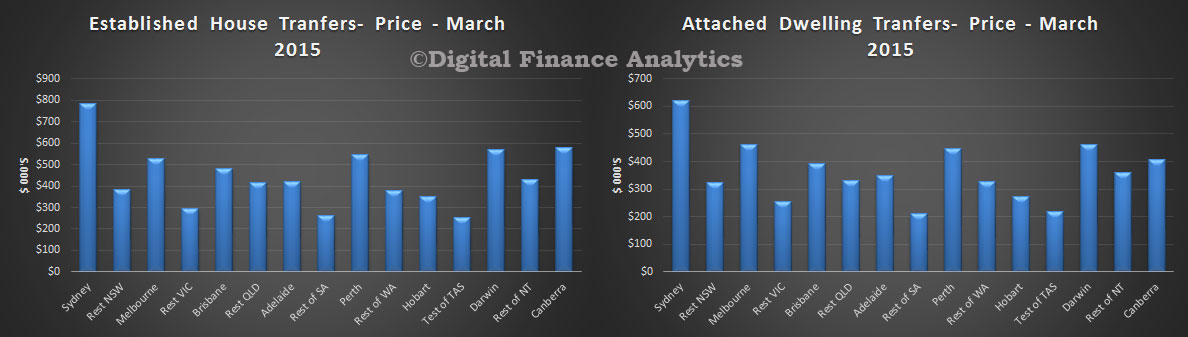
We also see significant differences between the relative price of established houses and attached dwellings in Sydney compared with other centres, the rest of the states outside the capital cities.

Average-House-Prices-March-2015---Cities-and-Rest
A review of the Residential Property Price Indexes was undertaken in 2014 as a response to planned reductions to the ABS work program. The outcomes of the Review were released on the ABS website in a feature article in the September 2014 issue of Residential Property Price Indexes: Eight Capital Cities. The implementation of the review outcomes is occurring in this issue.

In summary, the changes in this issue are:

  • all Australian residential property sales data used to compile the price indexes and related statistics are now supplied to the ABS by CoreLogic RP Data;
  • from the March quarter 2015 the suite of residential property price indexes are considered final;
  • the method of calculating prices in the total value of the dwelling stock has been modified due to the change in timing of this release;
  • the unstratified median price and number of dwelling transfers series are now being published up to the current quarter.

Australia Becoming a Nation of Landlords – AFR

The AFR report cited research provided by DFA from our household surveys.

Australia is becoming a nation of landlords as record-high real estate prices force house-hunters into buying and renting investment properties rather than becoming owner-occupiers, analysis of purchases reveals.

Property investors are also becoming younger and more likely to own several rental properties, with the number of investors with more than five properties having increased by 35 per cent in the past 12 months, from 175,000 to 272,000, according to research by Digital Financial Analytics.

For the first time since records began, more first-time buyers are expected to be investors rather than owner-occupiers by the end of this year, heralding a major change in the nation’s home-owning culture, the research reveals.

The big increase in property investment is “a tower of dominoes”, said Martin North, principal of Digital Financial Analytics, a research firm that works for big banks and financial services companies.

“The question is whether fundamentals like a shortage of supply being soaked up by tenant demand will get us out of jail,” he said. “I think we probably have enough disequilibrium between supply and demand to support the market for the next couple of years.”

Mr North’s research highlights the number of first-time property buyers who rent the property and then remain at home with their parents or live in a communal arrangement with friends.

During the same period, the number of want-to-buys, first-time buyers, refinancers, up-traders and down-traders remained about the same.

The number of loans to first-time buyers fell in all states and territories except Tasmania during the March quarter, according to government statistics.

Loan spruiking widespread

Financial advisers are routinely being offered commissions of between 5 per cent and 10 per cent, or fees of $25,000, to encourage investors to take out limited-recourse loans to buy apartments.

Alternatively, finance brokers, who often work with developers, have been encouraging the widespread use of non-bank interest-only loans using the equity in the investor’s home as security and borrowing about 20 per cent of the value of the investment property to cover the deposit and purchase.

Rental income from the investment property is expected to cover all costs and any capital growth is then leveraged to buy the next property.

Interest-only loans only require repayment of the interest on the loan over the rolling five-year borrowing term.

Mario Borg ​, a finance strategist at Melbourne-based Strategic Finance who owns 10 properties and estimates his worth at more than $10 million, disagrees that portfolio investors are exposed to excessive risk.

Borg believes attractive properties where people want to live will always find a tenant and is confident the right financing structures will protect portfolios from market corrections. He never allows the loan-to-value ratio to drift above 50 per cent of the portfolio’s value and maintains a credit limit of 80 per cent of the portfolio value to cover any unforseen events.

Christopher Foster-Ramsay, owner of Foster Ramsay Finance, says investors need to be aware of the risks, particularly if prices begin to fall.

“Many want to live the dream without understanding what they are potentially getting into,” he said.

By any international standard, such as loan-to-income ratio or gross domestic product-to-house prices, the nation’s bill for house buying is about 30 per cent above the long-term trend.

RBA Caused The Bubble – AFR

Strong piece from Chris Joye in the AFR today.

There’s only one party to blame for Australia’s unprecedented house price bubble. And it’s not buyers, vendors, developers, immigrants or local councils restricting new approvals. While they have all contributed to the underlying demand and supply dynamics, the unsustainable price growth across Sydney and Melbourne since January 2013 is squarely the responsibility of the monetary policy mandarins residing in the Reserve Bank of Australia’s Martin Place headquarters.

It is these folks who dismissed our repeated warnings that they were blowing the mother of all bubbles and instead decided that the cheapest mortgage rates in history—enabled by cutting the cash rate a full 100 basis points below its global financial crisis nadir – is the elixir required to maintain “trend” growth. Never mind that this might actually be bad, productivity-destroying growth based on distorted savings and investment decisions that will have to be reversed when the price of money normalises.

And let there be no doubt this bubble is without peer. The dollar value of our homes, mortgage debt and house prices measured relative to incomes, and the share of speculative investors purchasing properties, have never been higher. So as far as valuations and interest rates are concerned, we might as well be exploring the surface of the Sun.

Slashing the cash rate to 2 per cent in May – or about 50 basis points below Australia’s core inflation rate – in the name of centrally planning economic activity is having other deleterious consequences. Setting aside the adverse effects of the absurdly cheap 3.49 per cent fixed and 3.98 per cent variable loan rates now offered, we have banks like Macquarie claiming that the 1.9 per cent interest paid on its market-leading at-call deposit product is “healthy”. Every day I meet retail and institutional savers struggling to figure out how to earn a decent return without assuming unacceptable risks that could decimate their wealth. With the Australian sharemarket down more than 8 per cent from its April highs  and major bank stocks off more than 16 per cent, chasing dividend yields is patently not the answer for the defensive part of your portfolio.

Bubble Smuzzle

The sudden talk of bubbles in the property market, by the regulators and treasury, looks like an attempt to talk the housing market down whilst not really doing that much in reality, and leaving space for more rate cuts in the cash rate as broader economic activity slows. The RBA’s low rate strategy is partly to blame. But, is it really a bubble? Well. If you look at the growth in house prices now compared with a decade or more ago, growth in the past three years in every capital city is lower than it was in the period 2001-2004. Darwin and Hobart are the centres with growth which most closely match the ramp up in 2001 onwards and the current rises.

We did not have the 20-40% corrections post the GFC that the USA and UK had, prices tended to stall, or rise slowly, but we started the current run-up from a higher base position.

The next point is that household debt is higher compared with GDP than it has ever been, and whilst the savings ratio is high, it is now actually falling. The current low interest rates are encouraging people to grab a loan, and buy a property, especially investment property. It’s simple, low interest rates, negative gearing to offset costs, and the prospect of capital growth makes property investment compelling, as it is in a number of other countries. Indeed, overseas investors are joining in the fun (and FIRB has not tackled the issue). First time buyers are going direct to the investment sector, and down traders are selling up, releasing cash and investing in leveraged property. It’s all very logical.

Demand is also being stoked by population growth, including migration, and the expanding number of households in Australia. We have not built enough property for more than a decade, so there is more demand against supply. Also, we have more single person families (thanks to relationship breakup, older singles, and other people preferring to live alone). So we need different types of property, and more of it.

Because supply/demand is out of kilter, prices are rising, it’s not a bubble, its fundamental economics. We need to think about three factors, first, interest rates are low and will at some time rise, many people who have borrowed today and can afford repayments will find it increasingly difficult if rates rise, mortgage stress is quite high today, at low rates, and will rise. Second, income growth is flat, and this means that people won’t get out of jail as they did in 2001+, because incomes rose faster then, and helped to ease the pain when rates rose. Also, rentals are more linked to incomes than house prices, so rental income wont lift much. Third, on any absolute measure, (Loan to income, Prices to GDP) we are 25-30% above the long term norm. At some point it will correct – but it’s a structural problem not a bubble. This is true in all major centres, and is also spilling out into the regional areas. It’s not just a Sydney-Melbourne thing.

The solution requires joined up thinking. We need to revisit negative gearing. Plan better to build more houses, tighten lending and capital rules to restrict bank lending, tackle foreign purchasers and provide innovative options to assist first time buyers back into the owner occupied sector (joint equity share arrangements is my bet). Finally, and desperately, we need to deflect the banks appetite to lend to housing towards productive lending to business because this will give productive growth, not useless asset price growth and bank balance sheet growth. We need to ease price growth, and get back to trend. This will be painful and politically charged. On the supply side, we need to build more, reduce new development taxes and change planning regulations.

Meantime we have property which is chronically overvalued. Not a bubble, a structural problem. I doubt Canberra will do much more than hold yet another inquiry into housing (Oh, Hockey kicked one off a couple of weeks ago!)

Residential Property Prices Increased Significantly YOY in Real Terms 4Q14 – BIS

The Bank for International settlements released their latest cross-country house price database. They highlight the volatile nature of property, and longer term, contrasts the rise and rise we have seen in Australia, with very different stories elsewhere. Between 2007 and now, prices in real terms are still lower than they were then in US, UK and Japan. In Australia, and Canada, they are higher. Real residential property prices had almost doubled in Brazil and had risen by 80% in India; but they had declined by almost one third in Russia.

“In the fourth quarter of 2014, residential property prices increased significantly year on year in real terms (ie deflated by the CPI) in several advanced economies. They grew by 3–5% in Australia, Canada and the United States, and by around 10% in Sweden and the United Kingdom. Real prices increased by 1% in the euro area, although there were important disparities among member states: they rose by 16% in Ireland and more moderately in Germany and Spain, but continued to decline in France, Greece and Italy. Prices also fell in Japan. The picture was also mixed among major emerging market economies. Property price inflation remained strong in India, and to a lesser extent in South Africa and Turkey, but prices continued to fall in China and Russia.

BIS-PPty-May-2015-1From a longer-term perspective, residential property prices generally peaked in real terms in 2006–07 in most advanced economies. Since the end of 2007, they had decreased by 14% in the euro area, reflecting a fall of around 40% in Greece, Ireland and Spain, and by 23% in Italy, partly offset by a price increase in Germany. As of the fourth quarter of 2014, real prices were also still well below their 2007 levels in the United States (by 13%) and, to a lesser extent, Japan and the United Kingdom. Most other advanced economies, such as Australia, Canada, Norway, Sweden and Switzerland, had registered a significant rise in property prices over the previous seven years. Among major emerging market economies, real residential property prices had almost doubled in Brazil and had risen by 80% in India; but they had declined by almost one third in Russia.”

BIS-PPty-May-2015-2


Pay Rises Slacken Further

The latest ABS data shows that to March 2015 pay increase momentum slackened further. The trend index and the seasonally adjusted index for Australia rose 0.5% in the March quarter 2015. The Private sector rose 0.4% seasonally adjusted, and the Public sector rose 0.5%.

PayMarch2015TrendsThe trend was similar across the states, other than in TAS.

PayOrignbalStatesMarch2015 The rises in indexes at the industry level (in original terms) ranged from 0.1% for Administrative and support services to 1.0% for Education and training.

The trend and seasonally adjusted indexes for Australia both rose 2.3% through the year to the March quarter 2015. Rises in the original indexes through the year to the March quarter 2015 at the industry level ranged from 1.6% for Professional, scientific and technical services to 2.8% for Education and training.  Given that core inflation is running at 2.4%, in real terms many households are going backwards.

CPICoreApril2015

It is worth comparing the trends now and in the early 2000’s. We see that incomes were rising faster then, and though house prices rose quite strongly, the growth profile was different. We know that many households got out of jail thanks to lower interest rates AND rising real incomes. This time, house prices and rising strongly (especially in some centers) but incomes are going backwards. If and when interest rates start to rise, this will lead to a world of pain.

INcomeandHousePricesMarch2015


Lazard Warns On Australian Property

According to the Australian today, Lazard Asset Management fund managers are concerned about the banks’ skyhigh valuations and the risks of a housing market correction.

“…it’s record high household debt in a hot property market — a more worrying scenario for it tends to cause deeper economic pain.

“Property prices, bank valuations — we’re still in the pre-2007 paradigm: as soon as we get a rate cut, we go out and buy another property,” Mr Hofflin said, citing higher median prices in Wagga Wagga than Chicago.

“What happened in the US in terms of the wealth effect when property fell could be worse here because property dominates Australians’ balance sheet … and because prices are so high in the first place.

“If you have an asset that is expensive but there’s no debt against it, we think it’s much less dangerous to the economy … in this case there is a lot of debt against it.”

While there is a view that Australia’s circumstances such as tight land supply and tax incentives protected the nation from a property collapse, regulators are growing increasingly concerned, particularly in Sydney.

As chief banking regulator Wayne Byres noted last week, the nation’s good housing fortune over the years “doesn’t mean that will always be the case”.

Mr Hofflin, fresh from speaking at the national “Big Day Out” events for financial advisers, shares regulators’ concerns about the state of lending, where almost half of new loans are to investors and 45 per cent on interest-only terms. He added that if you use gross rental yields, costs and taxes to generate, residential property is trading on a massive 60 times earnings — four times the value investors ascribe to the stock­market.

The housing credit boom and insatiable appetite for yield stocks has pushed bank market capitalisations to about 35 per cent of the stockmarket, a level Mr Hofflin said he’d never seen before”.

Hot Sydney Market Distorts National Property Picture

The CoreLogic RP Data Market Summary to 8th March highlights the disparity between the Sydney market and other capital cities. For example, the monthly lift in prices was 1.3% in Sydney, compared with a combined capital city change of 0.2%. It should also sound a warning, if the London market is anything to go by.

8MarchValues2015Auction clearance rates in Sydney were at 83.3%, compared with a weighted average of 73%, and half of all properties sold were in Sydney (677 out of 1,227).

8MarchAuctions2014The average house price in Sydney has now broken above $800,000, compared with a combined average of $596,677.  8MarchPrices2015A word of warning, parallels have been drawn between Sydney and the London property markets in recent time. So, its worth reflecting on this commentary relating to the London market.

Further evidence is emerging that the central London housing market bubble has burst and price falls are spreading throughout the rest of Greater London, the latest index suggests. Prime central London prices are still falling as the supply of properties rises and confidence in property as an investment ebbs away,’ according to the data from Home.co.uk. Central London locations dominate the latest list of biggest house price falls across the UK, with Walworth in the London Borough of Southwark seeing a 15% fall in average house prices between January 2014 and January 2015.

House prices in Belgravia fell by 10.3% over the same period and Cromwell Road in Kensington saw a slump of 8.3%. Of the 20 UK areas with the biggest annual fall in sales prices, 11 are in London. Landlords’ return on investment on central London properties is also falling. Of the 15 UK locations recording negative real % yield, which occurs when the value of the property depreciates by more than the annual rent, 12 are in central London.

The index shows that in January 2015, landlords with a property in Walworth recorded a negative real % yield of 11.3%, while in Belgravia the negative real % yield stood at 7.1%.

Central London flat prices are among the hardest hit. On average, the price of a flat fell by 9% in central London between January 2014 and January 2015. Over the same time, the number of flats for sale in central London has increased by 64%.

Since November 2013, the price of a typical flat in Belgravia has fallen 20%, from £1,995,000 to £1,600,000. A similar price correction has already spread into Islington, where the typical asking price of a flat has dropped 11% since March 2014. This represents a loss of £85,000 for flat buyers in Islington over the last 10 months.

There is further evidence that price falls are rippling out to more remote areas of Greater London and look set to spread further into the South East. The spectre of negative equity is looming large for recent buyers.

Further out in Greater London, Holloway flat prices peaked in May 2014 but have since dropped by 13%, while the typical time on market for flats in the area has more than doubled. Meanwhile, Muswell Hill in North London has seen flat prices fall 4% since October last year.

‘Optimism in the UK housing market is still riding high in the rest of the country, but it comes as a shock to many to learn that prices are?crumbling in the most expensive streets in London,’ said Doug Shephard, Home.co.uk director.

‘These price movements may soon have a knock-on effect for the rest of Greater London and, later, the Home Counties,’ he added, pointing out that prices in central London went up too far, too fast during 2012 and 2013.

‘In a synthetic property boom and bust such as London has experienced, on account of ultra-low interest rates and other stimulus measures, it is hard to imagine any possible remedial action on the part of the government. Prices this time may simply have to fall back to a more natural equilibrium,’ he added.

It’s The Supply Side Stupid!

Housing is, no surprise, an issue in the NSW election, with Baird promising to facilitate a small number of extra homes (20,000 over 4 years) and Labor talking about deferring stamp duty for first time buyers.

Here is the thing. DFA modelling for NSW indicates we need an additional 150,000 homes in and around Sydney, each year, for the next three years, just to bring things back to equilibrium. Many of these should be starter homes in the inner suburban area, not on the urban fringe. We also need properties designed for older less mobile households.  Our modelling takes account of net migration, demographic shifts, and household preferences. In particular we know there is demand for units and small houses in the inner suburban area, from both first time buyers and investors.

We do not believe that further “assistance” to first time buyers, whether via stamp duty, or access to super, per Hockey’s comments recently have any economic merit (more likely they should be seen as dog whistle politics).

Anything which eases the purchase price will simply lift the price, as for example in the now defunct first time buyer incentives.

The right question is how will policy be changed to release more land for development, and how will planning regulations be tweaked to allow the development of starter homes. How many will be built? If the answer is not in the 100,000’s we do not have the right answer. Such an inflection in supply would have a dampening effect on house price growth.

The root cause of the current issues in property in NSW goes back to pure Economics. Simply put, supply and demand are out of kilter.

On the supply side, not enough property is being constructed to meet increasing demand from local and overseas purchasers. Either space is a problem, land releases have not kept pace, or builders cannot get funding.

Demand is being stoked by demographic shifts, like more single households, older independents and young families. Also, investment purchasers see property as a good hedge against wider uncertainty, so are very active. Many can enjoy tax breaks. Plus Chinese investors have become a major force.

Thanks to the banks, purchasers can borrow more, and this lifts prices. First, low interest rates are making larger mortgages more affordable. Second, they have been able to increase the supply of home lending credit, thanks to lower capital rules, especially for those using the most sophisticated capital management. Next, they see risks in property lending much lower than commercial lending, so are happy to skew their portfolio. Finally, they have changed their lending criteria (although some regulators are pushing back), making larger loans possible, for some.

As a result, rising property prices are artificially lifting bank and household balance sheets. History shows that prices won’t necessarily defy gravity for ever. If they do correct there could be significant consequences for households, banks and the community.

We need proper supply-side strategies.


House Prices Lift In February

CoreLogic RP Data February Home Value Index results released today showed that Australia’s combined capital cities have seen dwelling values rise by a further 0.3 per cent in February taking home values 8.3 per cent higher over the past twelve months. The monthly rate of growth slowed from 1.3 per cent in January and 0.9 per cent in December, however the growth trend remains strong, particularly in Sydney and Melbourne.

Sydney is once again the clear standout with dwelling values 13.7 per cent higher while Melbourne values are 7.4 per cent higher. Australia’s third largest city, Brisbane, recorded the third highest rate of annual capital gain with dwelling values up 5.9 per cent. In contrast, dwelling values have increased by less than four per cent in every other capital city over the year.

Since the beginning of the growth cycle in June 2012, dwelling values have moved 22.6 per cent higher across the combined capital cities.  However in Sydney values are up 34.8 per cent cumulatively over the cycle to date across Australia’s largest capital city.

Evidence of compressed rental yields is continuing across each of the capital city markets. A year ago the gross rental yield for a capital city dwelling was averaging 4.3 per cent; by the end of February the typical gross yield has been eroded down to just 3.7 per cent – due largely to the consistent high rate of dwelling value growth relative to rental growth. In Melbourne, the yield profile is the lowest of any capital city with the typical Melbourne dwelling showing a gross yield of just 3.3 per cent. Sydney isn’t far behind with a gross dwelling yield of 3.6 per cent.

Total returns in Sydney are approaching the 20 per cent mark over the past twelve months, substantially outperforming other asset classes.  This compares with 11.1 per cent in Melbourne and 10.9 per cent in Brisbane. Given low returns from bank deposits, and full share prices it is not surprising to see continued momentum in the investment sector.

DFA believes these trends suggest the RBA should hold off on a further rate cut tomorrow, unless, and until macroprudential levers can be pulled to take some of the exuberance from the market.