Today we continue our series on the latest results from our households surveys. Following our recent posts, we had several people ask about trends around some of the metrics we use. We have been running these surveys since 1995. So in this post we present a summary of trends from 1995 onwards. It provides an interesting perspective on how households have changed their behaviour in recent years.
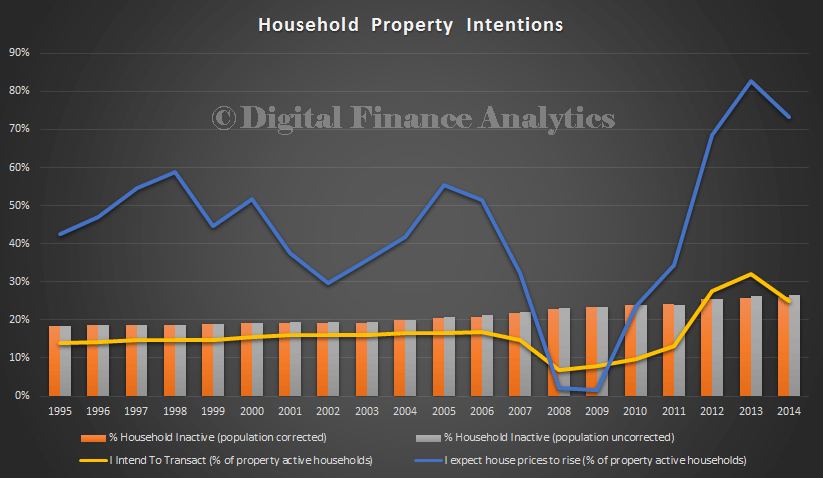
 To explain the data, the bars show the rising trend in those households who are property inactive (inactive because they do not own property, and do not intend to in the foreseeable future). We show the percentage as a raw split, and also an adjusted split, to take account of population growth across states. The ratio of active to inactive households varies across individual states, and across geographic bands within states.
We also show the proportion of households who said they intended to transact in the next 12 months, and also their expectations, at the time, of house price movements for the next 12 months. Intention to transact was sitting at around 15% of households, until it fell as a result of the GFC. Since that time, it has powered ahead, and is significantly above long term trend – though note the recent fall. Turning to the proportion of households expecting property prices will rise in the coming 12 months, this is more variable, although the long term average prior to the GFC was close to 50%. If fell significantly in 2008 and 2009, before recovering, and reaching a high of 80% in 2013. It is still above long term trend, though falling slightly.
This data highlights the significant demand pressures on the property market, and helps to explain the high prices being achieved, although our interpretation is that the peak is now passed.
Next time we will consider households considering investment property.
