We continue our series on the latest ATO data with a look at Greater Brisbane, using the recently released 2015 taxable income data from the ATO, as a drill down on the all Australia data we previously posted. Blue shows the higher taxable income areas.
Tag: Household Finances
Taxable Income Mapping Greater Sydney 2015
Here is the geomap for Greater Sydney, using the recently released 2015 taxable income data from the ATO, as a drill down on the all Australia data we previously posted. Blue shows the higher taxable income areas.
One In Three Households Have No Mortgage Buffer – RBA
The latest Financial Stability Review from the RBA has a different tone to it, compared with previous edition, because whereas they have previously played up the “cushion” some households have by paying their mortgages ahead, now they say one third of households have no buffer and are exposed to potential interest rate rises. What has changed is not the underlying data, but how it is being presented. Here are some key extracts.
In Australia, vulnerabilities related to household debt and the housing market more generally have increased, though the nature of the risks differs across the country. Household indebtedness has continued to rise and some riskier types of borrowing, such as interest-only lending, remain prevalent. Investor activity and housing price growth have picked up strongly in Sydney and Melbourne. A large pipeline of new supply is weighing on apartment prices and rents in Brisbane, while housing market conditions remain weak in Perth.
Nonetheless, indicators of household financial stress currently remain contained and low interest rates are supporting households’ ability to service their debt and build repayment buffers.
The Council of Financial Regulators (CFR) has been monitoring and evaluating the risks to household balance sheets, focusing in particular on interest-only and high loan-to‑valuation lending, investor credit growth and lending standards. In an environment of heightened risks, the Australian Prudential Regulation Authority (APRA) has recently taken additional supervisory measures to reinforce sound residential mortgage lending practices. The Australian Securities and Investments Commission has also announced further steps to ensure that interest-only loans are appropriate for borrowers’ circumstances and that remediation can be provided to borrowers who suffer financial distress as a consequence of past poor lending practices. The CFR will continue to monitor developments carefully and consider further measures if necessary.
Investor credit has also risen noticeably over the past six months, with investor demand particularly strong in Sydney and Melbourne (Graph 2.3).
Overall household indebtedness has increased while income growth has remained weak. Some types of higher-risk mortgage lending, such as IO loans, also remain prevalent and have increased of late.
The risks associated with strong investor credit growth and increased household indebtedness are primarily macroeconomic in nature rather than direct risks to the stability of financial institutions. Indeed, some evidence suggests that investor housing debt has historically performed better than owner-occupier housing debt in Australia, though this has not been tested in a severe downturn. Rather, the concern is that investors are likely to contribute to the amplification of the cycles in borrowing and housing prices, generating additional risks to the future health of the economy. Periods of rapidly rising prices can create the expectation of further price rises, drawing more households into the market, increasing the willingness to pay more for a given property, and leading to an overall increase in household indebtedness. While it is not possible to know what level of overall household indebtedness is sustainable, a highly indebted household sector is likely to be more sensitive to declines in income and wealth and may respond by reducing consumption sharply.
A further risk during periods of strong price growth is that it may be accompanied by an increase in construction that could result in a future overhang of supply for some types of properties or in some locations. In this environment, as well as amplifying the upswing for such properties, any subsequent downswing is likely to be larger and more likely to see prices and rents fall if the vacancy rate rises. This poses risks to the whole housing market and household sector, not just to the recent investors.
While the financial position of households has been fairly resilient, vulnerabilities persist for some highly indebted households, especially those located in the resource-rich states. Household indebtedness (as measured by the ratio of debt to disposable income) has increased further, primarily due to rising levels of housing debt, although weak income growth is also contributing. Rising indebtedness can make households more vulnerable to potential income declines and higher interest rates. This is of most concern for households that have very high levels of debt.
Low interest rates are helping to offset the cost of servicing larger amounts of debt and hence total mortgage servicing costs remain around their recent lows (Graph 2.5). In this regard, lenders have tightened mortgage serviceability assessments in recent years to include larger interest rate buffers, which should provide some protection against the potential effects of higher interest rates.
Prepayments on mortgages increase the resilience of household balance sheets. Aggregate mortgage buffers – balances in offset accounts and redraw facilities – are high, at around 17 per cent of outstanding loan balances or around 2½ years of scheduled repayments at current interest rates. However, these aggregate figures mask significant variation across borrowers, with available data suggesting that around one-third of borrowers have either no accrued buffer or a buffer of less than one month’s repayments. Those with minimal buffers tend to have newer mortgages, or to be lower-income or lower-wealth households.
Interest-only (IO) loans account for a sizeable and growing share of total housing credit in Australia, now representing around 23 per cent of owner‑occupier lending and 64 per cent of investor lending (Graph B1). IO lending has the potential to increase households’ vulnerability in part due to the higher average level of indebtedness over the life of an IO loan compared with a regular principal-and-interest (P&I) loan.
For some time regulators have highlighted the potential risks associated with IO compared with P&I loans. Because IO loans allow borrowers to remain more indebted for longer, there may be greater credit risks associated with such loans. When loan balances stay high, there is an increased risk of borrowers falling into negative equity should housing prices decline.
Another risk is that borrowers may find it difficult to service higher required payments at the end of the IO period, which increases the chance of default. For example, repayments on a $400 000 loan with a 4 per cent interest rate and a five-year IO period would typically increase by around 60 per cent at the end of the IO period. While some borrowers may have planned to refinance into another IO loan at the end of the IO period, this may be difficult if circumstances have changed.
Borrowers who anticipate future price rises can use IO loans to maintain a higher level of leverage for a given servicing payment, thereby magnifying their returns from rising housing prices but also magnifying any losses. More generally, at an aggregate level this behaviour could induce a more pronounced cycle in housing prices than would otherwise occur, amplifying the size of any subsequent downswing in housing prices.
Latest From The RBA – Household Debt Climbs Again
The RBA just released their chart pack for April. As usual we went straight to the household finances section, and yes, debt as a percentage of disposable income is up again.
Property And Household Financial Footprints
Data from the Digital Finance Analytics Core Market Model tells an interesting story when we look at households dependence on wealth from property.
To illustrate the point, here are three charts, looking at different household groups. The first is the owner occupied mortgage group.
The blue area represents the distribution of households by age bands. The yellow line shows the relative value of total net worth (assets less debt, including superannuation). The green dotted line shows the value of property, in today’s terms, and the red line the current mortgage. It is very clear that older Australians have greater net assets and smaller mortgages. It is also clear that much of that worth is from paper profits relating to property. They would take a bath if prices were to fall.
Households without a mortgage have greater worth in other savings vehicles, including shares, deposits and property. They are more insulated from property value falls, and of course would not be hit by rising mortgage rates directly.
Finally, those who rent have a lower average net worth. Younger renters have little in the way of assets, whereas older renters on average hold higher balances, partly thanks to superannuation.
The analysis reconfirms how critical property values are to overall net worth. As a nation, we are highly exposed to future price movements. Any correction, whilst it might make property accessible for first time buyers, will seriously erode the net worth of households, especially those in the older age bands. The on-flow to economic outcomes suggests the risks are real, as Phillip Lowe said last night.
House price growth could create ‘systemic risk’
Australian bank hybrids, equities, term deposits and residential investment properties are all essentially one big bet on Australian housing.
The housing sector has supported the Australian economy for several years, but further increases to house prices without increases in wage growth will increase the possibility of systemic risks, says Pimco.
Housing has been the “main domestic growth engine” in Australia since the economy shifted away from mining in 2012, said Pimco co-head of Asia portfolio management Robert Mead, which improved headline economic growth but increased household debt at lower interest rates.
Mr Mead noted that average lending rates for standard housing loans as measured by the Reserve Bank of Australia (RBA) fell from 7.3 per cent in 2012 to 5.25 currently, while the RBA policy rate fell from 4.25 per cent to 1.5 per cent in the same period of time.
“This demonstrates a highly effective transmission mechanism of monetary policy: more than 76 per cent of RBA policy rate reductions have flowed directly through to the main consumer borrowing rate,” Mr Mead said.
“However, during this same period wage growth fell from over 3.5 per cent per annum to less than 2 per cent, and the unemployment rate increased from 5.1 per cent to 5.9 per cent. This suggests that the capacity of the average Australian borrower to take on additional debt was actually weakening, not improving.”
While the RBA’s monetary policy regime was “highly effective” as the economy weakened, Mr Mead cautioned the bank’s implementation of policy is likely to be made more difficult by the “significant” increase in household debt at a lower borrowing rate.
“Looking forward, we believe the current economic backdrop accompanied by some recent increases in mortgage rates by the Australian banks will keep the RBA on the sidelines for all of 2017,” he said.
“We also expect increasing reliance on macro–prudential policies to limit the upside in property prices. While housing has definitely helped support the economy over the past four to five years, any further increases in house prices that are in excess of wage growth will represent potential systemic risks for the economy.”
Mr Mead said diversification was critical to investors, and should be a key theme for portfolios.
“Australian bank hybrids, equities, term deposits and residential investment properties are all essentially one big bet on Australian housing,” he said.
The High Household Debt Hangover
A new IMF working paper “Excessive Private Sector Leverage and Its Drivers: Evidence from Advanced Economies“, aims to provide a quantitative assessment of the gaps between actual and sustainable levels of debt and identifies the key factors that drive excessive borrowing.
They explain why high household debt – such as we have in Australia – should be a cause for concern. It seems to sum up the current state of play here, very well.
High private debt can have a substantial adverse impact on macroeconomic performance and stability. It hinders the ability of households to smooth consumption and affects investment of corporations. In addition, elevated debt levels can create vulnerabilities as well as amplify and transmit macroeconomic and asset price shocks throughout the economy. Excessive private debt increases the likelihood of a financial crisis, especially when it is driven by asset price bubbles fueled by lending. The subsequent deleveraging could be potentially disruptive for economic activity.
Long-term growth prospects deteriorate significantly following debt-related financial crises. Furthermore, the accelerated pace of private debt accumulation can lead to economic and financial instability, which often coincides with great risk-taking and poorly regulated and supervised financial sector. Finally, spillovers from private balance sheets to the public sector due to government interventions, either direct in the form of targeted programs for debt restructuring or indirect through the banking sector, weaken the fiscal position and increase interest rates. All the above factors may potentially compromise public debt sustainability.
They assess the extent of excessive leverage in advanced economies, and conclude that private sector debt overhang is relatively large, with significant heterogeneity across developed economies. Household excessive leverage is found to be higher in countries with lower interest rates and higher share of working population, but importantly also in countries with rising house prices and greater uncertainty as captured by unemployment. Corporate debt overhang is estimated to be higher in countries with lower profitability, stronger insolvency frameworks and absence of thin capitalization rules.
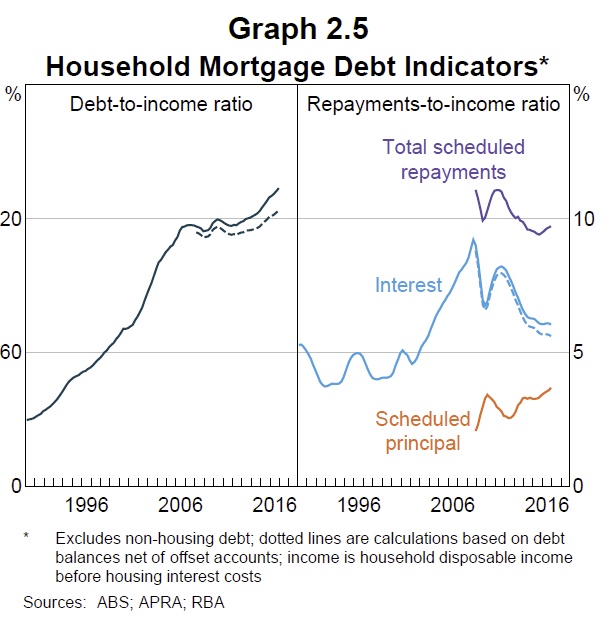
In assessing the situation, they make the point that using debt to income ratios alone, omits an important aspect of debt sustainability – the strength of the borrower’s balance sheet. Debt can be repaid not only from future income but also by selling assets; hence, solvency indicators, such as the debt to asset ratio, are widely used in debt sustainability analyses.
They apply a “deflated” approach to assessing debt, starting from a base year, and compare the subsequent growth. The sum of deflated financial and non-financial assets represents total notional assets. Similar to financial assets, deflated debt is obtained by adding debt transactions to the initial stock of debt. Deflated sustainable debt is then calculated as deflated debt in the initial year, increased by the change in notional assets and corrected for transitory changes in the nominal debt-to-asset ratio (which is assumed stationary). In other words, deflated debt is considered sustainable when it evolves with deflated assets. Excessive leverage is measured by the difference between the actual and sustainable debt.
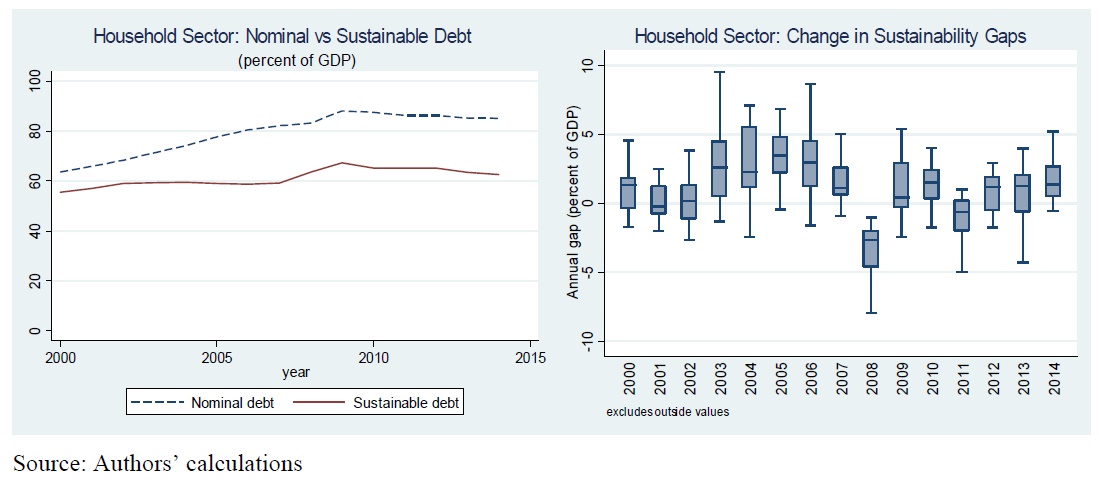
The results from our empirical analysis suggest that in a number of advanced economies household and corporate debt has increased to levels that may not be sustainable. Most of the debt build-up took place before the financial crisis, but with a few exceptions, there has been little deleveraging in the post-crisis period. In a number of countries, the gap between actual and sustainable debt, calculated on the basis of notional assets continues to grow. The gaps are larger in the household sector; the borrowing behavior of non-financial corporations does not seem to have changed much on aggregate, although there is significant cross-country
heterogeneity.Drawing on the theoretical literature on household and corporate debt determinants and building on earlier empirical work, we try to identify the main drivers of excessive leverage. Most of the variables that have been found important in previous studies focusing on indebtedness, turn out to be significant in explaining the debt sustainability gaps as well. In particular, low interest rates and unemployment along with high house prices tend to be associated with larger gaps in the case of household. This implies that policymakers should pay attention to excessively low interest rates and inflated house prices to avoid imbalances that may ultimately pose risks to macroeconomic stability. While we find evidence for importance of institutions, the tax treatment of mortgage debt does not appear to be significant, although the latter could be due to difficult measurement issues. Still, this does not mean that there is no role for policies in containing leverage. For example, generous mortgage-related tax incentives that favor ownership over renting can induce excessive borrowing by households and boost asset prices which, as discussed above, are positively correlated with the sustainability gaps. Furthermore, such incentives have important distributional implications and can be costly in terms of foregone revenue for the budget.
In the case of non-financial corporations, profitability is a significant factor behind leveraging, while thin capitalization rules tend to reduce the debt overhang. Thin capitalization rules can be an effective instrument to limit excessive borrowing but they need to be well designed. In many countries such rules provide escape clauses that effectively limit them to related party debt, implying that these measures aim to reduce debt shifting, but do not deal effectively with the debt bias. Introducing a tax system based on allowance for corporate equity (ACE) would not only reduce the incentives to incur debt but would also stimulate investment as it is effectively a tax only on excess returns or rents. There is also some role for institutions because countries with stronger insolvency regimes are typically characterized by lower debt overhang.
Note: IMF Working Papers describe research in progress by the author(s) and are published to elicit comments and to encourage debate. The views expressed in IMF Working Papers are those of the author(s) and do not necessarily represent the views of the IMF, its Executive Board, or IMF management.
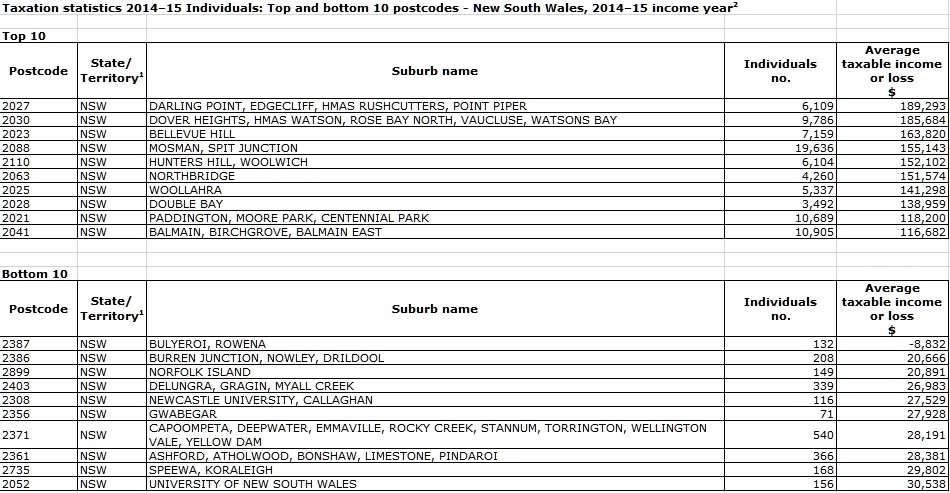
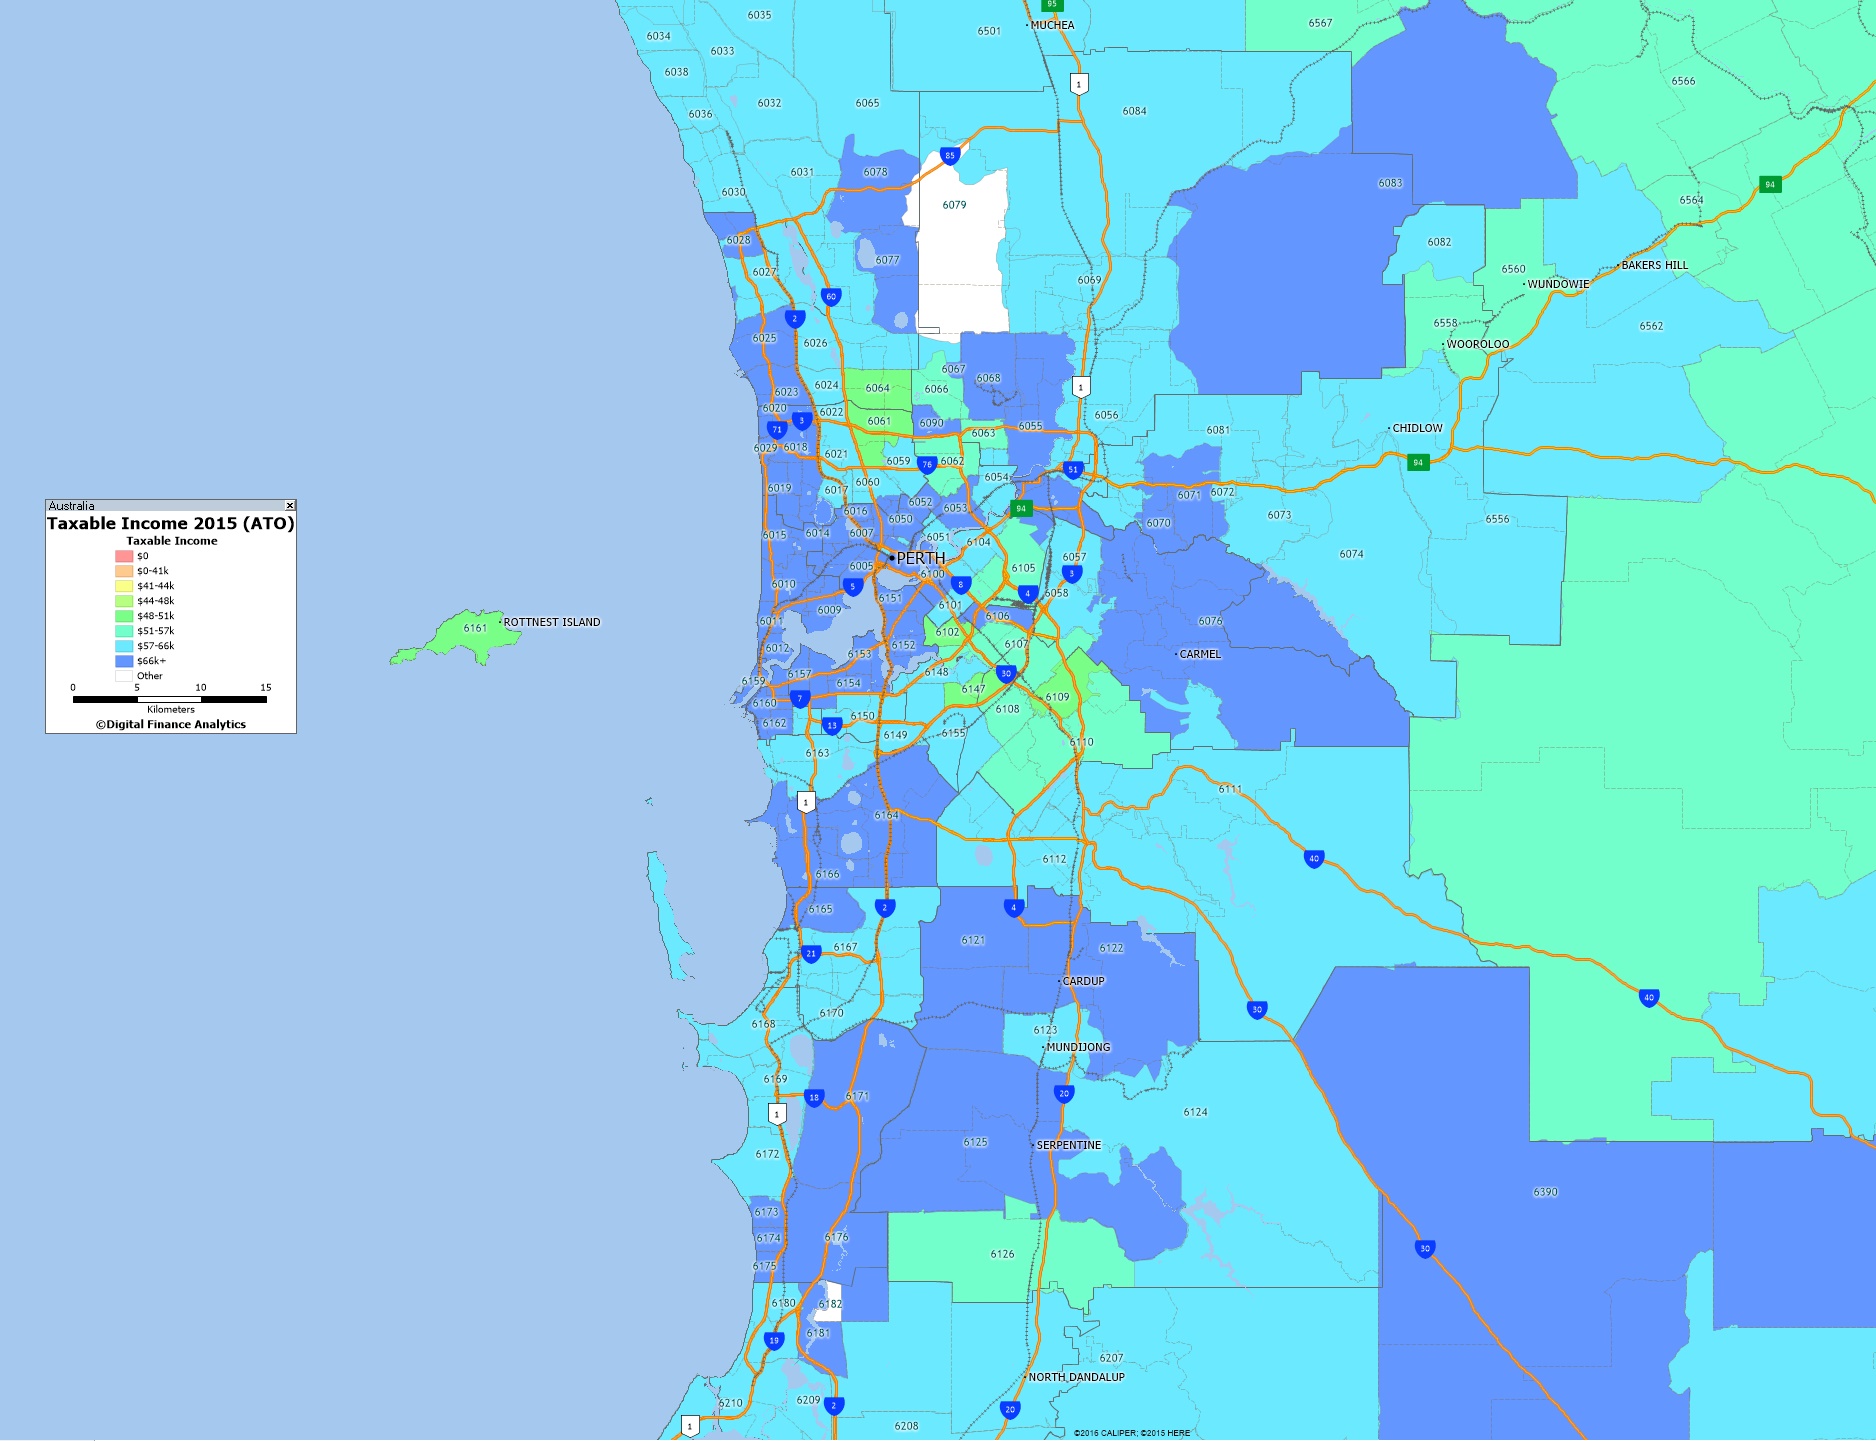
More than 1 million Australians face mortgage strife
Exclusive analysis performed for AFR Weekend has revealed that more than a million Australian home owners will struggle with mortgage stress if interest rates were to rise just three percentage points.
Data from research house Digital Finance Analytics shows that close to one in three households from Victoria, Tasmania and Western Australia will experience mortgage stress ranging from mild to severe in the event of just three rises of 25 basis points. A rise of 300 basis points, back to more normal levels, would be much more severe.
The news follows warnings from the OECD that the nation has a one in five chance of entering recession and Australia’s $6.5 trillion housing market is running the risk of a hard landing.
Runaway house prices in Melbourne and Sydney have added to the risks facing the economy as rising levels of household debt make home owners and property speculators vulnerable to unexpected moves in interest rates.
The Reserve Bank of Australia’s official cash rate, on which mortgage rates are based, is as an “emergency low” 1.5 per cent. In practice that means mortgage repayment rates are between about 4 per cent and 5 per cent of the loan amount per year.
Digital Financial Analytics principal Martin North says that a shake out in the property market would not be restricted to lower income areas and would include households in the trophy suburbs of Bondi and Lane Cove in Sydney as well as homes in the leafy green streets of Toorak and Prahran in Melbourne.
“The common theme here is affluent households paying top dollar for apartments with big mortgages and the potential to be caught out by rising interest rates and flat or falling incomes. Even places like the lower north shore are being hit” he said.
Under the modelling performed by Digital Finance Analytics, there are around 650,000 households in Australia experiencing some form of mortgage stress. The numbers are consistent with a Roy Morgan report from September 2016 that showed one in five households were experiencing mortgage stress.
The longstanding measure for mortgage stress has been 30 per cent of household income.
Mild mortgage stress might see household cut back on childcare expenses, dipping into savings or reaching for the credit card in order to make payments. Severe mortgage stress indicates that the mortgage holder has missed a payment or payments and is already considering selling the property.
If rates were to rise 150 basis points the number of Australians in mortgage stress would rise to approximately 930,000 and if rates rose 300 basis points the number would rise to 1.1 million – or more than a third of all mortgages. A 300 basis point rise would take the cash rate to 4.5 per cent, still lower than the 4.75 per cent for most of 2011.
Professor Roger Wilkins of the Melbourne Institute at the University of Melbourne produces the Household Income and Labour Dynamics Survey, regarded as one of the best sources of information about housing affordability in Australia.
He says that while mortgage stress hasn’t materially increased in recent years that a sharp rise in interest rates would be destructive to household finances everywhere.
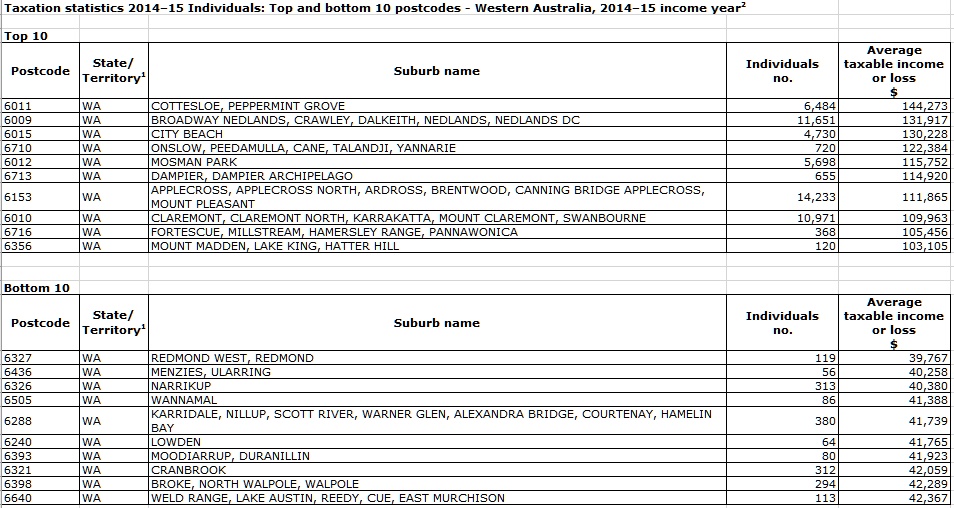
“If the cash rate goes to 6 per cent then you would expect to see a lot people in strife. Particularly with wage growth and inflation at such low levels so that does increase vulnerability to rises to interest rates” Mr Wilkins said.
Mortgage Stress Grinds Higher
We have just rerun our mortgage stress models, incorporating data to 1st March 2017. Household budgets remain under pressure, thanks to flat incomes and rising living costs – and some lifts in mortgage rates. You can read more about our approach to measuring mortgage stress here. Our current analysis concentrates on owner occupied mortgages.
Overall, 21.78% of households are in some degree of mortgage stress. We look at mild stress, meaning they are managing to meet repayments, but are doing so by cutting back on other expenditure, putting more on credit cards, and seeking to refinance or restructure to reduce monthly payments. 19.08% of households fall into this group. An additional 2.7% of households are in severe stress, meaning they are likely to miss repayments, or are in default, or are looking to sell. We look at household cash flow, not a set percentage of income going on the mortgage.
Here are the postcodes across Australia with the highest levels of stress.
Harristown, QLD 4350, which was the highest count in December 2016, still is first, followed by Leumeah NSW 2560. Leumeah is a suburb of Sydney, Macarthur/Camden, about 40 kms from the CBD. The average age of the people in Leumeah is 35 years of age. Around 37% of households there have a home loan mortgage.
Third is Frankston VIC 3199, which is a suburb of Melbourne, Bayside, It is about 39 kms from Melbourne. Frankston is in the federal electorate of Dunkley. The median/average age of the people in Frankston is 38 years of age. Around 30% of households here have a mortgage.
Fourth highest is Merriwa 6030, a suburb of South Western, Heartlands, WA. It is about 35 kms from Perth in the electorate of Pearce. 41% of homes here are mortgaged. The average age of the people in Merriwa is 35 years of age.
Once again, remember interest rates are very low, and are expected to rise, so the OECD warning about the risks in the housing sector seem well placed.
Editors Note. We updated this post to reflect the total of mild and stress, when it first appeared, we sorted only on mild stress, which changed the results slightly – and we also added back the latest probability of default metrics as well.
OECD Paints A Sanguine Picture Of The Australian Economy, Includes Housing Risks
The latest OECD Report – 2017 Economic Survey of Australia says whilst Australia’s economy has enjoyed considerable success in recent decades, the economy shares the global risk of a “low-growth trap”.
Living standards and well-being are generally high, though challenges remain in gender gaps and in greenhouse-gas emissions, and further challenges arise from population ageing.
Low interest rates have supported aggregate demand but are also ramping up risk-taking by investors and driving house prices and mortgage lending to historical highs.
A fall in house prices and or demand could have significant macroeconomic implications. Specifically, the market may not ease gently but develop into a rout on prices and demand with significant macroeconomic implications.
Macrofinancial indicators underline the threat from the housing market, with house prices and related indicators (house indebtedness, bank size), pointing to continued vulnerability. Any impact will most likely be through aggregate demand than financial instability.
They advocate tight macroprudential measures, improved housing supply, and reducing banks’ implicit guarantees by developing a loss absorbing and recapitalisation framework.
They support a cut in company tax, and an expansion of the GST, switching from transaction taxes (like stamp duty) to land taxes.
They say the economy is now rebalancing following the end of the commodity boom, supported by macroeconomic policies and currency depreciation. The strengthening non-mining sector is projected to support output growth of around 3% in 2018 and spur further reduction in the unemployment rate.
Improving competition and other framework conditions that influence the absorption and development of innovation are key for restoring productivity growth.
Innovation requires labour and capital markets that facilitate new business models. Productivity growth could be boosted through stronger collaboration between business and research sectors in R&D activity.
Australia’s adjustment to the end of the commodity boom has not been painless. Unemployment has risen, and there are increasing concerns about inequality.
In addition, large socioeconomic gaps between Australia’s indigenous community and the rest of the population remain. Developing innovation-related skills will be important for the underprivileged and those displaced by economic restructuring, and can help reduce gender wage gaps.
Externally, Australia, as always, is exposed to the vagaries of global commodity markets and this might include a renewed plunge in prices (or, positively, a strong resurgence). Australia’s iron ore production is among the lowest cost in the world and therefore comparatively insulated from such developments, however its coal sector is relatively more exposed as its production is distributed across the cost curve. Interaction of downside scenarios is likely to exacerbate the negative macroeconomic outcomes.
For instance, a negative external shock could lift unemployment sharply which would result in significant fall in consumption and rising mortgage stress and falling house prices. The economy is well positioned to handle shocks. The speed and strength of the rebalancing processes in response to the end of the commodity boom auger well for the economy’s shock-absorbing capacity. In addition, Australia has more reserve capacity for monetary and fiscal stimulus than many other OECD economies.
The slideshow is available here.