Choice Calls For Easier Credit Card Cancellation

Choice, the consumer group, has called for consumers to be able to cancel their credit cards immediately online, rather than jump through the hoops which the banks currently prescribe.

They recently reviewed the cancellation policies of the big four and found a distinct lack of easy cancellation options.

What? No online cancellation?

Instead of being able to cancel your card online and quickly cut ties with the debt monster, the banks force you to call, write a letter or visit a branch in person.

Meanwhile, almost all other banking services – including applying for a credit card and having it approved – are available online these days.

To us, it looks like a blatant attempt to keep you attached to your credit card and keep the debt clock rolling. That’s why we’ve been pushing to have the tactic abolished since August 2015.

Our review comes as the banks are set to face a Parliamentary Inquiry on Friday this week, and it follows attempts by ANZ and Westpac to ward off credit card criticism by promising to cut interest rates on some “low rate” cards.

Jumping through hoops

Here’s what the banks require if you want to cancel your credit card.

ANZ

  1. Call or write to ANZ.
  2. Return the card: “ANZ will only cancel the credit card when the account holder has returned it to ANZ cut diagonally in half (including any chip on the card) or has taken all reasonable steps to return it to ANZ”.
  3. Any additional funds will be returned by bank cheque.

NAB

  1. Call, write “or otherwise advise NAB in a manner acceptable to NAB”.
  2. Cut the card diagonally in half.
  3. Additional funds will be returned by bank cheque. NAB will charge its “usual fee” for issuing the cheque. Cash out is only available for amounts under $5.

Westpac

  1. Call, write or visit a Westpac branch.
  2. Promise to destroy the card.
  3. Additional funds are paid by bank cheque or directed into another account by direct debit.

CBA

No instructions are provided for card cancellations in the CBA credit card ‘conditions of use’ document. Customer service representatives instructed CHOICE to call the credit card team to cancel, which can only be contacted Monday to Friday, 9.00am–5.30pm.

Chasing fees and interest

“In the age of online banking if defies belief that ANZ, NAB, Westpac and Commonwealth all require you to call or email them when seeking to cancel a credit card,” says CHOICE head of campaigns and policy Erin Turner.

“It seems clear that the big banks’ ‘go slow’ on card cancellations is about protecting revenue from interest and fees, with data showing the big banks slug consumers with an average annual fee of $146 compared to just $58 through a mutual or customer-owned banks.

“Unfortunately, getting stuck paying excessive credit card interest is only one of the traps consumers face, with many of us paying excessive annual fees when we fail to cancel a card.”

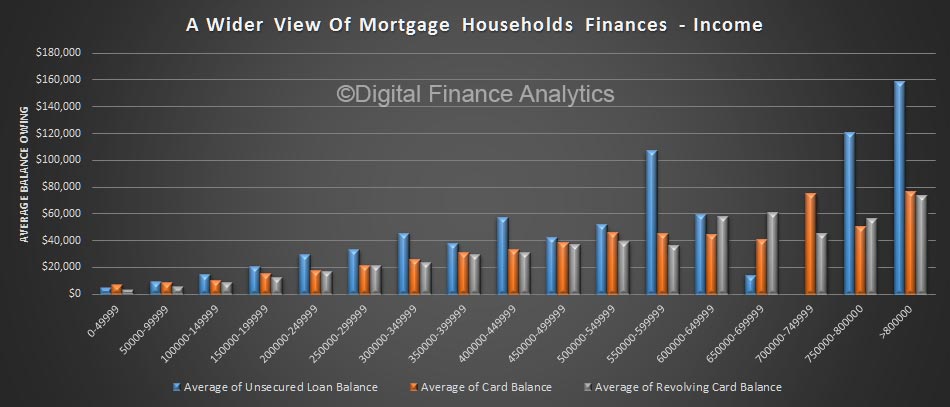
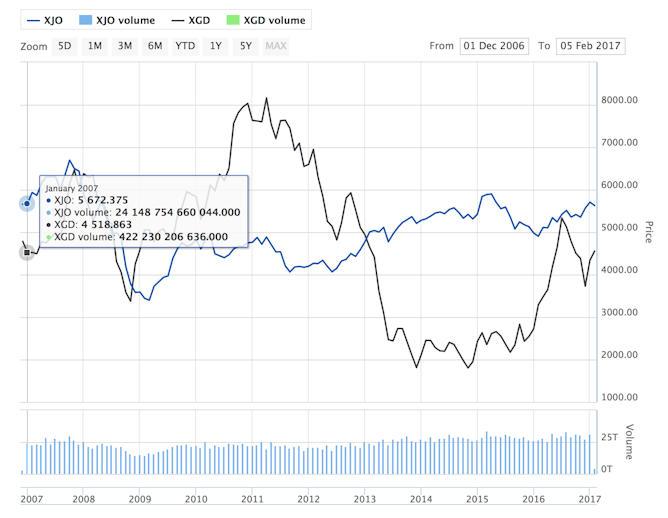
The national collective credit card debt hovers at a staggering $32 billion or so at the moment (about $4300 per cardholder). If you’re one of those consumers who’ve gotten in over your head, it’s generally a good idea to cancel the offending card once you’ve climbed out of debt.

That would be doubly true if you happen to have a card from one of the big four banks: CBA, ANZ, NAB and Westpac. Their standard interest rates are among the highest. And their so-called low-interest cards aren’t that much better – or at least not better enough.

Expect Irresponsible Lending Complaints To Rise

From Australian Broker.

A number of consumer advocates have predicted that complaints about irresponsible lending by brokers will trend upwards in future.

Speaking to Australian Broker at the Responsible Lending and Borrowing Summit in Sydney, Alexandra Kelly, principal solicitor at the Financial Rights Legal Centre of NSW said that while she had not seen any evidence of a “systemic problem” with fraud in the broker channel at present, more consumer claims could emerge once rates start rising.

“We’re still in the stage where some consumers haven’t gotten into trouble yet so we’re not necessarily seeing any issues yet because interest rates are very low,” she said.

If interest rates did start rising however, some consumers would feel the pinch, lead them to wonder whether the information supplied by the broker in their loan application was entirely correct, and approach their nearest consumer advocacy group.

“We’ve seen some very tightly wound consumers,” Kelly said. “That’s going to be the issue when there’s an increase and their mortgages start rising.”

Gerard Brody, CEO of the Consumer Action Law Centre in Victoria, agreed that there was going to be a spike in complaints.

“I think that a lot of loans – particularly broker loans – are generally higher amounts,” he told Australian Broker. “They encourage people to get bigger properties and that stretches people if interest rates go up.”

An increase in consumer complaints as a result of rate increases in the future was realistic, he said.

However, he noted that the lenders could do more to fix this issue now.

“At the end of the day, the lender has also got the same responsible lending obligations when it comes to requirements objectives, enquiries about affordability, and verification.”

Risks In The Banks’ Property Investor Portfolio

In the world of microprudential, the status of individual households and their finances becomes ever more important from a risk perspective. We have already shown that some investment property holders are near to the edge, financially speaking, and would be troubled by rising interest rates or a forced conversion from interest only to interest and principle repayments.

The Basel Committee is pushing towards a requirement for banks’ to hold higher capital where the servicing of the loan is “materially dependent” on regular rental streams. Whilst this might seem arcane when the average vacancy rates are quite low, even now there are significant state variations.  Vacancy rates in WA in particular are high.

So using data from our extensive household surveys, we have been looking at the finances of property investors, with the question of servicing the loan in mind should rental streams dry up.

To do this we created a custom data series using the following logic.

We are looking at the available funds, on a cash flow basis after living costs, servicing the OO mortgage (if held) and tax.  Next we compared this to the costs of the investment property, again on a cash flow basis.

Looking across our household segments, the more affluent households are more likely to find their available funds would not cover the costs of the investment property (all done on an annual basis), whilst those with lower incomes, and who are less affluent are actually better positioned.

If we cut the data by our property segments, portfolio property investors have the highest exposure, followed by first time buyers.

Finally, we can look across the regions, and we find that property investors in Hobart are more exposed (though rental vacancies are lower there) but property investors in NSW also more highly exposed (thanks to larger mortgages compared to income).

This alternative way to view the market could become important if differential capital weightings were to be applied.  This could move from a theoretical discussion, to one of relative risk-based pricing down the track. Most lenders would not currently differentiate on this basis.  Granular data is required to look through this lens.

Household Debt Has Become An RBA Thematic

The statement delivered today by RBA Governor, Philip Lowe, to the House of Representatives Standing Committee on Economics contains the now familiar nod towards risks associated with high household debt.  “Too much borrowing today can create problems for tomorrow, because debt does have to be repaid”. Exactly!

One area that we are watching closely is the cycle in residential construction activity, as the upswing has helped support the economy over recent years. The rate of new building approvals has slowed, but there is a large amount of work still in the pipeline, particularly for apartments, so we still expect some further growth in this part of the economy this year. There has, however, been some tightening in conditions for property developers in some markets.

In the broader housing market, the picture remains quite complicated. There is not a single story across the country. In parts of the country that have been adjusting to the downswing in mining investment or where there have been big increases in supply of apartments, housing prices have declined. In other parts, where the economy has been stronger and the supply-side has had trouble keeping up with strong population growth, housing prices are still rising quickly. In most areas, growth in rents is low. And recently we have seen a pick-up in growth in credit to investors, which needs to be watched carefully.

In terms of consumer prices, a year ago we had expected the inflation rate to remain above 2 per cent. It has turned out to be lower than this last year, at around 1½ per cent. Wage growth has been quite subdued, reflecting spare capacity in the labour market and the adjustment to the unwinding of the mining investment boom. We anticipate the subdued outcomes to continue for a while yet. Increased competition in retailing is also having an effect on prices, as is the low rate of increase in rents.

We do not expect the rate of inflation to fall further. Our judgement is that there are reasonable prospects for inflation to rise towards the middle of the target over time. The recent improvement in the global economy provides some extra assurance on this front. Headline inflation is expected to be back above 2 per cent later this year, boosted by higher prices for petrol and tobacco. The pick-up in underlying inflation is expected to be more gradual.

Since we appeared before this Committee last September, the Reserve Bank Board has kept the cash rate unchanged at 1.5 per cent.

At its recent meetings the Board has been paying close attention to the outlook for inflation as well as two other issues: trends in household borrowing and in the labour market.

One of the ways in which monetary policy works is to make it easier for people to borrow and spend. But there is a balance to be struck. Too much borrowing today can create problems for tomorrow, because debt does have to be repaid. At the moment, most households with borrowings do seem to be coping pretty well. But the current high level of debt, combined with low nominal income growth, is affecting the appetite of households to spend, and we are seeing some evidence of this in the consumption figures. The balance that is required is to support spending in the economy today while avoiding creating fragilities in household balance sheets that could cause problems for the economy later on. This is also something we need to watch carefully.

Trends in the labour market are also important. As in the housing market, the picture in the labour market varies significantly around the country. Overall, the unemployment rate has been steady now for a little over a year at around 5¾ per cent. In a historical context this would have been considered a good outcome, although, today, a sustainably lower unemployment rate should be possible in Australia. The other aspect of the labour market that is worth noting is the continuing trend towards part-time employment. Over the past year, all the growth in employment is accounted for by part-time jobs. There is a structural element to this, but it is also partly cyclical. We expect that the unemployment rate will remain around its current level for a while yet.

The Reserve Bank Board continues to balance these various issues within the framework of our flexible medium-term inflation target, which aims to achieve an average rate of inflation over time of 2 point something. Our judgement is that the current setting of the cash rate is consistent with both this and achieving sustainable growth in our economy. We will continue to review that judgement at future meetings.

Canada Vs Australia On Housing

The RBA Governor gave a speech comparing aspects of the Australian and Canadian economies. I found the comparisons relating to housing interesting. In summary, high prices, high debt, and high risk.

We have both had strong housing markets over recent years and there are concerns about the level of household indebtedness. There are some similarities in the factors at work.

One is that our populations have been growing quickly for advanced industrialised countries. In Australia, population growth has averaged 1.7 per cent over the past decade, while in Canada it has averaged 1.1 per cent. Over the past couple of years the growth rates have moved closer together.
Graph 4: Population Growth

Another similarity is that there has been strong demand from overseas residents for investments in residential property, particularly in our wonderful Pacific-rim cities. Not only are these cities attractive places to live, but we also offer investors security of property rights and economic and financial stability. Given the strong demand and its impact on prices in some areas, some state and provincial governments have recently levied additional taxes on foreign investors in residential property.

Our housing markets have also been affected by the global monetary environment. We both run independent monetary policies, but the level of our interest rates is influenced by what happens elsewhere in the world. With interest rates so low and our economies being resilient, it is not so surprising that people have found it an attractive time to borrow to buy housing.

Graph 5: Housing Price Growth

Another characteristic that we have in common is that at a time of strong demand from both residents and non-residents, there are challenges on the supply side. I understand that zoning is an issue in Canada, just as in Australia. In some parts of Australia, there has also been underinvestment in transport infrastructure, which has limited the supply of well-located land at a time when demand for such land has been growing quickly. The result is higher prices.

We are also both experiencing large differences across the various sub-markets within our countries. The strength in housing markets in our major cities contrasts with marked weakness in the mining regions following the end of the mining investment boom.

Graph 6: Housing Price Growth by City

The increase in overall housing prices in both our countries has gone hand in hand with a further pick-up in household indebtedness. In both countries the ratio of household debt to income is at a record high, although the low level of interest rates means that the debt-servicing burdens are not that high at the moment.

Graph 7: Household Debt-to-income Ratio

In Australia, the household sector is coping reasonably well with the high levels of debt. But there are some signs that debt levels are affecting household spending. In aggregate, households are carrying more debt than they have before and, at the same time, they are experiencing slower growth in their nominal incomes than they have for some decades. For many, this is a sobering combination.

Reflecting this, our latest forecasts were prepared on the basis that growth in consumption was unlikely to run ahead of growth in household income over the next couple of years; in other words the household saving rate was likely to remain constant. This is a bit different from recent years, over which the saving rate had trended down slowly.

Graph 8: Household Savings Ratio

This interaction between consumption, saving and borrowing for housing is a significant issue and one that I know both central banks are watching carefully. It is one of the key uncertainties around our central scenario for the Australian economy. It was also cited as one of the key risks for the inflation outlook in the Bank of Canada’s latest Monetary Policy Report. We are still learning how households respond to higher debt levels and lower nominal income growth.


This Is Why Mortgaged Household Are Debt Exposed

When we published our sensitivity analysis on mortgaged households, which shows that more than 20% were on the edge financially speaking even at current low rates, a number of people asked why this was so, given the assumed affordability buffers and other underwriting safeguards.

Well, apart from the obvious issues of static incomes, rising costs of living, and potentially higher interest rates ahead, many mortgaged households also have other debts to repay. So today we run through some of our survey results looking at these other household debts. And it is not pretty.

To start, here is the average balances for mortgaged households, looking at their use of unsecured credit (e.g. personal loans, store cards etc) and credit cards. In the case of credit cards, we show two balances, first the current outstanding balance, and second the average revolving (hard core) debt outstanding.  Households with debts, on average and on top of the mortgage have $12,000 in unsecured loans, $11,000 in card debt, of which $10,000 is revolving.   These can cost as much to service each month as the mortgage repayment!

We can slice and dice the households, using some of our custom SQL views. For example, here are the average balances by household age bands.  Households between 40 and 59 have the larger loan and revolving balances, though interestingly, those 60-70 have the largest card balances.

As incomes rise, debt levels also rise, so some of the debt is owned by households with more ability to repay. However, remember the larger number of households are in the first three bands, where debt is still rife.

We can examine this debt by our master household segments. Once again, more affluent households have larger debts, but young growing families have on average close to $20,000 in debt, including some on revolving cards (where interest is charged at a high rate).

We can examine the data across our regions. Urban centres, including ACT, Greater Sydney and Melbourne have the highest debt levels. Many of these households also hold the largest mortgages.

Finally, it is interesting to note that from a digital behaviour standpoint, those younger households who are online most of the time and prefer to use digital channels (Natives) borrow more than Luddites (those who prefer not to go online, but the larger debts are held by households who have migrated online. These Migrants are progressively using online channels more than ever.  You can read more about our channel use inour report  The Quiet Revolution.

So, to sum up. Many households have large mortgages AND other debts, including credit cards and personal loans. This entire portfolio of debt must be considered when looking at their sensitivity to rising rates, and when comparing static incomes with rising debt repayments. Just looking at the mortgage gives only part of the full picture.

Much of this debt would not exist when the bank made their mortgage underwriting decision. That point in time view however does not necessarily still hold true. Should ongoing affordability testing be required by the regulators?

Consumers won’t react the same to higher interest rates

From The Conversation.

The Reserve Bank today kept interest rates at a record low of 1.5%. Such low rates create economic uncertainty – and if Australia’s historical GDP growth is anything to go by, consumers face more uncertainty than the bottoming out of interest rates would usually suggest.

This is because high house prices lead home-owners to feel wealthy, yet the economy as a whole does not convey a message of wealth to all consumers.

Boom and bust come and go, and sometimes you can be forgiven for feeling economic déjà vu. But how might Australians react to record low rates this time around? Business moves in cycles over time, so economists sometimes look to history as a guide to what might happen next.

A flattening out of interest rates can mean many possibilities for consumers and businesses. Historical GDP growth rates would indicate that the business cycle is at the same stage as in 2011. But what this means for consumers depends on how the other economic “stars” align. The indicators from 2011 are able to provide a model of how consumers may react over the coming years.

Does 2011 provide a model?

The relationship between interest rates and unemployment has been of interest since target interest rates were introduced in 1990.

The rise in unemployment from 4% to 6% between July 2008 and May 2009 occurred at the same time as the Reserve Bank rapidly slashed the target interest rates.

However, with the Reserve Bank now unlikely to reduce interest rates any further, the impact on unemployment and other pointers for consumer behaviour may be different this time compared to 2011.

To predict consumer behaviour in the current uncertain conditions, the most appropriate method would be to consider past situations where GDP has gone up, and reflect on changes to key consumer indicators.

Based on Australia’s current GDP growth rates, and those of the last few decades, we are most likely at the “February 2011” stage of the business cycle – when growth was at 1.9%.

Based on the business cycle method of anticipating future consumer indicators, we would expect the trend to continue. Consumers would save the same or less of their income. And consumer sentiment would remain flat.

However, with property prices at all-time highs in capital cities, it is possible this will counteract rising interest rates when it comes to consumer expectations because there are conflicting messages. On the one hand, consumers feel wealthy because of property prices. However, they are expecting their mortgage repayments to increase when interest rates start to tick up.

In this environment it is expected that unemployment remains steady, as it has since 2009, with the sharemarket remaining flat. It is expected that as the sharemarket remains flat (or modestly increases) across developed countries, the price of gold continues to rise.

We can make these sorts of predictions, if 2011 is a guide to what will happen in the coming years.

ASX

But using 2011 as a benchmark to help predict future trends relies on the basic academic assumption that the points of reference (2011 and 2017) are identical. The world of 2011 was vastly different from the world today – it was almost naively uncomplicated.

Further dampening effects?

The differences between 2011 and 2017 will likely result in further dampening effects on the economic recovery. One of the major potential dampeners is Australia’s relatively high level of government debt.

The reduction in government debt in 2007 occurred almost simultaneously with the global financial crisis, higher consumer saving rates and a steady decline in GDP growth each quarter.

Hence, core economic fundamentals (such as how cutting government spending when the economy is already shaky will likely result in a greater negative GDP impact than when the economy is strong) deem that if the current government takes steps to reduce debt, this could have further dampening effects on the economy. This is despite a bottoming out of interest rates, which indicates the economy is projected to be on the way up.

Today’s world poses many challenges to forecasting how consumers will behave. One of the primary issues is high levels of debt (both for consumption and for property), which means a rise in interest rates will directly impact Australians. However, high property markets give consumers a feeling of wealth, despite the extreme lack of diversification across asset classes, and property that is hard to sell.

These competing forces mean consumers are likely to view formal government announcements with more scrutiny. As statements are made about improving economic prospects, individual consumers are feeling financial strain.

Combine these forces with increasing market complexity, product advances, geopolitical issues and climate change, and a certain level of unease is weighing on Australian minds, which goes over and above the likely increase in mortgage repayments.

A lot has changed since 2011

Technology disruptions are likely to further reduce trust in institutions, particularly banks, but may ultimately give consumers a greater feeling of empowerment and control.

In 2011, technological financial disruption was just a sparkle in Bitcoin’s eye. Now, technological disruption covers every sector imaginable. Many consider the future economy will be the collaborative economy.

The collaborative economy is one in which consumers and businesses share their resources (for a fee). This increases efficiency and saves cost to the end consumer.

For example, AirBnB (the largest accommodation provider in the world, which owns no accommodation) connects people who have extra space with travellers who are seeking an authentic, low-cost experience while travelling.

If the shift toward the collaborative economy continues, large institutions – particularly banks – will find it more difficult to make the significant profits they are used to.

Since 2011, consumers across the world have shifted to more community-based banking systems and have lent directly to others to achieve higher interest rates than bank deposits – particularly in a low-interest-rate environment. This trend is likely to continue.

Coupled with decreasing trust in institutions, it makes it unlikely that the predicted trends will be identical to those in 2011.

Author: Lecturer in Accounting, Finance and Economics, Griffith University

High Household Debt Kills Real Growth

A new working paper from the BIS “The real effects of household debt in the short and long run” shows that high household debt (as measured by debt to GDP) has a significant negative long term effect on consumption, and so growth.

A 1 percentage point increase in the household debt-to-GDP ratio tends to lower growth in the long run by 0.1 percentage point. Our results suggest that the negative long-run effects on consumption tend to intensify as the household debt-to-GDP ratio exceeds 60%. For GDP growth, that intensification seems to occur when the ratio exceeds 80%.

Moreover, the negative correlation between household debt and consumption actually strengthens over time, following a surge in household borrowing. What is striking is that the negative correlation coefficient nearly doubles between the first and the fifth year following the increase in household debt.

Bad news for Australian households where the ratio is well above 80%, at 130%.

This is explained by massive amounts of borrowing for housing (both owner occupied and investment) whilst unsecured personal debt is not growing. Such high household debt, even with low interest rates sucks spending from the economy, and is a brake on growth. The swelling value of home prices, and paper wealth (as well as growing bank balance sheets) do not really provide the right foundation for long term real sustainable growth.

Note: BIS Working Papers are written by members of the Monetary and Economic Department of the Bank for International Settlements, and from time to time by other economists, and are published by the Bank. The papers are on subjects of topical interest and are technical in character. The views expressed in them are those of their authors and not necessarily the views of the BIS.

ABC News 24 Does Affluent Mortgage Stress

Here is a segment in which we discuss our latest research into the probability of default modelling in a rising interest rate environment.  We highlight the rise of the “Affluent Stressed” households.

For those wanting to read more on our research, this is a link is to a list of all the recent analysis we completed.