High Household Debt Kills Real Growth

A new working paper from the BIS “The real effects of household debt in the short and long run” shows that high household debt (as measured by debt to GDP) has a significant negative long term effect on consumption, and so growth.

A 1 percentage point increase in the household debt-to-GDP ratio tends to lower growth in the long run by 0.1 percentage point. Our results suggest that the negative long-run effects on consumption tend to intensify as the household debt-to-GDP ratio exceeds 60%. For GDP growth, that intensification seems to occur when the ratio exceeds 80%.

Moreover, the negative correlation between household debt and consumption actually strengthens over time, following a surge in household borrowing. What is striking is that the negative correlation coefficient nearly doubles between the first and the fifth year following the increase in household debt.

Bad news for Australian households where the ratio is well above 80%, at 130%.

This is explained by massive amounts of borrowing for housing (both owner occupied and investment) whilst unsecured personal debt is not growing. Such high household debt, even with low interest rates sucks spending from the economy, and is a brake on growth. The swelling value of home prices, and paper wealth (as well as growing bank balance sheets) do not really provide the right foundation for long term real sustainable growth.

Note: BIS Working Papers are written by members of the Monetary and Economic Department of the Bank for International Settlements, and from time to time by other economists, and are published by the Bank. The papers are on subjects of topical interest and are technical in character. The views expressed in them are those of their authors and not necessarily the views of the BIS.

ABC News 24 Does Affluent Mortgage Stress

Here is a segment in which we discuss our latest research into the probability of default modelling in a rising interest rate environment.  We highlight the rise of the “Affluent Stressed” households.

For those wanting to read more on our research, this is a link is to a list of all the recent analysis we completed.

Another Perspective On Rate Sensitivity

Yesterday we took a deep dive looking at how sensitive borrowing households are to a prospective rise in their owner occupied mortgage rates. A fundamental, though valid assumption we made was to look at the relative number of households impacted. This distribution led the analysis.

However, we can look at the data through a lens of relative mortgage value, not household count. This changes the perspective somewhat and today we explore this additional dimension.

We use the same movement in rate scenarios, from under 0.5% up, to more than 7% and show the relative portfolio distribution by value of outstanding loans and the tipping point where the household would fall into mortgage stress.

Using this lens, we immediately see that from a value perspective, a significant proportion of value resides in NSW (larger home prices, bigger loans). Within the NSW portfolio, more than 20% of the value would be impacted by a small incremental rise in mortgage rates. We also see some value impacted in VIC and WA, but to a lessor degree. In other words, the more highly leveraged state of households in NSW means a small rise in real mortgage rates will bite hard here. This despite all the focus in the press on WA and QLD!

Another interesting view is created by using our geographic zoning definitions, radiating from the central business district (CBD) in the middle, in concentric rings, out to the suburbs, and into the regions beyond. The areas where sensitivity is highest to small rate rises are the inner and outer suburbs, plus the urban fringe. This is because mortgages are quite large, relative to incomes. In other words, there is a geographic concentration risk which needs to be taken into account.

Our household segmentation models highlights that from a value perspective, young affluent and exclusive professionals have a dis-proportionally large share of value, and a significant proportion of this would be at risk from even a small rise.

Finally, again using our value lens, we can see that the largest segment which would be impacted by a 0.5% or less rate rise are soloists (see our earlier post for definitions) who got their mortgage via mortgage brokers. In comparison, delegators who get their loans direct from the bank, without an intermediary, are least exposed.

So, we conclude it is essential to look at the mortgage portfolio both from a value AND count perspective. But in fact, it is the value related lens which provides the best view of relative risk. This is how risk capital should be allocated.

Larger loans, via brokers are inherently more risky in a rising rate environment.

Household Debt Higher, Yet Again

Given the recent data, no surprise the latest RBA chart pack includes the updated household finances data to December 2016, and shows a further rise in the debt to disposable income ratio. Given that lending growth is around 6.5% over the past year and income growth much lower, this trend is likely to continue.

However, the debt has to be repaid at some point. Also worth noting that the interest paid now reflects the lower effective interest rates following the RBA cash rate cut. However, we expect effective rates to rise in coming months.

A double shock for over-indebted households

From The NewDaily.

The OECD has once again warned that rising borrowing costs could wreak havoc on global property markets this year.

Chief economist of the Organisation for Economic Co-operation and Development, Catherine Mann, told the UK’s The Telegraph that property prices had soared in Canada, New Zealand and Sweden in a way “not consistent with a stable real estate market”.

What she didn’t mention is that the OECD’s own research puts Australia in the middle of that pack based on house-price-to-income ratios – making it at least as likely to be affected by the US Federal Reserve-led rise in global interest rates.

In its last economic outlook, the Paris-based think tank rated Sweden at 22 per cent above its long-term price-to-income ratio, Australia 29.4 per cent above, Canada at 30.5 per cent and New Zealand at 31.9 per cent.

In the UK market, where that ratio is only 21.3 per cent, the London market is already cooling rapidly thanks in part to Brexit uncertainty.

Ms Mann said it would be “interesting” to see “who bears the burden – who bears the adjustment cost”.

The Australian story

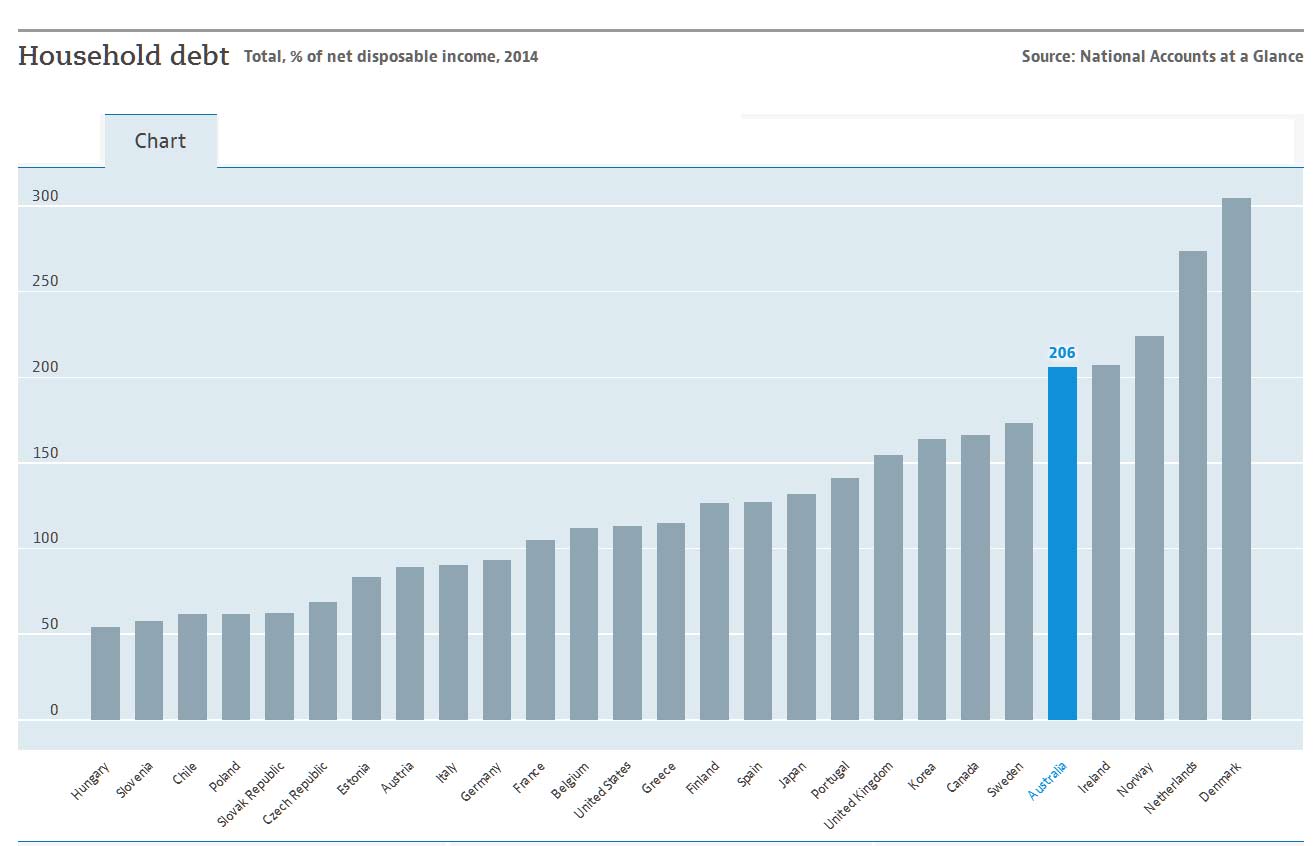
The same question needs to be asked in Australia, in light of our eye-watering levels of household debt.

There are mixed opinions as to whether the Reserve Bank will cut official rates again this year, but even if it does it will be fighting a tide of rising rates in wholesale funding markets.

Those rates affect a third of our banks’ borrowing costs and are likely to force more out-of-cycle mortgage rate hikes.

Who will bear that pain?

To understand what Catherine Mann, the OECD’s chief economist, means by “adjustment costs”, both asset prices and lending rates have to be taken into account.

That’s because banks lend money based on two main criteria: the income the borrower has to service debt at a given interest rate, and the likelihood of the asset increasing or decreasing in value.

Just before the global financial crisis hit, some Australian lenders were offering mortgages at loan-to-valuation ratios of up to 107 per cent.

balancing your budgetRe-mortgaging to cover extravagant spending is coming to an end. Photo: Getty

They were so confident the market would continue rising, that they were happy for the safety buffer of equity to build up in the months or years after the loan was made.

Likewise, serviceability ratios were stretched to the limit at lenders such as Bankwest, because the mining boom was inflating wage packets relatively quickly.

The GFC changed all that. The lenders that were pushing those ratios too far, such as Bankwest, St George and Rams Home Loans, came close to collapse in 2009 and were snapped up at bargain prices by the bigger banks.

While the worst excesses of the GFC have not been repeated, banks and borrowers have once again become too comfortable with the idea that rising property prices and wages will get overstretched borrowers out of trouble.

Ms Mann is essentially warning us not to get too comfortable, as the era of ultra-low interest rates comes to an end.

Debt as ‘income’

To illustrate the point, I’ll go back to the example of the “completely disorganised” borrower described to me by a lending manager last year.

Catherine Mann“[What’s] interesting in terms of the implications … is who bears the burden,” said Catherine Mann. Photo: Getty

Such borrowers, he said, would bumble along with maxed-out credit cards, a personal loan for their last holiday, a leased car, and a fairly opulent lifestyle overall.

In a rising market, they could, and did, remortgage every few years and use equity in their home to pay for their extravagance.

What’s changed? Well firstly, many Australian households are seeing a big slowdown in the capital growth of their homes.

The latest all-cities average dwelling price from CoreLogic, released on Tuesday, shows a national increase of 10.8 per cent over 12 months.

However, that is overwhelmingly concentrated in Sydney (up 15.5 per cent) and Melbourne (13.7 per cent).

For “disorganised” borrowers living in Perth, where values have actually fallen 4.3 per cent, there’ll be no more remortgaging to pay off their other debts – the era of equity withdrawal is over, for some years at least.

bill shockHigher mortgage costs will make the end of debt-funded spending an even bigger shock. Photo: Getty

The situation is similar in Darwin, where prices rose less than inflation in the past 12 months (0.9 per cent), or Brisbane where prices were just a bit ahead of inflation (3.6 per cent).

If out-of-cycle rate increases start to bite into their budgets, households in many areas are facing a double-whammy – no more debt-financed consumption, plus higher monthly outgoings just to keep a roof over their heads.

As economist Steve Keen has argued for years, household consumption is financed by two things: wages, plus the net change in debt.

We are now going into an era when a growing number of households will have only their wages to spend.

With wage growth at record lows and mortgage rate increases on the medium-term horizon, for the over-indebted that’s going to come as quite a shock.
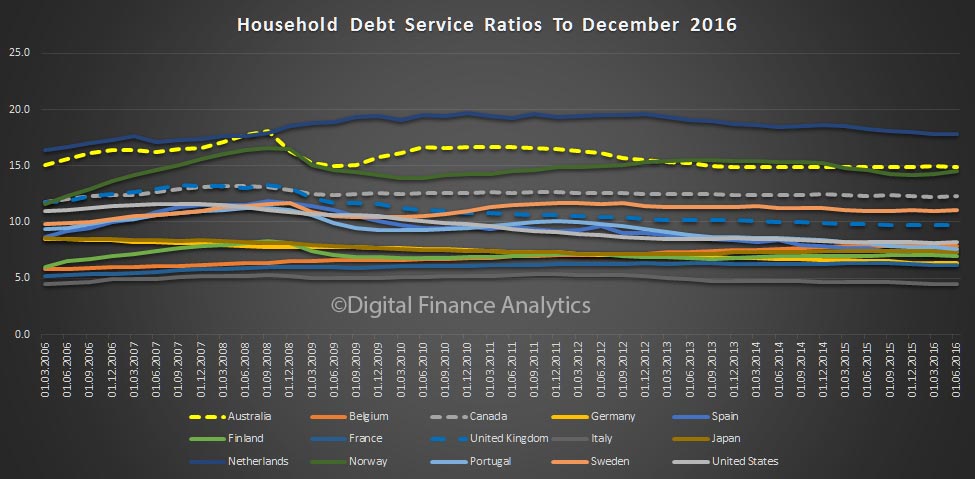
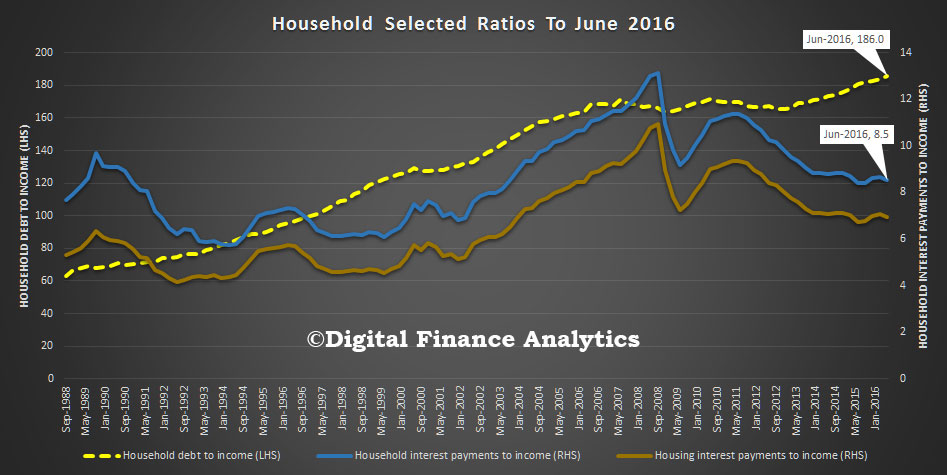
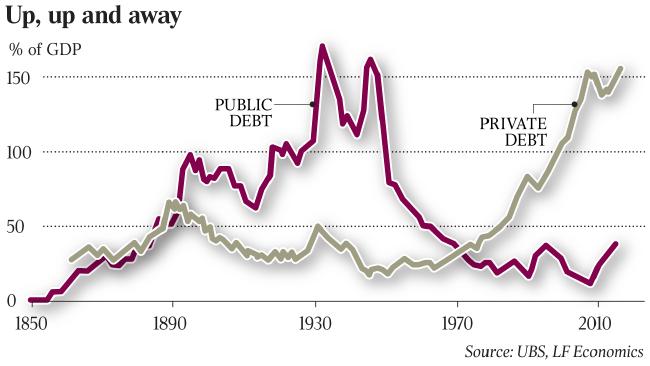
Household Debt Service Ratio Latest Data

The BIS has just released their December 2016 update of comparative Debt Service Ratios for Households. Australia sits below Netherlands and Norway, but well above most other countries, including USA, UK and Canada. We are awash with household debt, but remember our current interest rates are ultra low. The ratio will deteriorate as rates rise, which is what we expect to happen.

By way of background, the debt service ratio (DSR) is defined as the ratio of interest payments plus amortisations to income. As such, the DSR provides a flow-to-flow comparison – the flow of debt service payments divided by the flow of income.

It takes the stock of debt, and the average interest rate on the existing stock of debt. To accurately measure aggregate debt servicing costs, the interest rate has to reflect average interest rate conditions on the stock of debt, which contains a mix of new and old loans with different fixed and floating nominal interest rates attached to them. The average interest rate on the stock of debt is proxied by the average lending rates on loans from  financial institutions.

So whilst there will be some cross-border statistical variations, we can be confident the results are relatively accurate.

Household Debt Further Into The Troposphere

The latest statistical release from the RBA includes data of some key household ratios. Of particular interest is the ratio between income and debt, and income to repayments.

rba-june-household-ratiosThe ratio of household debt to income has risen again now standing at 186, as high as it has ever been. The ratio of income to debt is on average 8.5, and has been tracking lower as interest rates fall.

Or to put it another way, as interest rates fall, households are borrowing more. As we saw yesterday, “other personal credit” fell in August, whilst mortgage debt rose again.

This debt to income ratio puts Australia at the top of league and highlights the potential risks which exist due to excessive leverage should rates rise, employment fall, or from some external shock (e.g. a European bank failing!).

The regulators need to start tightening credit availability, so total household debt begins to align better to income growth. Current credit growth rates, be they lower than last year, are still too high.

Household Debt Up Again

The latest RBA chart pack, released today includes data on household debt. Debt a a percentage of disposable income is up again, to an all time high. This is driven by flat income growth, and ever more home loan borrowing. Even after the May interest rate cut,  interest paid as a proportion of disposable income has risen.

household-finances(1)This is of course an average, and segmented data contains considerable variation.

Getting Government Debt In Perspective

A good piece in today’s The Conversation, examines the claim that the current government has lifted net government debt by $100 billion. This is proved to be correct, with caveats. However, some perspective is required in the debate. As highlighted in the piece, an important measure is debt to GDP. On that basis, on an international comparison, Australia is still well placed.

GDP Comparisons May 2016However, a recent report from LF Economics highlights that “while mainstream commentary and attention is firmly focused on public debt, the nation has accumulated a dangerously high level of private debt, including a moderately high level of external debt. Globally, Australia ranks near the top of indebted households. The exponential surge in mortgage debt issuance over the last two decades has generated the largest housing bubble in Australian economic history”. “Australia’s household debt ratio has grown above peaks established in countries where housing bubbles formed and burst, as in Ireland, Spain and the United States,” say report authors Philip Soos and Lindsay David. “So highly leveraged is the housing market that even small declines in residential land prices will have adverse consequences.”

Indeed, Australian households overtook the Swiss as the world’s most indebted this year, with outstanding debt equivalent to 125 per cent of GDP and no let up in sight. Combined owner-occupier and investor loans outstanding have risen from $1.2 trillion to $1.6 trillion in the past five years.

Here is the problem, the economic growth is being stoked by ever higher household debt, which is unsustainable. Why are we not getting better political discussion on this much more important issue during the election? The current economic path which has been set is unsustainable. The chart below makes the point – private debt should be the focus.

Australian Debt By CategoryAs we highlighted from the recent RBA chart pack, household debt to income is also sky high.

household-financesAnd here is data (from 2014) from the OECD showing the relative ratio of household debt to disposable income for Australia,  in comparison with other countries.

OECD-Debt-To-IncomeThe issue we SHOULD be talking about is the household debt overhang, and how we are going to deal with it. Government debt, in comparison is a side-show!

Our finances are a mess – could behavioral science help clean them up?

From The Conversation.

The first few months of a new year can be a stressful time financially. The Christmas holidays typically lead to depleted savings and higher credit card balances, while tax season is right around the corner.

Unfortunately for most us, this isn’t a seasonal dilemma but a chronic problem that brings anxiety throughout the year.

Indeed, as many as 44 percent of American households don’t have enough savings to cover basic expenses for even three months. Without a savings cushion, even regular seasonal expenses like holiday celebrations may end up feeling “unexpected” and lead households to turn to credit to cover costs.

U.S. consumers currently hold US$880 billion in revolving debt, with an average credit card balance of almost $6,000. The picture is even more dire for lower-income households.

So how can we turn this around? Many tacks have been tried but fallen short for one reason or another. Fortunately, behavioral science offers some useful insights, as our research shows.

What’s wrong with current approaches

Typical approaches to solving problematic finances are either to “educate” people about the need to save more or to “incentivize” savings with monetary rewards.

But when we look at traditional financial education and counseling programs, they have had virtually no long-term impact on behavior. Similarly, matched savings programs are expensive and have shown mixed results on savings rates. Furthermore, these approaches often prioritize the need for savings while treating debt repayment as a secondary concern.

Education and incentives haven’t worked because they are based on problematic assumptions about lower-income consumers that turn out to be false.

The truth is lower-income consumers don’t need to be told what to do. On average, they are actually more aware of their finances and better at making tradeoffs than more affluent consumers.

They also don’t need to be convinced of the value of saving. Many want to save but face additional obstacles to financial health.

For example, these households often face uncertainty about their cash flows, making planning for expenses even more difficult. More generally, they have little room for error in their budgets and the costs of small mistakes can compound rapidly.

Brain barriers

In this volatile context, psychological barriers common to all people exacerbate the problem.

People have difficulty thinking about the future. We treat our future, older selves as if they are strangers, decreasing motivation to make tradeoffs in the present. Additionally, we underpredict future expenses, leading us to spend more than precise budgeting can account for.

When we do focus on the future, people have a hard time figuring out which financial goals to tackle.

In research that we conducted with Rourke O’Brien of the University of Wisconsin, we found that consumers often focus either on saving money or on repaying debt. In reality, both actions simultaneously interact, contributing to overall financial health.

This can be problematic when people misguidedly take on high-interest debt while holding money in low-interest saving accounts at the same time. And, once people have identified building savings or repaying debt as an important goal, they have difficulty identifying how much should be put toward it each month. As a result, they rely on information in the environment to help determine this amount (like getting “anchored” on specific numbers that are presented as suggestions on credit card payment statements).

Unfortunately, the way current banking products are designed often makes these psychological realities worse.

For example, the information on many credit card payment systems nudges consumers toward paying the minimum balance rather than a higher amount. Budgeting tools assume income and expenses stay the same from month to month (not true for most lower-wage workers) and expect us to monitor spending against a long list of separate, complicated budget categories.

On a deeper level, the fact that banks offer credit and savings products separately exacerbates the psychological distance between paying down debt and building savings, even though these are linked behaviors.

Behavioral banking

The good news is that a range of simple, behaviorally informed solutions can easily be deployed to tackle these problems, from policy innovations to product redesign.

For instance, changing the “suggested payoff” in credit card statements for targeted segments (i.e., those who were already paying in full) could help consumers more effectively pay down debt, as could allowing tax refunds to be directly applied toward debt repayment. Well-designed budgeting tools that leverage financial technology could be integrated into government programs. The state of California, for example, is currently exploring ways to implement such technologies across a variety of platforms.

But the public and private sectors both need to play a role for these tools to be effective. Creating an integrated credit-and-saving product, for example, would require buy-in from regulators along with financial providers.

While these banking solutions may not close the economic inequality gap on their own, behaviorally informed design shifts can be the missing piece of the puzzle in these efforts to fix major problems.

Our research indicates that people already want to be doing a better job with their finances; we just need to make it a little less difficult for them. And making small changes to banking products can go a long way in helping people stabilize their finances so they can focus on other aspects of their lives.

Authors: Hal Hershfiel, Assistant Professor of Marketing, University of California, Los Angeles; Abigail Sussma, Assistant Professor of Marketing, University of Chicago.