RBA Warns on Housing – Sort of…

Hidden away at the end of the 62 page Statement on Monetary Policy is a gem of a paragraph relating to housing. I think this is the first warning I can remember on the subject, as up to now the RBA has been remarkable bullish. Will this mean the regulators efforts to control the risks be accelerated?

Housing prices have picked up over the second half of 2016, most notably in Sydney and Melbourne. This could see more spending and renovation activity than is currently envisaged.

On the other hand, a widespread downturn in the housing market could mean that a more significant share of projects currently in the residential construction pipeline is not completed than is currently assumed. While this is a low-probability downside risk, it could be triggered by a range of different factors.

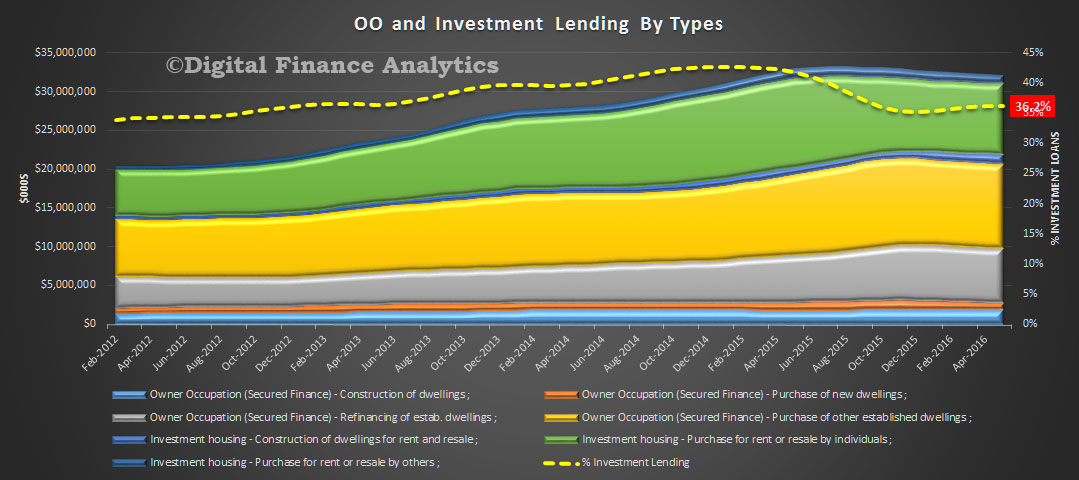
Low rental yields and slow growth in rents could refocus property investors’ attention on the possibility of oversupply in some regions.

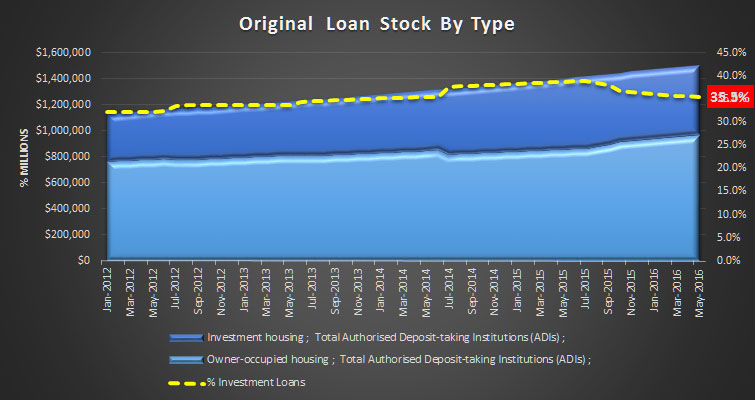
Although investor activity is currently quite strong, at least in Sydney and Melbourne, history shows that sentiment can turn quickly, especially if prices start to fall. Softer underlying demand for housing, for example because of a slowing in population growth or heightened concerns about household indebtedness, could also possibly prompt such a reassessment.

Now, you can read this a couple of ways, first it is a low-probability – they say, so not to worry. Or could it be that this is a way of getting housing expectations reset.

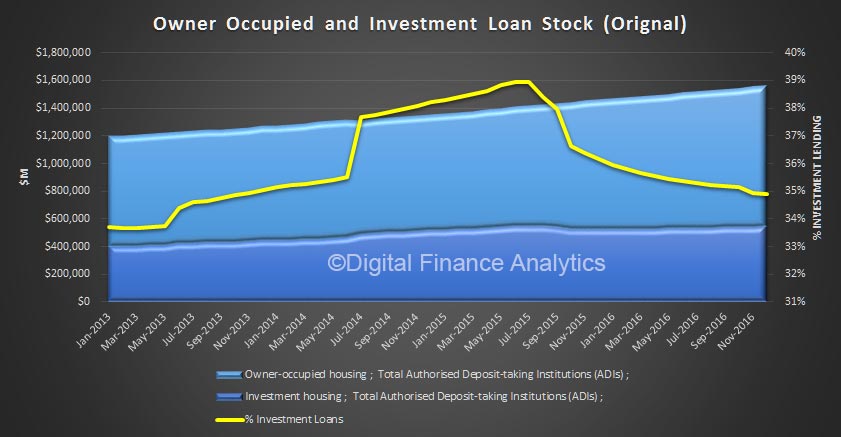
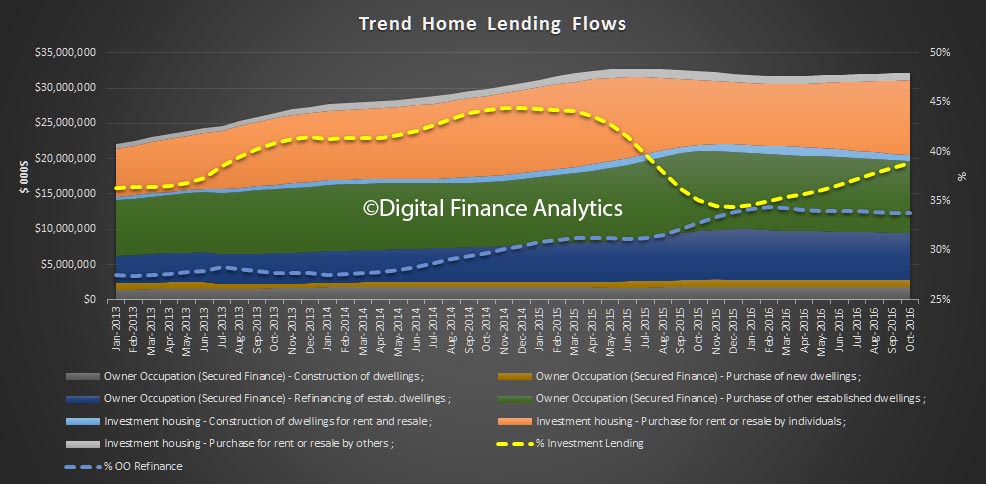
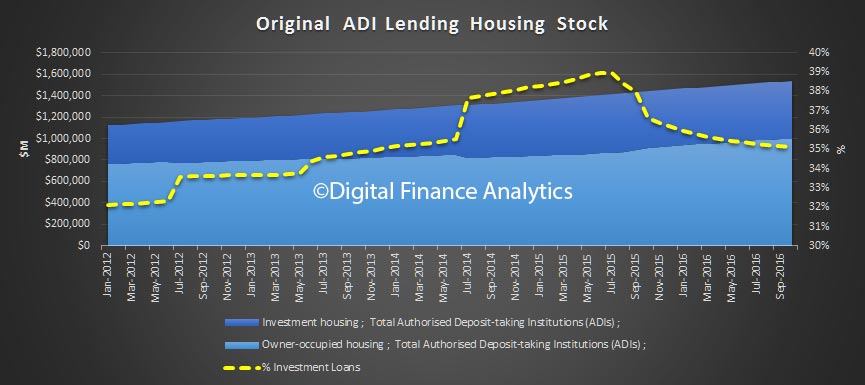
We have been highlighting potential risks in housing thanks to low income growth, sky-high debt and rapid growth in the investment sector at a time when rental yields are under pressure.

At very least it seems the housing expectation sails are being trimmed, and should things go bad later, the RBA can point back to the “I told you so” paragraph.

Lets see if the regulators get their act together now, though it is late in the day!


Home Lending Roared Away In December

The ABS data on home finance for December 2016 confirms what we already knew, lending momentum was strong. But now we see that the number of OO first time buyers were down, whilst investment lending was strongly up.

Overall lending flows were up 0.8% in trend terms to $33.2 billion, with owner occupied loans up 0.23% ($20 billion) and investment loans up 1.68% ($13.2 billion). As a result, investment loans were 39.79% of all loans written in the month! Much of this went to the NSW market, where demand is hot, and prices are up.

Within the owner occupied data, refinancing of existing loans fell, down 1.23% to $6.38 billion, whilst other OO lending grew 0.93% to $13.6 billion. The largest percentage swing was borrowing for new dwellings, up 1.49%.

Given rates are now on the rise, we expect refinance volumes to continue to slide.

Looking at the original first time buyer data, there was 7% fall in the number of first time buyer OO loans written, down to 7,690; whilst investment loans by first time purchasers (not captured by the ABS as a separate category) is estimated to be up 1.4% to 4,236 based on the DFA household survey data. Many purchasers are going straight to the investment sector.  The average loan was $319,000 for FTB and $384,000 for other borrowers.

Finally, the original stock data shows overall loan growth on ADI’s books rose 0.67 (which if repeated for a year would equate to 8%!), way above inflation, so no wonder household debt is still building. The investment loan book grew 0.63% or $3.4 billion, whilst the OO book grew 0.7% or $7.0 billion. The total ADI book was worth 1.56 trillion and investment loans made up 34.91% of the book in December.

Investment Loans Stronger In October

The latest housing finance statistics from the ABS, to October 2016 shows continued growth in investment mortgage lending, whilst owner occupied momentum slowed. In the month and in trend terms, $32 billion on new loans were written, up 0.25%. Within that, owner occupied flow fell 0.5% to $19.7 billion, whilst investment loans grew 1.5%, to $12.5 billion. Investment lending comprised 33.8% of all loans, up from 33.3% the previous month.

33.8% of owner occupied loans were a refinance of existing loans. 12.8% of loans were fixed rate, up from 11.2% last month – reflecting the low rate fixed offers which were available at the time.

Looking at the segmentals, owner occupied lending for construction rose 0.06% to $1.8 billion, purchase of new dwellings fell 0.17% to $1 billion, refinance of established dwellings fell 0.74% to $6.6 billion and purchase of established dwellings fell 0.5% to $10.2 billion.

On the investment side of the ledger, construction of new investment dwellings fell 0.46% to $842 million, purchase of property for investment by individuals rose 2.11% to $10.6 billion and purchase by other investors rose 0.45% to $1 billion.

Looking at ADI loan stock, in original terms, total loans grew by 0.61% in the month, up $9 billion. Investment loans rose 0.5% or $2.7 billion and owner occupied stock rose 0.67% or $6.7 billion.

Turning to first time buyers,the volume of new owner occupied loans to first time buyers remained around 7,300, but because the number of non-first time buyers fell, it rose to 13.7% of all loans, up from 13.1%. The average loan size for first time buyers rose to $327,000, up 1% from last month, whilst the average non-first time buyer loan is $380,000, up 1.6%.

Looking at the DFA survey data we saw a slight fall in the number of first time buyers going directly to the investment sector, but another 4,000 joined the property investor ranks in the month.

Finally, looking at the state-based data in trend terms, the largest falls in owner occupied loans were in NSW (down 1.2%) and ACT (down 2.1%). Tasmania was the only state to see a rise – up 0.7%.


Investment Home Lending Up Again

The latest data from the ABS showing housing lending to September 2016 should make the RBA reconsider its stance on housing. This is because, whilst lending for owner occupation fell slightly, property investors were strongly active again. As a result more than 38% of all new loans in September were for investment purposes. This is too high, and will continue to drive debt and home prices ever higher.

As normal we look at the trend series, which irons out monthly variations. Overall new loans worth $32bn were written, up 0.19% on the previous month. However, of that $12.2bn were for investment housing purposes, up 1.32%, whilst loans for the purchase of owner occupied established dwellings were $10.3bn, down 0.77%. Owner occupied refinance was down 0.46%, to 8bn but comprising 21% of all transactions and 34% of all owner occupied transactions. Loans for new dwellings and construction were $2.8bn, up 0.4%.

housing-sept-2016-all-flowWe also saw the mix between banks and non banks continue to shift, with the non-bank lenders higher.

housing-sept-2016-bank-v-non-bank-trendLooking at first time buyers, we see that the number of first time buyers fell again 0.5%, to 7,334 (original), which is 13.1% of all owner occupied loans. The average first time buyer loan was $324k, up 1.9%. The data also shows the proportion of fixed loan fell to 11.2%.

housing-sept-2016-ftbThe DFA household survey identified an additional 4,000 first time buyers who whet direct to the investment sector – these are not caught in the ABS first time buyer stats.

housing-sept-2016-ftb-trackerAll this explains the high auction clearance rates, and short listing times current observed, especially in the eastern states.

RBA Minutes On Housing

The RBA minutes, released today, have several paragraphs on the housing sector, yet seem to be quite selective in their narrative. So we have laid out our own perspectives alongside the words from the RBA.

Housing-Dice

We think the housing risks are higher for one simple reason. Debt enables households to bring forward purchases, to be paid for from later income. But with income rising so slowly, and debts still growing fast, how will the debts be repaid?

RBA Minutes Says DFA Says
Household consumption growth had moderated in the June quarter. This was driven by a decline in the consumption of goods, consistent with low growth in retail sales volumes, while growth in the consumption of services had remained around average. More timely indicators of household consumption had been mixed: although growth in retail sales had been low over the few months to July, households’ perceptions of their personal finances had remained above average. Members noted that future consumption growth would largely depend on growth in household income. Members observed that the household saving ratio had been little changed in the June quarter but remained on a gradual downward trend, in line with earlier forecasts. Why no mention of the rising household debt ratio? It is now higher than ever it has been. With income growth so low, whilst serviceability of large loans at current interest rates is manageable by many, how will the capital value of the loan be paid off?

The proportion of households who are property inactive continues to rise, as more are excluded on affordability grounds.

Dwelling investment had been increasing more rapidly than housing credit, suggesting that households were increasing their housing equity at a relatively strong rate. Indeed, private dwelling investment had continued to grow at an above-average rate in the June quarter. The large amount of work in the pipeline and the high level of building approvals in July and August were expected to support a high level of dwelling investment for some time, although the rate of growth in dwelling investment was expected to decline over the forecast period. Investment loans were the only growth area in the August ABS data- up 1%. Lenders are very willing to lend to this sector. We think stronger macro-prudential policies are needed. Demand for investment property remains strong, on the expectation of continued future home price growth.


The growth of home prices is not matched to growth in rental incomes, in fact they are slower than they have been for years.  This creates a further risk in the investment sector. We know many households are not covering the costs of their rental property from rent received, relying on tax breaks and offsets, especially in VIC and NSW, whilst hoping for capital growth.

In the established housing market, conditions had eased relative to a year earlier, although there had been some signs that conditions had strengthened a little more recently. Housing price growth in Sydney and Melbourne had increased in recent months and auction clearance rates in these two cities had risen. In contrast, turnover and housing credit growth had been noticeably lower than a year earlier and the value of housing loan approvals had been little changed in recent months. Conditions in the rental market had continued to soften, particularly in Perth, where population growth had been easing and the rental vacancy rate had risen. There is debate as to the rate of real growth in home prices, but they are still rising, especially in VIC and NSW. High auction clearance rates show demand remains strong. Home prices could well continue to rise, enabling more lending. We need DSR and LTI macro-prudential measures. LVR measures do not help much in a rising market.
Conditions in the housing market had been mixed over prior months. The effects of tighter lending standards had been apparent in indicators such as the shares of interest-only loans and loans with high loan-to-valuation ratios in new lending, both of which had declined over the past year. Turnover had declined and housing credit growth had been steady at a noticeably lower rate than a year earlier. Although the rate of increase in housing prices had been lower than a year earlier, growth in housing prices and auction clearance rates had strengthened in Sydney and Melbourne in the months leading up to the meeting. Members noted that considerable supply of apartments was scheduled to come on stream over the next couple of years, particularly in the eastern capital cities. Overall, members assessed that while the risks associated with rapid growth in housing prices and lending had receded over the past year, developments would need to be monitored closely. Interest only loans are actually rising again according the APRA’s latest data, as investment loan growth continues. Several lenders are offering attractive discounts now. Household have high levels of debt. The risks are quite high now, and would become severe if interest rates were to rise


Mortgage Lending Flows Slowed In August

The latest home finance data from the ABS to August 2016 shows that overall housing lending fell slightly, down 0.22% to $31.7bn, in trend terms. But you need segmented analysis to understand what is going on.

Lending for investment purposes rose by 1% to 11.9bn, 37.5% of all lending, up from 37.1% last month, whilst in owner occupied property land, total volumes fell from 55,301 to 54,600 (down 1.27%) and the total value of new loans was $19.8 billion, down from $20 billion (down 0.93%) the previous month.

abs-housing-aug-2016Looking at all trend home lending flows, investment lending borrowing for an existing property rose by individuals 2.3% to $9.8bn, and there were small rises in loans for OO construction and new dwellings.

abs-housing-aug-2016-mom

Owner occupied refinance still remains high, at 39% of existing OO loans, though the volumes are down a little this month to $6.6bn. This is more than 20% of all loan transactions (OO and INV), and up from 17% in 2013.

abs-housing-aug-2016-ooand-refLooking at the OO month on month movements, construction ($1.8bn) and purchase of new dwellings ($1bn) were both up, by 0.56%, showing that demand for, and lending for new property is still being met. However, the value of purchase of established dwellings fell 1.18% to $16.9 bn. Refinanced loans also fell, by 1.31% to $6.6 bn.

abs-housing-aug-2016-oo-deltaFirst time buyers are impacted by ABS revisions, but overall we see a lift in the number of FTB OO buyers, up 3.5% to 7,372. They also made a larger share of all buyers, at 13.4%, but still way below their peak in 2009.

We track FTB investors, who are not caught in the ABS statistics, and last month another estimated 4,061 when straight to the investment property sector, a rise of 3.4%. So overall the FTB sector in total was 11,434, up 3.5% on the previous month. You can read more about the FTB changes to the ABS data here.

The overall trend trajectory however is lower, despite record low interest rates.

ftb-aug-2016-allLoans for investment purchases, refinance, and loans for new property are still supporting the market, whilst momentum in the large existing market sector, refinance apart, is slowing.


Investment Loans Still Growing

The latest lending finance data from the ABS, released today, shows the total value of dwelling finance commitments excluding alterations and additions rose 0.3%. Investment housing commitments rose 1.1%, while owner occupied housing commitments fell 0.1%. The less reliable seasonally adjusted measure showed the total falling by 1.8%. Many commentators will I am sure focus on this, and claim there is a “dramatic correction”.

The original loan stock series shows an annual growth rate of housing lending still running close to 7%; with a slight slow down in recent months – not the significant slow down some have suggested.

home-lenidng-trend-growth-july-2016-absTotal loans on book, in original terms, is $1.52 trillion, up 0.46%, of which 35.28% are for investment loan purposes, down from 35.36% last month. Investment lending stock rose $1.3 billion (up 0.24%) and OO lending stock rose 0.93%, up $9 billion. Remember, more than $1bn loans were reclassified in the month, so there is noise in the data.

home-lenidng-trend-stock-july-2016-absLooking at the monthly trend flows,  momentum continues to ease, but more slowly.

home-lenidng-trend-oo-growth-july-2016-absLast month, construction loans fell 0.34% in number terms, down 19,000; and fell by $0.7m in value terms. There was a rise in the number of new dwellings purchased, up 0.45% or 12,000; and in value terms up 0.66% or $6.5m. The purchase of established dwellings fell by $26m, or 0.15%. The number of refinanced transactions continued to rise, up 42,000, or 0.2%, and up 0.06% or $4.3m. The proportion of refinanced transactions fell by 0.18% compared with last month, or $24m. Refinancing remains a critical driver of ongoing growth.

home-lenidng-trend-oo-flow-july-2016-absIn trend terms, the value of investment loans rose by $127m or 1.1%, and made up 36.6% of new transactions, up compared with 36.3% last month.

home-lenidng-trend-flow-july-2016-absFinally, in original terms, the number of first home buyer commitments as a percentage of total owner occupied housing finance commitments fell to 14.1% in July 2016 from 14.3% in June 2016. The number fell from 8,486 to 7,586, down more than 10%.  The average loan size was $335,600, 0.2% higher than last month.  Signs of tightening in lending conditions?

home-lenidng-ftb-july-2016-absA proportion of first time buyers continue to go direct to the investment sector, as shown in the chart below which overlays our survey data on the ABS data-set.

home-lenidng-all-ftb-july-2016-abs


Latest Home Finance Data Is All About Investment Loans

The latest finance data, for June was released by the ABS today. The trend estimate for the total value of dwelling finance commitments excluding alterations and additions rose 0.4%. Investment housing commitments rose 0.8%, and owner occupied housing commitments rose 0.2%.  Ignore the 3.2% seasonally adjusted investment loan number, it is too unreliable.

The proportion of loans for investment purposes rose in the month, and was 35.85% of all home loans.

Jun16HouFin1Looking at the composition of the changes, month on month, in percentage terms (left hand scale, bars), investment loans for individuals rose 1.27% (up $115m), whilst OO lending for new dwellings fell.

Jun16HouFin2 In trend terms, the number of commitments for owner occupied housing finance rose 0.2% in June 2016 whilst the number of commitments for the purchase of new dwellings rose 0.6%, the number of commitments for the purchase of established dwellings excluding refinancing rose 0.2%, while the number of commitments for the construction of dwellings fell 0.1%.

In original terms, the number of first home buyer commitments as a percentage of total owner occupied housing finance commitments rose to 14.3% in June 2016 from 14.2% in May 2016. However the number of purchasers fell 2.2%.

Jun16HouFin3The DFA investment tracker, which measures first time buyers going direct to the investment sector rose 1.1%, with more than 4,000 purchasers in the month.

Jun16HouFin4 It is worth remembering the RBA identified $1bn of loans switched between investment and owner occupied in the month, so this may have distorted the figures. In addition the ABS warns:

Monthly First Home Buyer statistics will be subject to revision as the modelled component is adjusted to reflect improved reporting by lenders. The ABS is currently investigating the effect of improved reporting on the model and, subject to all institutions providing improved data, expects to revise First Home Buyer statistics in coming months. The revisions will be preceded by an Information Paper explaining the changes. Information relating to changes to the method of estimating loans to first home buyers, introduced from the December 2014 issue. First home buyers are defined as persons entering the home ownership market as owner-occupiers for the first time. First time investors are excluded.

Have We Passed Peak Mortgage?

The housing finance data from the ABS today shows that there has been a slight slowing in absolute mortgage lending flows in May.  But the overall stock of housing loans held by ADIs rose 0.62%, or $9.3 billion (after taking account of new additions, repayments and refinance, as well as adjustments). Total loans on book were worth $1.5 trillion, another record. Within that, owner occupied loans rose 0.76% or $7.3 billion, and investment loans rose 0.37% or $2.0 billion.

We will concentrate on the more reliable trend data series. Overall new owner occupied lending flows fell, in trend terms by 0.56%, or $115 million. Withing that overall fall though, refinanced loans were static, at 34.3% of lending, as households took up the low rate offers available. Lending for construction was down 0.54%, or $9.9 million, whilst purchases of new property were down 3.5% or $34 million and purchase of establish property was down 0.4%, or $71.6 million. Remember we are looking at flows of new loans here, so in trend terms, the value of mortgages is still growing, just more slowly.

May-2016--OOFlowsLooking across the various states, the weighted average was a drop of just 0.2%. ACT rose 1.2% and SA rose 0.8%, whilst all other states, other than NT fell around 0.2%. NT fell 1.4% on small volumes.

May-2016--State-ChangesLooking at the original data for first time buyers, the number of loans jumped by 4.5% to 8,488, but comprised 13.9% of all transactions, down from 14.14% last month. The average loan size fell again by 1.3%, showing that tighter lending standards are biting, the average new loan for first time buyers is now $326,000, whilst the average loan to other borrowers also fell, to $362,000, down 1.2%. Using data from our surveys, we are able to identify those first time buyers going direct to the investment property sector. Investor loans grew 1.2% making 4,041 loans in the month, so total REAL first time buyers of all types rise by 3.4% to 12,529 during May.

May-2016-FTBLooking at the mix of lending for investment and owner occupation, the flow of investment loans fell by 0.1% in trend terms (down $6m) whilst owner occupied loans flows fell 0.6% or $115 million. $11.6 billion of investment loans and $20.5 billion of owner occupation loans were written. In total more than $32.1 billion of new loans were written, compared with $32.2 billion last month, an overall fall of 0.4%.

May-2016-oo-and-INV-FlowsAs a result, the mix of new loans for investment purposes rose to 36.2%. We continue to see a rise in investment lending, with a 1.9% lift in loans for new investment property construction, compared with a fall of 0.5% for construction for owner occupation.

May-2016--OO-and-IV-Detail Finally, we look at loan stock, remembering some reclassifications continue. The overall stock of housing loans held by ADIs rose 0.62%, or $9.3 billion (after taking account of new additions, repayments and refinance, as well as adjustments). Total loans on book were worth $1.5 trillion, another record. Within that, owner occupied loans rose 0.76% or $7.3 billion, and investment loans rose 0.37% or $2.0 billion.

May-2016-StockSo, we conclude that momentum is likely to drive home loan demand higher, even if the rate of growth is somewhat curtailed by tighter lending standards. Demand is still being seen from investors and first time buyers are still active. Refinance to new low rates is still in play. So, no we have not yet reached “peak mortgage”.