All types of personal insolvency increased:
- bankruptcies increased by 2.5%
- debt agreements increased by 20.8%
- personal insolvency agreements increased by 139.5%.
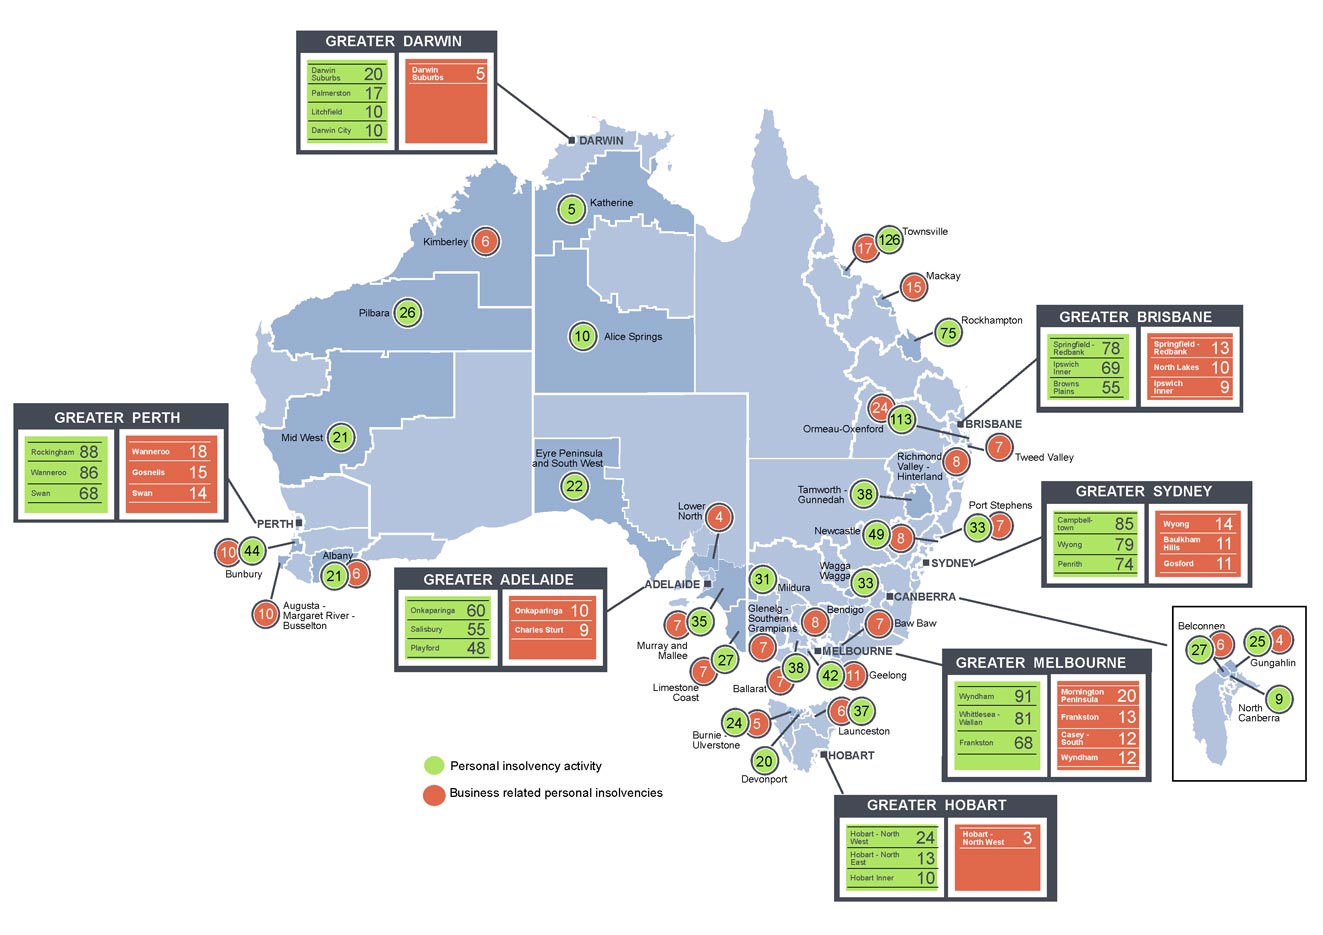
- All states and territories experienced increases in total personal insolvencies. The largest absolute increase was in Western Australia (197 personal insolvencies) and the largest proportional increase was in Australian Capital Territory (32.6%).
- Total personal insolvencies are the highest on record in Western Australia, with 928 personal insolvencies in the March quarter 2017.
- Debt agreements in the March quarter 2017 are the highest on record at 3,584 for the quarter. This follows the largest quarterly increase ever (548 compared to the December quarter 2016). Debt agreements reached record highs in Victoria, Queensland, South Australia and Western Australia.
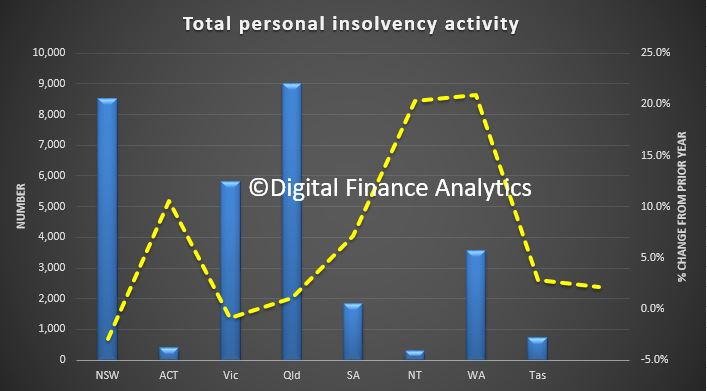
Total personal insolvency activity
The number of personal insolvencies in the March quarter 2017 (7,900) increased by 10.8% compared to the March quarter 2016 (7,129). The March quarter 2017 is the eighth consecutive quarter in which total personal insolvencies have risen year-on-year.
Total personal insolvency activity in Australia: % change compared to same quarter in previous year
MQ17 Total personal insolvency activity in Australia % change compared to same quarter in previous year

All states and territories recorded year-on-year increases in total personal insolvencies in the March quarter 2017. The largest absolute increases were in Western Australia (197 personal insolvencies), Queensland (170 personal insolvencies), New South Wales (127 personal insolvencies) and Victoria (124 personal insolvencies). The largest proportional increases were in Australian Capital Territory (32.6%), Northern Territory (29.8%) and Western Australia (26.9%).
The quarterly increase of 845 personal insolvencies in the March quarter 2017 (compared to the December quarter 2016) is the first since the June quarter 2016. The quarterly total remains below the peaks reached in 2008–09 and 2009–10 (above 9,000 personal insolvencies).
The number of bankruptcies increased by 2.5% in the March quarter 2017 (4,225) compared to the March quarter 2016 (4,123), and also increased by 6.3% compared to the December quarter 2016 (3,976). The quarterly increase in bankruptcies in the March quarter 2017 is the first since the June quarter 2016.
The increase in bankruptcies in the March quarter 2017 compared to the March quarter 2016 was the result of increases in the states and territories of:
- Australian Capital Territory (41.5%)
- Northern Territory (30.0%)
- Western Australia (14.9%)
- Tasmania (8.0%)
- South Australia (6.6%)
- Queensland (1.3%).
These were offset by decreases in:
- New South Wales (-1.9%)
- Victoria (-0.5%).
Bankruptcies in Australia: % change compared to same quarter in previous year
MQ17 Bankruptcies in Australia % change compared to same quarter in previous year

The number of debt agreements increased by 20.8% in the March quarter 2017 (3,584) compared to the March quarter 2016 (2,968), and also increased by 18.1% compared to the December quarter 2016 (3,036).
The rise in debt agreements in the March quarter 2017 compared to the March quarter 2016 was the result of increases in all states and territories:
- South Australia (41.7%)
- Western Australia (39.1%)
- Tasmania (35.7%)
- Northern Territory (25.0%)
- Victoria (19.5%)
- Australian Capital Territory (18.8%)
- New South Wales (15.9%)
- Queensland (15.6%).
The increase in debt agreements in the March quarter 2017 is the seventh consecutive year-on-year rise.
Debt agreements in Australia: % change compared to same quarter in previous year
MQ17 Debt agreements in Australia % change compared to same quarter in previous year

Quarterly personal insolvency agreement levels fluctuate proportionally more than those of bankruptcies and debt agreements as levels are relatively small.
The number of personal insolvency agreements increased by 139.5% in the March quarter 2017 (91) compared to the March quarter 2016 (38), and also increased by 111.6% compared to the December quarter 2016 (43).
The rise in personal insolvency agreements in the March quarter 2017 compared to the March quarter 2016 was the result of increases in all states and territories:
- Western Australia (240.0%)
- Northern Territory (200.0%)
- Victoria (162.5%)
- New South Wales (100.0%)
- Queensland (100.0%)
- Tasmania (100.0%)
- South Australia (50.0%)
- Australian Capital Territory (increase to 3 personal insolvency agreements from 0).
The rise in personal insolvency agreements is the third consecutive year-on-year rise.
Personal insolvency agreements in Australia: % change compared to same quarter in previous year
MQ17 Personal insolvency agreements in Australia % change compared to same quarter in previous year


 The number of personal insolvencies increased 2.1% in 2016–17 compared to 2015–16. bankruptcies decreased by 5.1%, debt agreements increased 11.9% and personal insolvency agreements increased 39.4%.
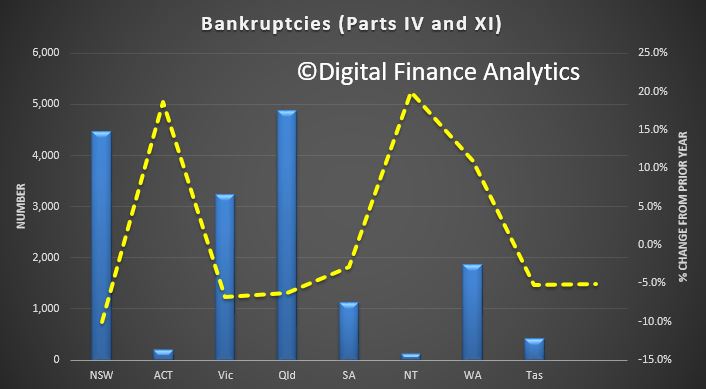 Debt Agreements
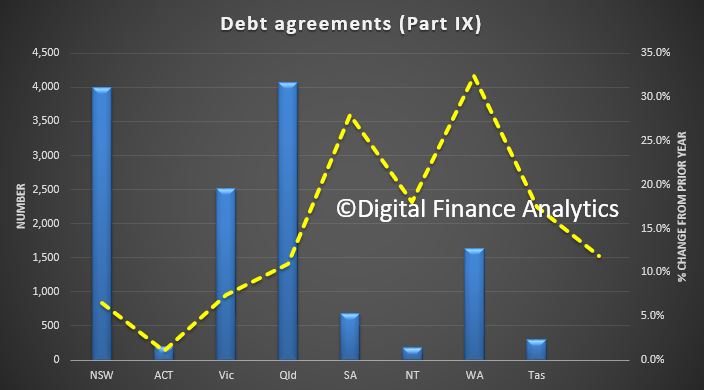 Personal Insolvency Agreements
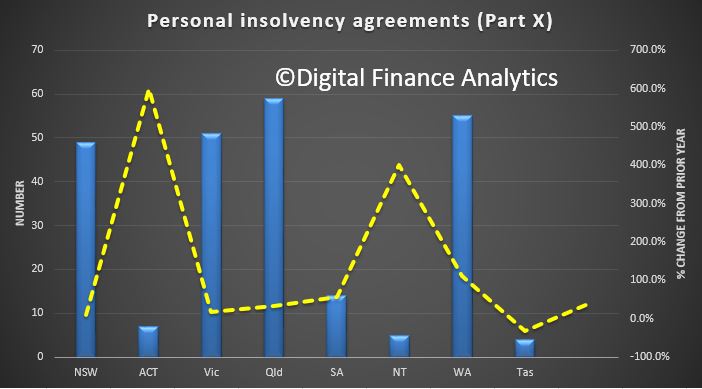 All the above figures refer to personal administrations under the Bankruptcy Act only (and not corporate insolvency).