Donald Trump wants to build another wall. Not a physical wall to keep out illegal immigrants, like his proposed Mexican border project, but a virtual wall around the internet. And just as with Mexico, he wants the people behind the wall to pay for it.
President Trump seems to want to dismantle the main internet policy of his predecessor, that of ensuring net neutrality, also known as the “open internet”. To do this, he has appointed the most vocal Republican critic of President Obama’s internet policies, Ajit Pai, as chair of the Federal Communications Commission (FCC), the largest and most powerful internet regulatory body in the world.
Net neutrality is the principle that telecoms providers that connect you to the internet should not throttle your access depending on what services and content you use. For example, your mobile phone company should not be able to reduce your use of Skype or WhatsApp by reducing the speed of those services so that you use their calling and messaging functions instead. Without net neutrality, certain services and websites would be able to pay internet providers so that customers can access them with faster speeds, disadvantaging those companies without such a deal.
Telecoms providers’ attempts to do this led to a growing international consensus among governments on net neutrality. From 2009, many European and Latin American countries introduced regulations and laws to promote or guarantee net neutrality. In the US, opposition from big telecoms and cable corporations in the courts meant it took six years of Obama’s presidency to begin to effectively implement net neutrality rules.
To get around net neutrality rules, some telecoms companies have more recently begun using a “zero rating” approach of offering customers a preferential bundle of certain services that do not use up data allowances. These “sponsored data” plans don’t prevent access to any other site or service. But they still disadvantage smaller content providers, including the likes of the BBC and Wikipedia, that cannot afford to negotiate inclusion in sponsored data plans as the likes of Facebook and Google can.
Ending net neutrality could make some sites faster than others. Shutterstock
By the end of 2016, regulators in the EUand India had produced further guidelines banning zero-rating plans. And the FCC under Obama was challenging companies using the zero-rating strategy. All those other national regulators are in the midst of their investigations – which is why they are susceptible to the FCC’s do-nothing.
But, in the US at least, that is now history as we enter the Trump era. The new FCC chairman has argued the net neutrality rules over-regulate innovation, even quoting the Emperor from Star Wars to invoke his opposition. He prefers deregulation to allow companies to compete without explicit consumer protection rules to guarantee an open internet.
Since his appointment, Pai has closed the inquiry that was implementing Obama’s policy, and he is highly unlikely to agree to another one. Pai will most probably continue to act towards net neutrality by exercising masterly inactivity, failing to enforce the regulations.
Behind the wall
That will allow the big US telecoms and cable companies to erect paywalls around their content, giving customers free access to affiliated services but making them pay for rival content, especially high definition video. That means lower costs for video services affiliated to AT&T, Verizon and Comcast but higher costs for independent providers such as Netflix.
Who else is affected by an end to US net neutrality? In short, those innovators unable to strike a deal to get inside the telecoms and cable companies’ paywalls. Facebook’s deals with mobile operators have enabled it to offer zero-rated content in many countries. They may now hope the US approval for zero rating will help their arguments in India, Brazil and other huge developing markets. Google and and even NetFlix may be big enough to look after their interests, too.
But small innovators will have no guaranteed minimum service level to design new services. That could impact the development of the Internet of Things, 5G mobile networks and cloud computing services. Having to ask permission to run your service on the internet is a major issue for start-ups that are effectively three engineers in a garage (as Google and Facebook once were). And this may affect new companies’ decisions on where to start their innovations.
Tag: Internet Use
Drinking At The Internet Data Well Rises Again
The latest internet activity data from the ABS, to December 2015, shows that both internet speeds and data usage continue to rise. There were approximately 12.9 million internet subscribers in Australia at the end of December 2015. This is an increase of 2% from the end of December 2014. As at 31 December 2015, almost all (99.3%) internet connections were broadband. Fibre continues to be the fastest growing type of internet connection in both percentage terms and subscriber numbers. The number of fibre connections doubled between December 2014 and December 2015 to 645,000 subscribers.
Around half of all internet connections are via a mobile device. DSL has more than 40%, and fibre to the premises is now beginning to register strongly (thanks to NBN roll out).
 The year on year changes show that fibre 6 month by 6 month growth is above 50%, making an annual rise of more than 100%. Most other channels were relatively static.
 A large number of users now have advertised download speeds of more than 8Mbps – 80% of users in Dec 2015. Close to 20% are between 1.5Mbps and 8Mbps. The ABS does not break out the figures by geographic regions. We think they should. Also, of course, advertised speed and actual speeds delivered are two different things. Data from our digital channels survey indicates that more than half of households experience data rates well below advertised speeds. Those in regional and rural areas had the worst experiences, but we also see a rise in below par speeds in urban areas as service demand rises faster than capacity investment. Slow real speeds have been discussed recently on QandA. Buffering… Buffering….!
For perspective, read this earlier post. We continue to slip down the global rankings. In the report published by Akamai Technologies, Australia fell to 48th place in a global average broadband connection speeds. The report says the average broadband speed for Australia in the fourth quarter of 2015 was 8.2Mbps, down from 46th place when compared to the rest of the world. In terms of average peak internet speeds, at 39.3Mbps, Australia fared badly, dropping to 60th position (down from 46th) in the quarter. This despite Australia’s average and peak internet speeds having increased by 11 per cent and 6.4 per cent year-on-year, respectively.
 National data consumption has continue to climb, especially via fixed line broadband. To December 2015, this rose to more than 1,600,000 TBs. The average wireless mobile user consumed around 7gb whilst the average fixed line user consumed close to 250gb. Streaming media services account for a significant proportion of the rise from around 200gb in June 2015.
The State of the Internet – Australia Slips Further Behind
Akamai’s [state of the internet] Q1 2015 report records that globally the number of Internet users has more than doubled to an estimated 3.2 billion in 2015 and the number of Internet-connected devices will outnumber the human connected population three times by 2019. In parallel with Internet usage, Internet connection speeds have improved as well. In the US, the FCC updated the broadband definition from a benchmark of 4 Mbps to 25 Mbps for downloads. Looking at connection speeds, the global average connection speed increased 10% quarter over quarter, to 5.0 Mbps, while the global average peak connection speed grew 8.2% to 29.1 Mbps.
Turning to mobile connectivity, In the first quarter, average mobile connection speeds (aggregated at a country/region level) ranged from a high of 20.4 Mbps in the United Kingdom — a 27% increase over the fourth quarter — to a low of 1.3 Mbps in Vietnam. Average peak mobile connection speeds ranged from 149.3 Mbps in Australia to 8.2 Mbps in Indonesia. Apple Mobile Safari accounted for roughly 35% of requests, down slightly from 36% in the fourth quarter, while Android Webkit and Chrome for mobile (the two primary Android browser bases) accounted for 23% and 16% of requests, respectively — giving a total of 39% for the Android platform.
Delving into the Australian landscape, it is clear we are still hampered by the recent political ructions regarding the NBN, and consequential uncertainty which has slowed commercial investment. The report suggests that more countries are migrating to a fiber to the premises model, whilst we are backpedaling to a multi-technology solution. We are being overtaken. Demand will continue to rise as VOD services such as Netflix become mainstream.
Looking at fixed line broadband connectivity, the report says at 71% of all broadband connections were above the benchmark 4bps, and this reflected a 4.1 % increase on last quarter, and a 29% lift from last year. We are now sitting at 50th globally in terms of broadband connectivity (defined as above 4Mbps). This is a drop of six places in the last quarter. We are marching more slowly than others. Turning to high speed broadband, Australia came in 44th on the global ranking, slipping three notches from last quarter at 17%. That said, there was a lift in connections above 10 Mbps by 8.8% quarter-on-quarter, and 60% year-on-year.
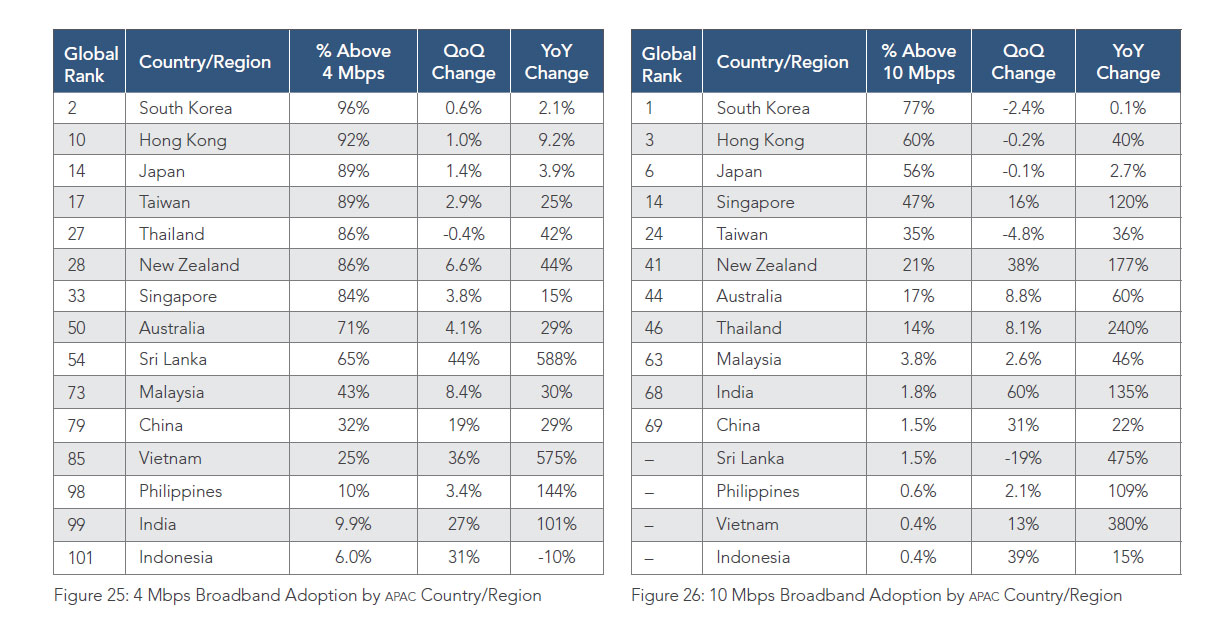 The truth is that the future of broadband is more linked to mobile than ever. The report highlighted that Australia achieved the highest average peak mobile connection speeds globally in Q1 2015 at 149.3 Mbps. In addition, whilst Denmark led the field with 98% mobile internet penetration, Australia recorded the highest mobile broadband take-up rates in the Asia Pacific region at 96%. Maybe we do not need the NBN at all?
Online Business Activity Rises – Revenue Was $216 Bn Last Year
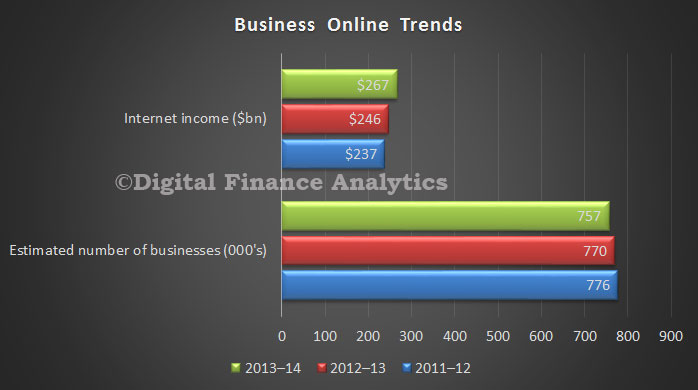
The recent ABS data relating on online business shows that whilst the total number of active businesses fell, online revenue grew by about 8%, compared with 4% the previous year. The number of firms fell from 770,000 to 757,000 (reflecting tough trading conditions, see our SME surveys). However overall internet generated income rose from $246 billion to $267 billion, which is about 15% of GDP.
Collection of data included in this release was undertaken based on a random sample of approximately 6,640 businesses via online forms or mail-out questionnaire. The sample was stratified by industry and an employment-based size indicator. All businesses identified as having 300 or more employees were included in the sample. The 2013-14 survey was dispatched in late October 2014.
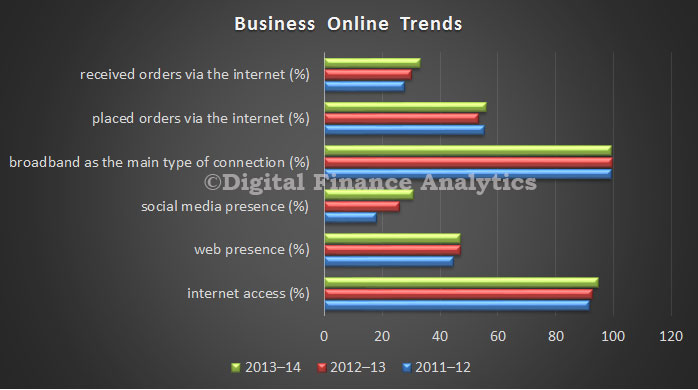
 The survey shows a significant rise in a social media presence up 18%, but this compares with a massive 44% increase in the prior year. We also see a rise in orders placed via the internet (up 4%), and fulfilled via the internet (up 10%). Almost all firms have broadband access.
 Finally, average annual income for a small firm was more than $4,000, compared with a medium firm of $17,000. Larger firms generated more income, and the four largest employers generated on average $3.6 million.
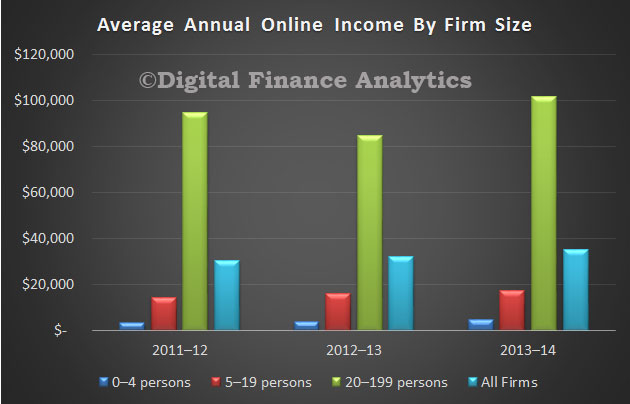 Commerce through the internet is both mainstream, and likely to grow further, supported by the deeper penetration of smart phones and tablets, which enhance customer convenience, and innovation in terms of products and services. See our recent post. Many firms now see online as just another channel to market, but there are industry variations.
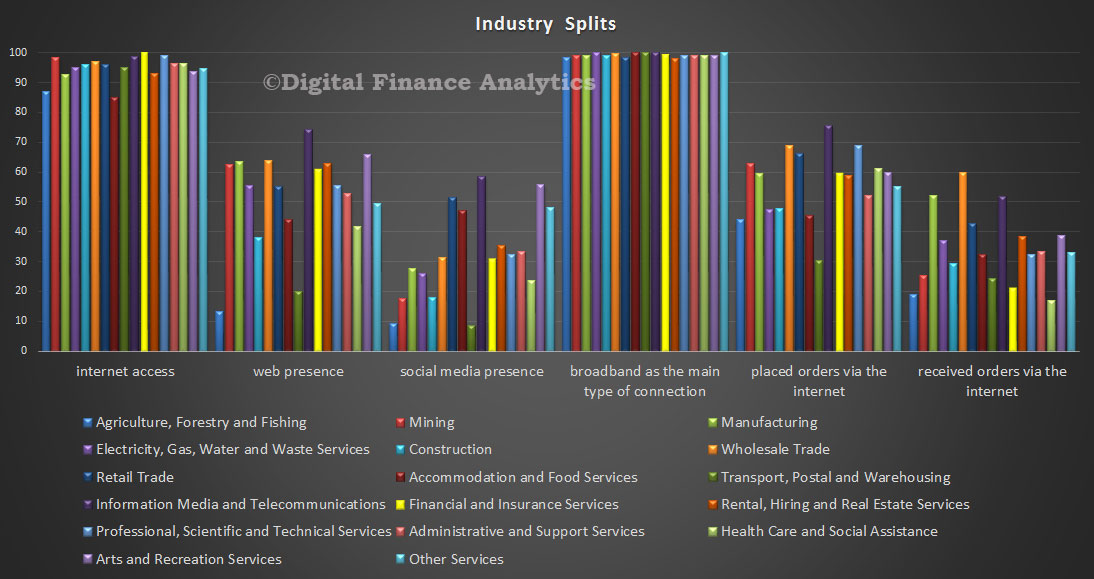 We see, for example that Information, Media and Telecommunications are some of the most active, whilst in finance and insurance, only 60% have a web presence, and 30% have a social media presence.
Australians Trading Fixed For Mobile Broadband
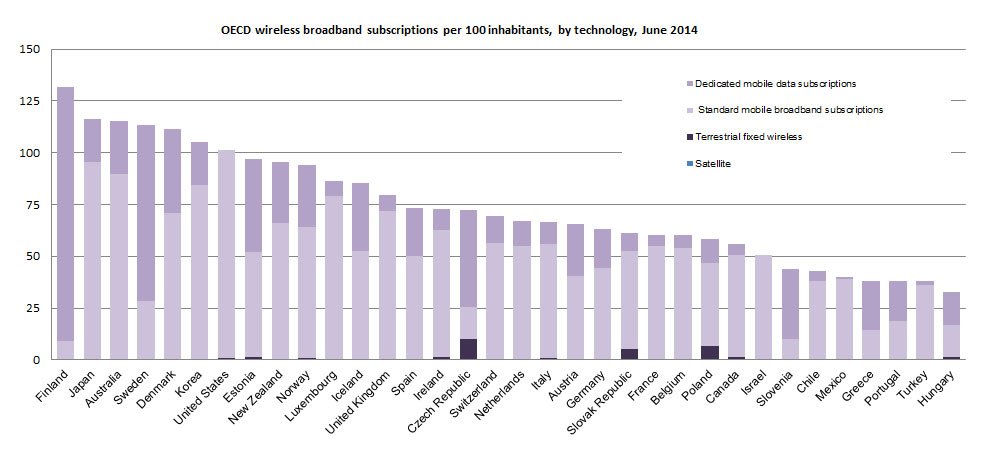
According to the latest OECD data, published today, whilst we are lagging behind other developed OECD countries in fixed broadband, we rank third in the world for wireless broadband behind Finland and Japan. Some Australians have more than one wireless service and mobile growth is significantly higher than fibre.
Using June 2014 data, Australia ranked 20 out of 34 OECD countries based on the number of fixed broadband connections for 100 inhabitants, behind nations including Switzerland, UK Korea, New Zealand and Japan. Total penetration was around 27 per cent. About 81 per cent of connections were via DSL, 15 per cent and 3 per cent fibre. Our fibre rates are lower than the 17% OECD average. 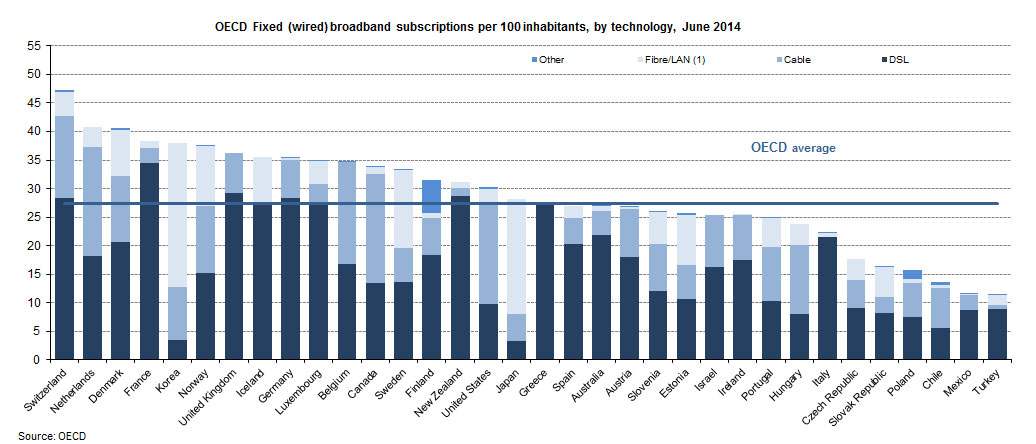 Mobile broadband penetration has risen to 78.2% in the OECD area, making more than three wireless subscriptions for every four inhabitants, according to data for June 2014 released today.
Mobile broadband subscriptions in the 34-country area were up 11.9% from a year earlier to a total of 983 million, driven by growing use of smartphones and tablets.
Seven countries (Finland, Japan, Australia, Sweden, Denmark, Korea and the United States as ranked in descending order of mobile broadband subscriptions) lie above the 100% penetration threshold.
Fixed broadband subscriptions in the OECD area reached 344.6 million as of June 2014, up from 332 million in June 2013 and making an average penetration of 27.4%. Switzerland, the Netherlands and Denmark remained at the top of the table with 47.3%, 40.8% and 40.6% respectively.
DSL remains the prevalent technology, making up 51.5% of fixed broadband subscriptions, but it continues to be gradually replaced by fibre, now at 17% of subscriptions. Cable (31.4%) accounted for most of the remaining subscriptions.
Annual growth of above 100% in fibre take-up was achieved in OECD economies with low to average ratio of fibre to total fixed broadband levels such as New Zealand, Luxembourg, Chile and Spain. Japan and Korea remain the OECD leaders, with fibre making up 71.5% and 66.3% of fixed broadband connections.
Full details are available from the OECD Broadband portal.


