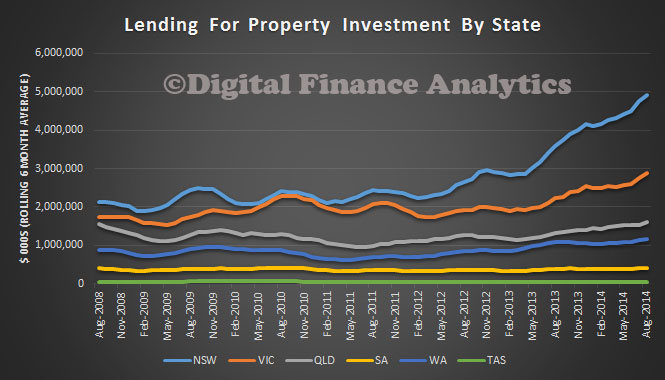
In the ABS data yesterday there was useful information on the state by state situation with regard to investment property lending. So today we look at the latest data, and it is quite shocking. The chart below shows the 6 month rolling average value of lending for property investment flows across the major states. It is the sum of lending for dwelling construction, and borrowing for established homes by individuals, and others. This is not seasonally adjusted, so it is original data. The most striking observation is the breakout in NSW, and to a lesser extend VIC. There is much more modest growth in the other states. No wonder then the RBA has been starting to warn.
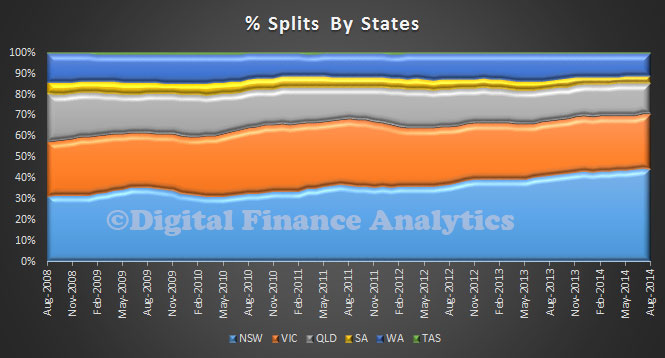
 But if we look by percentage splits, its is even more stark. In 2008, 32% of investment lending was in NSW, the most recent data puts it at 45%. In VIC, in 2008, it was 26%, today its still 26%. Compare this with QLD, where in 2008, it accounted for 23% of investment lending, whereas today it has dropped to 14.5%; WA also dropped a little. Combined, VIC and NSW comprise 71% of all investment lending – talk about concentration risks!
 There is a strong correlation with buoyant investment activity and house prices of course, and this raises a significant question for the regulators, if macroprudential is brought in, can it be done in a way to target the investment sector without causing unintended consequences, and if investment is slowed in NSW, what does that say about the prospects for house prices in coming months. It is indeed an unhappy state of play.


