More On Rental Yields – It Matters Where You Buy

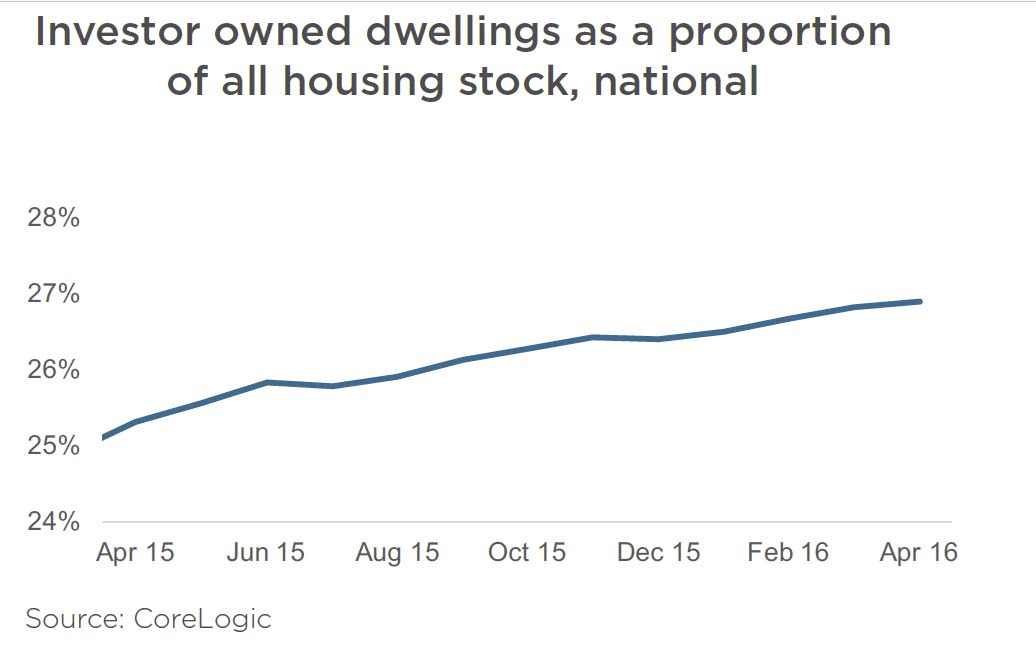
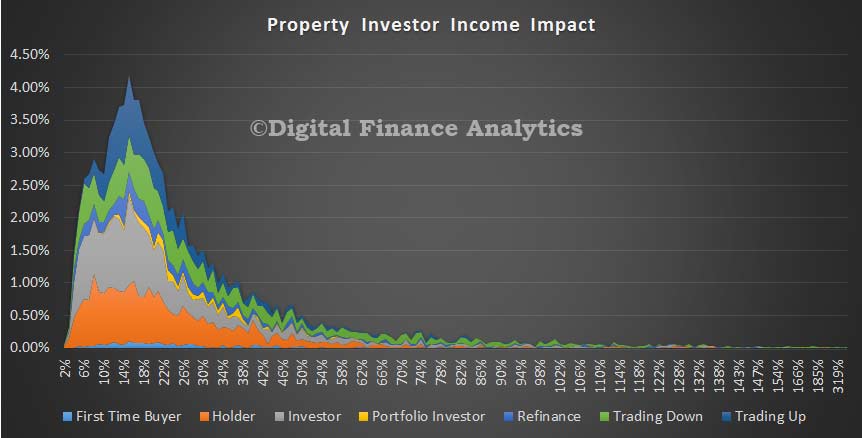
We continue our update on our rental yield modelling, using data from our household surveys. Last time we looked across the average gross and net yields (in cash-flow terms) by state, and also at average capital gains. Today we drill into the location specific analysis and also look at our master household segmentation.

But before we look at the data specifically, it is worth reflecting on why we show the data the way we do. New rules from Basel will require banks to hold more capital against loans which are required to be serviced from income other than rent. As a result, the question of net yield – meaning rental income, less loan repayments and other costs before tax suddenly become more important. Whilst the Basel rules are yet to be finalised (there are internal squabbles between members as to where to set the limits), this data is significant – and needs to be separated from any equity held in the property – as equity is no guide to loan serviceability, only an indicator of potential risk should a sale be forced.

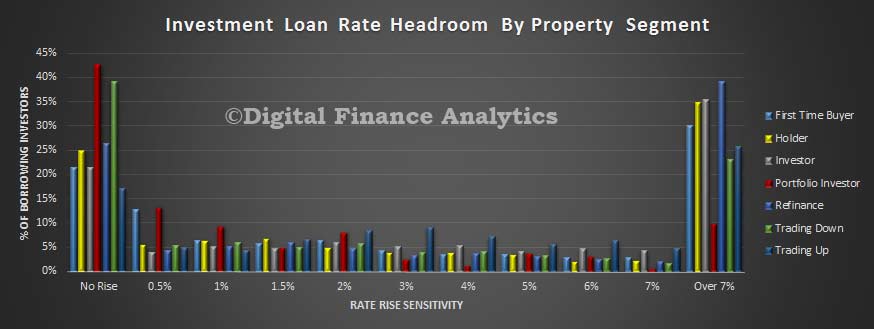
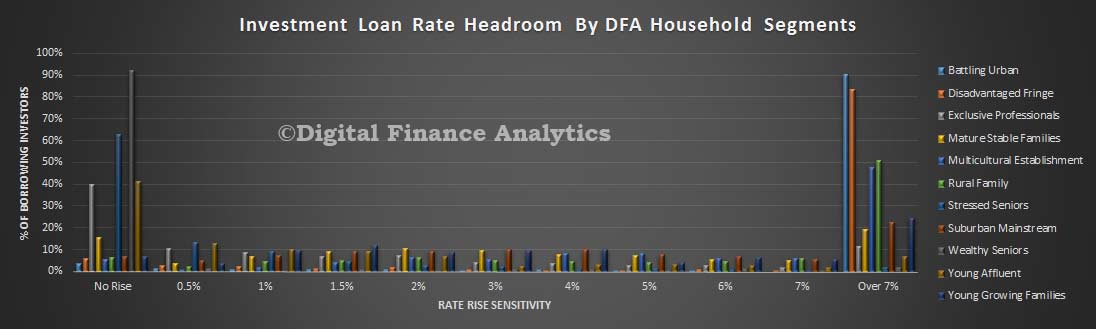
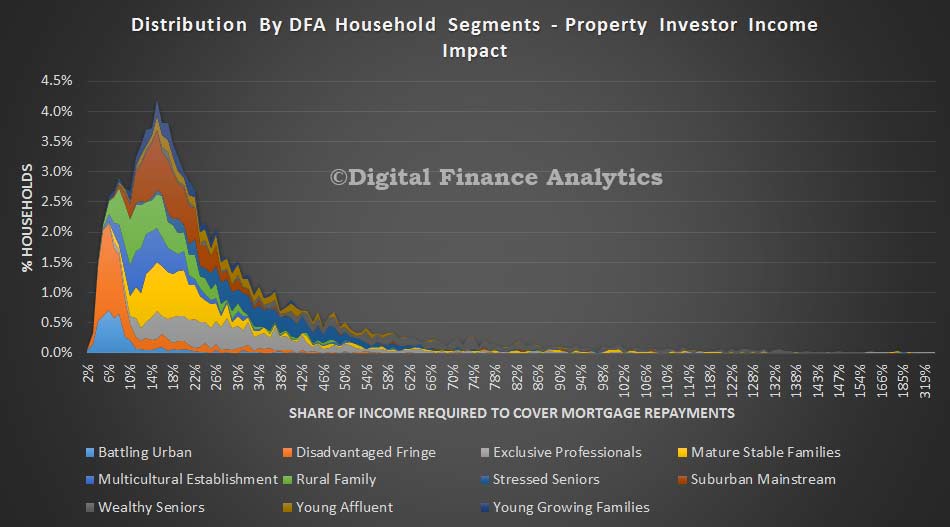
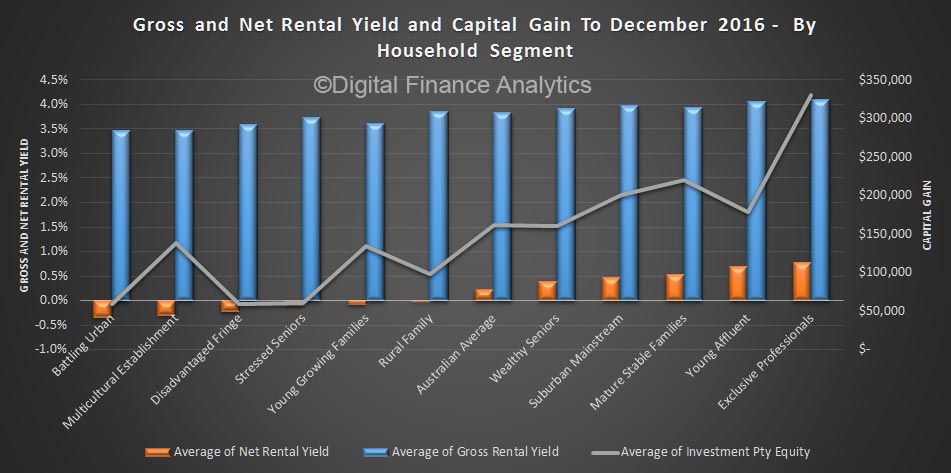
So now we turn to our household master segments. We find a startling truth. Most affluent households seem to be able to hold investment property where net yields are still positive, whereas less affluent households – those on the urban fringe, battlers, stressed older households and multicultural segments, as well as young growing families; on average have net yields in negative territory. Whilst there are a smaller number of these households, compared with the number of more affluent households who hold investment property, it is telling. In addition – and no surprise – more affluent households on average have more equity in the property (and more properties per household).

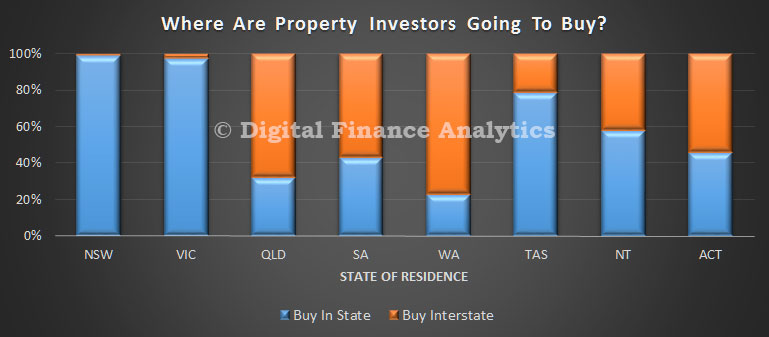
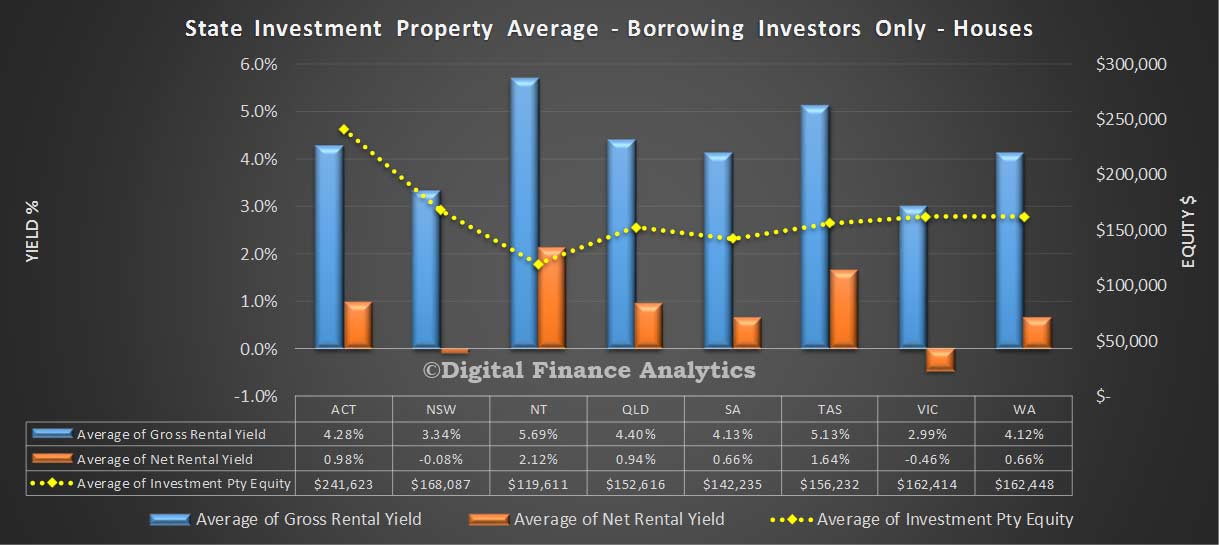
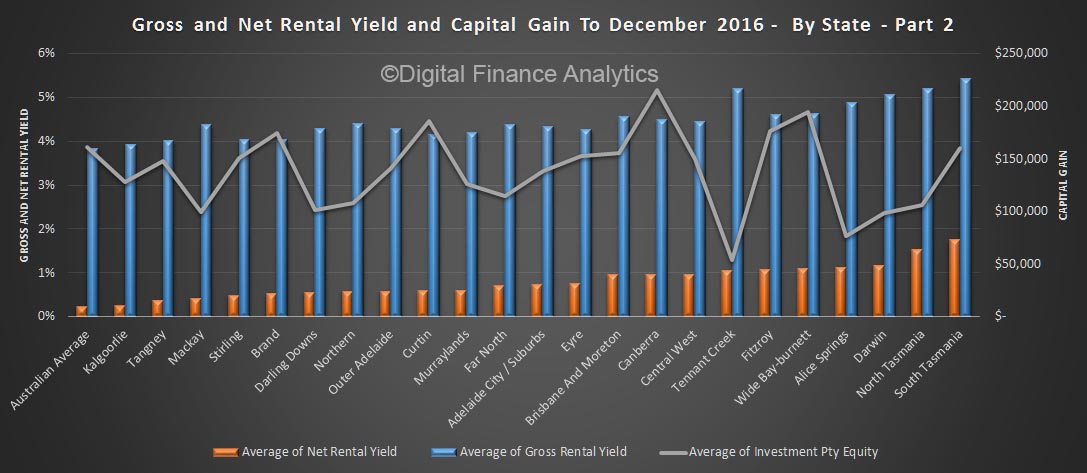
Another way to look at the investment portfolio is by regions and locations. We use a list of 50 or so, which cover the country. There are variations across these.  On average households in Horsham, Ballarat and Wangaratta have little equity in their investment properties, and are well underwater in terms of net rental yields.

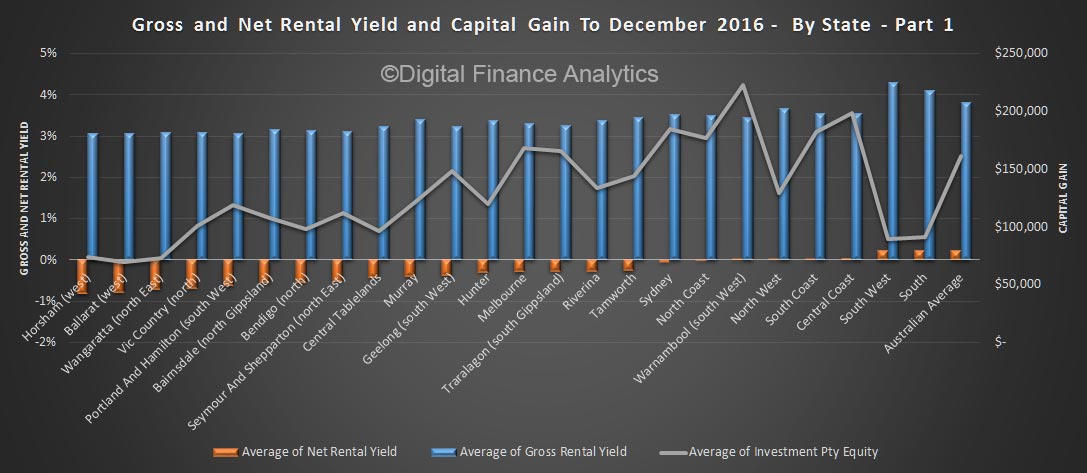
At the other end of the spectrum, investment properties in Darwin, Tasmania and areas of Queensland are in much more positive territory.

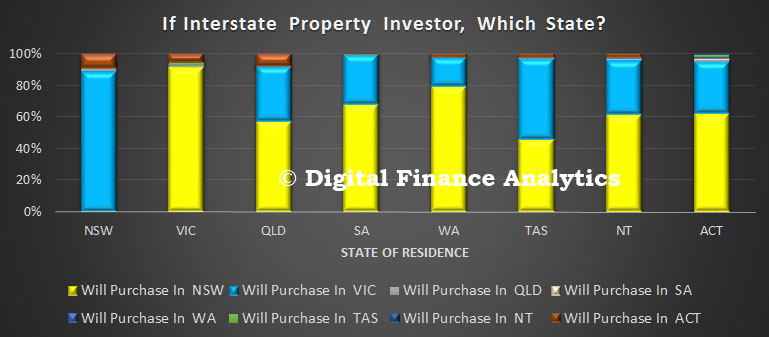
Investors in Warnambool, Canberra and in the Central Coast have the highest average paper capital profits (current property value less outstanding mortgage). But of course many investment households have large mortgages so they can offset interest against other income thanks to negative gearing.

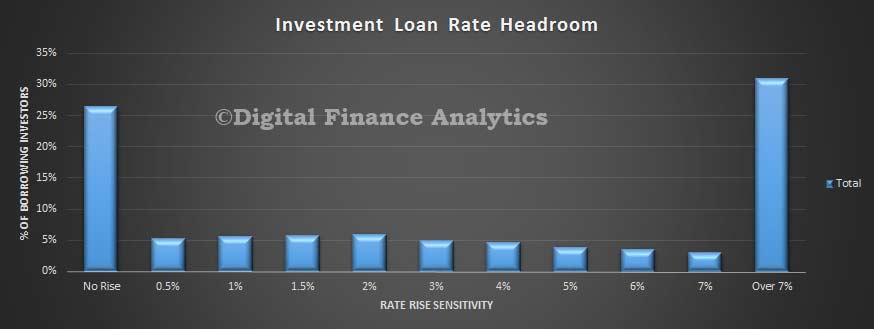
The pressure of rising investment loan interest rates, low rental income growth, and in some cases, vacant property are all having an impact. But the fallout is not equally spread across the country, or across households.

Banks offering ‘significant discounts’ to property investors

From Smart Property Investment

New research has revealed that property investors are negotiating significant price discounts on home loans, despite measures to cool investor lending.

Speaking to Smart Property Investment’s sister publication Mortgage Business following the release of the JP Morgan Australian Mortgage Industry Report last week, Digital Finance Analytics (DFA) principal Martin North, who co-authored the report, said “there is strong evidence that investors are becoming able to secure significant discounts” on their home loans.

wolli-building

“We are seeing competition swinging back more into the investor loan space. Some of the discounts we are seeing are even better than what is available to FHBs or even owner-occupiers with a higher LVR,” he said.

Rate discounts for investors all but disappeared when regulatory measures saw banks introduce differential pricing last year. Lenders then started to offer attractive headline rates under 4 per cent in an effort to secure investor business, particularly as the growth rate of their books fell below APRA’s 10 per cent speed limit.

According to Mr North, before differential pricing you could get up to 120 basis point discounts on investor loans. Now, he says, those discounts are returning as fresh momentum gathers in the investor lending market.

“Property investors seem convinced that capital growth is still available,” he explained.

“The banks are recognising this. So what they have done is take away some of those great headlines rates, those good deals, and started to offer heavier discounting for investors.

“I’ve noticed that some investors who have been transacting over the last few months have been able to get a very significant discount off their investment loan.”

However, Mr North said banks are “picky” and that discounts are heavily dependent on the type of deal. Investor home loans that are principle and interest (P&I) with an LVR of 80 per cent or less are attracting the biggest discounts, he said.

“My view is that these discounts are now back in the market. But you have to know where to look for them and you have to ask. It’s not just a case of flicking through the comparison websites.

“That’s why there is a very significant correlation between these discounts and mortgage brokers. They know where to find these discounts.”

The revelation comes as new data from major mortgage aggregator AFG shows lending to property investors remains strong, falling by just two percentage points over the September quarter.

Comparethemarket.com.au analysed AFG’s September quarter data to find that borrowing by real estate investors declined marginally from 34 per cent to 32 per cent for the first quarter of the 2016/17 financial year.

Back in May APRA announced the big four banks and Macquarie would be required to hold additional regulatory capital against their loan books as protection against any increase in defaults.

Banks have also tightened their lending requirements. For example, Commonwealth Bank no longer lends to self-employed foreign property investors.

“Tighter regulations designed to cool the property market, and lending to it, hasn’t deterred investors,” Comparethemarket.com.au spokesperson Abigail Koch said.

The latest ABS housing finance data shows that the $31.4 billion worth of commitments in August was split between $19.5 billion worth of commitments by owner-occupiers and $11.9 billion in commitments to investors. The value of lending to owner-occupiers has fallen over two consecutive months while lending to investors has risen for the fourth consecutive month.

The Investment Property Honeypots

We have just finished updating our household surveys, and over the next few days we will be running through some of the key findings which in due course will flow into the next edition of the Property Imperative.

We start with an observation which, is at one level completely logical, yet at another level is surprising. We have been asking prospective property investors whether they are planning to purchase in the next twelve months, as usual. There is still strong appetite, thanks to strong returns, tax incentives and low interest rates. However, we have also asked about which state they were expecting to purchase in, and we have found some significant variations across the states. We conclude that NSW and VIC are investment property honeypots, attracting both local and interstate interest, especially from WA. Another reason why prices are on the rise here.

The first chart shows the relative proportion of property investors in each state, who expect to purchase in their home state. Almost all NSW based investors are expecting to buy in NSW, and those in VIC, mainly in VIC. But there are more residents in QLD, SA, ACT and WA who are expecting to buy interstate than in their home states.

Investor-Interstate-1We then asked those considering interstate transactions, to identify their likely target state. In NSW, the small number considering interstate investment picked VIC, whilst residents in VIC going interstate will pick NSW. Across the other states, the majority of those seeking investments interstate will pick NSW, or second VIC. A smaller number would also select ACT. These three states captured the bulk of the interstate attention.

Interstate-Investor-2Finally, we asked about the drivers of this decision. The prime driver related to increased capital returns, a larger property market, lending criteria and rental returns.

Investor-Interstate-DriversSo, we can conclude that demand in NSW and VIC for investment property is heightened by interested interstate investors who are attracted by the higher returns in these two states. Further evidence of the two speed housing market.

Reserve Bank NZ consults on new nationwide investor LVR restrictions

The Reserve Bank has today released a consultation paper proposing changes to loan-to-value restrictions (LVRs) to further mitigate risks to financial stability arising from the current boom in house prices. The proposals simplify the current policy by applying two nationwide speed limits for owner-occupier and investor lending.

New Zealand house prices have increased by around 50 percent since 2010, driven by strong immigration, low mortgage rates and sluggish housing supply. With house prices becoming increasingly disconnected from underlying household incomes and rents, there is significant potential for house prices to fall very rapidly if the factors currently supporting the market reverse. Average house prices in New Zealand are now around 6.5 times average household income. When combined with the preexisting imbalance built up prior to the GFC, the house price-to-income ratio is further from its historical average than in almost any other OECD country

NZ-LVR-ReviewRising investor defaults pose significant risks to the financial system, with a growing body of international evidence suggesting that loss rates on investor lending are significantly higher than owner-occupiers during severe housing downturns. There are caveats to applying evidence from other economies to New Zealand, including that mortgage origination standards can vary significantly across countries and time. These problems are mitigated by focussing on the differential between default rates for investors and owner-occupiers identified in international studies. Moreover, the tendency for higher investor default rates is consistent with a range of structural characteristics of investor loans in New Zealand. Direct evidence for New Zealand or Australia is limited as there has not been a severe housing downturn for many decades.

“The banking system is heavily exposed to the property market with residential mortgages making up 55 percent of banking system assets. Investor lending has been increasing rapidly and is a significant contributing factor to the current market strength.  The proposed restrictions recognise the higher risks associated with such lending,” Governor Graeme Wheeler said.

Investor lending is growing strongly, rising from around 28 to 36 percent of overall mortgage lending over the past eighteen months. This suggests that the share of investor loans on bank balance sheets has increased significantly (especially given that more than half of investor loans have been on interest only terms in recent months). Despite tighter LVR restrictions, the investor share of sales has increased in both Auckland and the rest of New Zealand. This suggests that many Auckland investors have been able to increase borrowing capacity by
revaluing their existing properties.

Under the proposed new restrictions:

  • No more than 5 percent of bank lending to residential property investors across New Zealand would be permitted with an LVR of greater than 60 percent (i.e. a deposit of less than 40 percent).
  • No more than 10 percent of lending to owner-occupiers across New Zealand would be permitted with an LVR of greater than 80 percent (i.e. a deposit of less than 20 percent).
  • Loans that are exempt from the existing LVR restrictions, including loans to construct new dwellings, would continue to be exempt.

These proposed new restrictions would take effect on 1 September 2016 and simplify the LVR policy by removing the current distinction between lending in Auckland and the rest of the country.

Mr Wheeler said: “The drivers of the housing market strength are complex and action is required on many fronts that extend well beyond financial policy.  Broad initiatives to reduce the underlying housing sector imbalances need to remain a top priority.

“A sharp correction in house prices is a key risk to the financial system, and there are clear signs that this risk is increasing across the country.  A severe fall in house prices could have major implications for the functioning of the banking system and cause long-lasting damage to households and the broader economy.

“LVR restrictions to date have improved the resilience of bank balance sheets by reducing banks’ exposure to riskier mortgages. This policy initiative is intended to further improve the resilience of bank balance sheets, and it will assist in restraining credit and housing demand.

“We expect banks to observe the spirit of the new restrictions in the lead-up to the new policy taking effect.”

Consultation concludes on 10 August.

Mr Wheeler said that the Bank is progressing its work on potential limits to high debt-to-income ratio lending, which would be a potential complement to LVR restrictions.

“We have had positive initial discussions with the Minister of Finance on amending the Memorandum of Understanding on Macro-prudential policy to include this instrument.”

CoreLogic’s Profile of the Australian Residential Property Investor

CoreLogic released its national Profile of the Australian Residential Property Investor Report, which comprises analysis around residential property investment across Australia, and seeks to quantify investment-related activity.

Nationally, investor owned dwellings comprise 26.9% of all housing stock, but 23.8% of the value of all housing stock, highlighting that investment in the housing market is generally across lower valuation segments compared with owner occupied homes.

CoreLogic-1At a national level investment is generally skewed towards the lower valuation brackets; 53.4% of investment-owned dwellings have a current estimated market value of less than $500,000, compared with 46.9% of owner occupied dwellings. Additionally, each capital city shows the large majority of investor -owned dwellings have an estimated market value that is lower than the capital city median value.

Across the broad product categories of houses versus units, investment is heavily concentrated within the unit sector, where investor owners comprise almost half (48%) of all attached housing.Conversely, detached housing ownership is more biased towards owner occupiers, with investors accounting for 17% of all detached housing stock.

CoreLogic-2 CoreLogic estimates there are 2.6 million investor owned dwellings across Australia worth approximately $1.37 trillion. Based on the most recent taxation data, there are 2.03 million individuals who indicated they owned a residential rental property, implying a very low concentration of investment (approximately 1.28 investment properties per investor).

Actually, you need segment the investment sector, as we do, between Portfolio Investors, who have multiple investment properties (average number 8) and Property Investors who have one or two properties. Averaging across all property investors misses this important segmentation.

According to the ABS, the total value of Australia’s 9.7 million residential dwellings increased $15.4 billion to $5.9 trillion. The mean price of dwellings in Australia is now $613,900. CoreLogic, on the other hand, says property is worth an estimated $6.5 trillion across 9.6 million dwellings, with an average price of $677,000!

In any event, they are right to say “the housing asset class is worth more than three times the value of Australian superannuation funds ($2.0 trillion) and more than four times the value of Australian listed stocks ($1.5 trillion)”.

Property Investors Are Still In The Game

Today we continue to feature research published in the latest edition of The Property Imperative, The full report is available on request.  We look across the property investment sector, which remains strong despite lower growth in investment lending. We continue to see that tax benefits and the prospects of better gains than deposit accounts or shares drives the market. This despite the fact that some investors have a negative net yield, thanks to low rental growth.

Solo Investors.

About 992,000 households only hold investment property, 2.5% of which are held within superannuation. Households in this segment will often own one or two properties, but do not consider they are building an investment portfolio.

Solo-Feb-2016Around 68% of households expect prices to rise in the next 12 months, 38% of households expect to transact within the next year, 53% will need to borrow more, and 37% will consider the use of a mortgage broker.

Investor-Barriers-Feb-2016There are a number of barriers to investment, which our surveys identified. Many investors had already bought, so were not in the market (34%). More than 26% of potential investors were concerned by possibly adverse change to regulation – negative gearing or capital gains and 9% specifically referred to risks in the May budget. Some (12%) said they felt property prices were now too high.

Portfolio Investors

Households who are portfolio investors maintain a basket of investment properties. There are 191,000 households in this group. The median number of properties held by these households is eight. Most households expect that house prices will rise in the next 12 months (70%), and 64% said they will transact in the next 12 months. Many will borrow more to facilitate the transaction (90%), and 52% will use a mortgage broker. Significantly we now see about 23% of portfolio investors looking to their property investments as the main source of income, it has in effect become their full time job. A significant characteristic is the cross leverage from one property to the next.

AllInvestors-Feb-2016

Super Investment Property

Throughout the survey we noted an interest in investing in residential property via a self-managed superannuation funds (SMSFs). It is feasible to invest if the property meets certain specific criteria.

Overall our survey showed that around 3.75% of households were holding residential property in SMSF, and a further 3.5% were actively considering it.

SuperTransact-Feb-2016Of these, 33% were motivated by the tax efficient nature of the investment, others were attracted by the prospect of appreciating prices (24%), the attractive finance offers available (12%), the potential for leverage (15%) and the prospect of better returns than from bank deposits (12%).

We explored where SMSF Trustees sourced advice to invest in property, 23% used a mortgage broker, 22% online information, 11% a Real Estate Agent, 14% Accountant, and 7% a Financial Planner. Financial Planners are significantly out of favour in the light of recent bank disclosures publicity on poor advice.

TrusteeAdvice-Feb-2016The proportion of SMSF in property was on average 34%.

SMSFSharePty-Feb-2016According to the fund level performance from APRA to December 2015, and DFA’s own research, Superannuation has become big business, with total assets now worth over $2 trillion (compare this with the $5.5 trillion in residential property in Australia), an increase of 6.1 % from last year.

APRA reports that Self-Managed Superannuation funds held assets were $594.6 billion at December 2015, a rise from $578.9 billion in Sept 2015.

How Sensitive Are Property Investors To Interest Rate Rises?

Continuing our series on potential material risks within investment loans, today we reveal some of the analysis we have undertaken on the potential impact on investors of prospective rate rises using data from our household surveys. We framed the questions here around how large a rise could an individual household cope with before getting into financial discomfort. We considered scenarios between zero and 7%. The overall results are startling. We found that about a quarter of property investors said they would have difficulty meeting any additional interest rises – even 0.5% – implying that they are already under financial pressure. Others could cope with various rises, though more than 50% of investors would be in potential difficulties should rates rise by 3%. On the other hand, more than 30% of investors were able to cope with a significant rise, even above 7% from current levels.

InvestmentSo which households are most exposed? We start by looking across the DFA property segments. We found that 20% of first time buyer investors would be concerned by any rise, whereas more than 40% for portfolio investors (who are more highly geared) and a considerable proportion of people who traded down and geared into an investment property recently would be caught out. Others, such as those refinancing, or holding property appear to be more able to swallow potential rises.

Sensitivity-By-Pty-SegmentThe size of the loan portfolio has a bearing on households, with the average portfolio investor having a balance of over $750,000 in investment property (some much more) so would be more sensitive to rate rises..  We conclude that generally households with smaller investment loans are (perhaps obviously) a little more able to cope with potential rises.

Sensitivity-By-Loan-Value-INVNext we cut the data by states. Here we found that investors in TAS were most concerned about potential rate rises, followed by SA and ACT. These are states were income growth (and property appreciation) is slowest. On the other hand, investors in WA and NT appeared more able to cope with significant rises

Sensitivity-By-State-INVFinally, we examine the data by our core household segments. Here we found that wealthy seniors were the most exposed (incomes relatively flat compared with their investment portfolios), followed by stressed seniors and young affluent.

Sensitivity-By-Core-Segment-INVOf course, if rates were to rise – perhaps this is not likely in the near term – investors have the option of selling up, but the analysis shows that some would need to act quite fast in a rising rate environment. It also raises the question as to whether the banks underwriting criteria are working – because they should be assuming borrowers could cope with a rise to above 7.5%, which is 2-3% higher than most are currently paying. Our research suggests that some households are geared up to the hilt, and have no spare cash for unexpected raises down the track.

Next time we will add in the impact of owner occupied borrowing also.

How Material Is “Material” For Property Investors?

The latest iteration of the BIS paper on proposed capital adequacy changes includes a fundamental change to the way the risk charge would be calculated for investment property purchases funded by a mortgage. Fundamentally, if repayments are “materially dependent on cash flows generated by the property”, then depending on the loan to value ratio, the risk weighting could be as high as 120%, significantly higher than today. We discussed this in our recent post.

BIS does not give any clear guidance on what “materially dependent” might mean, and comments are open until mid March, so finalisation will be later than this. However, this got us thinking. What would happen if, for some reason, the rental income stream stopped? Clearly in the short term, pending finding a new tenant or selling the property, the repayments would have to be made from other income streams – salary, investments and dividends.

So we have run some scenarios on our household database, to examine the potential impact. To start we estimate the average proportion of gross income which would need to go to servicing the investment mortgage. We have taken into account income from all sources (excluding rental income), and also calculated repayments based on the current interest rate, adjusted for discounts, and whether the mortgage was a principle and interest loan, or an interest only loan. We also take account of the impacts of negative gearing.

Over the next few days we will share some of our modelling, which will ultimately flow into our next Property Imperative report. Our last edition dates from September 2015 and is still available on request.

Our first analysis is grouped by our household property segments. These include households who only have investment property (Investors, and Portfolio Investors), as well as households with both an owner occupied property and an investment property (including first time buyers, holder, refinanced, trading-up and trading-down. You can read more about our segmentation here.

The chart shows the impact to their income if the repayments were to be serviced by said income, rather than rental streams.  The chart shows the proportion of income which would be consumed, and the distribution of households by segment. There is considerable variation, but we see that a considerable proportion of households would need to put more than 25% of their income aside to service the mortgage. A small, but worrying proportion would require more than 50% of their income, and a small number more than 100%. This is significant, given the current low (and falling) income growth rates.

Income-Hit-1We can also look at the data through the lens of our master household segments. These are derived from a range of demographic and behaviourial elements. We see that generally more affluent households are more exposed to investment property, and as a result, require a larger proportion of their income (despite having larger incomes)  to support the repayment required to replace rental income.  We also see that stressed seniors, with a rental are more exposed, which is not surprising given their lower income levels.

Income-Hit-2 Standing back, this initial analysis shows that it is not easy to determine what is “material”. Different segments and property portfolios will require different settings. In addition, as the extra capital charges being discussed will translate into higher mortgage interest rates for some, it appears that these increases will hit different segments to varying extents.

Will BIS attempt to describe conditions which are material, or leave it to the individual regulatory authorities – such as APRA?

Next time we will look at the consolidated impact of households with both owner occupied and investment loans. This is important because some households have more than half their income servicing property.

Many Eastern States Investment Properties Are Underwater

We have had the opportunity to do a deep dive on investment property loans, using data from our household surveys. We have looked at gross rental returns, net rental returns (after the costs of mortgage servicing are included) and net equity held (current property value minus mortgage outstanding). The results are in, and they make fascinating reading, especially in the context of up to 40% of all residential property loans being for investment purposes, according to the RBA. Whilst we will not be sharing the full results here, one chart tells the story quite well.

We show the average gross rental yield on houses by state, (the blue bar), net rental yields before tax (the orange bar) and the net gross average capital gain (the yellow line). Gross yield is annualised rental over current value, assuming full occupancy;  net rental is annual rental less annual mortgage repayments; and capital value is the current marked to market price less current outstanding mortgage. The first two are shown as a percentage, the last as a dollar value. The chart below only covers houses, we have separate data on other property types but won’t show that here.

Rental-SnapshotWe found that investment property which were houses in VIC were on average losing money at the net rental level (and this is before any maintenance or other costs on the property). Those in NSW were a little better, but still in negative territory. The other states were in positive ground – some only just – and of course this is at current interest rates, before the latest uplifts were applied by the banks. We accept that the pre-tax position does not tell the full story, but as a stand-alone investment, many property investors are from a cash flow perspective underwater. Indeed, they are banking on prospective capital gains, and at the moment, they do have a cushion, but if prices were to slip, many would find this eroded quickly.

Our take is that the property investment sector contains considerable risks for banks, and investors, and these are not well understood at the moment. The more detailed analysis we did also showed that some specific customer segments, regions and postcodes were more at risk. Running scenarios on small interest rate rises shows that things get worse very quickly, especially for higher LVR loans.

We concur with analysis from Ireland and New Zealand, that the risks in the investment loan portfolios, despite the apparent historic low rates of default, are higher, and under Basel IV we expect investment loans to carry a higher capital rating, meaning that interest rates on investment loans are likely to rise more in the future, relative the the cash rate.


Property Investors Are Still Optimists

Continuing our series on the latest findings from The Property Imperative, we look at property investors today. We find that they are seriously optimistic about the future of property (and recent capital gains have fueled their future expectations).

Looking first at what we call solo investors, about 987,000 households only hold investment property, 2.2% of which are held within superannuation. Households in this segment will often own one or two properties, but do not consider they are building an investment portfolio.

They are strongly driven by the tax efficient nature of property investment via negative gearing and capital gain concessions. They also have enjoyed low finance rates, strong capital appreciation, and better returns than from bank deposits.

DFA-Sept-Solo-InvestorsAround 84% of households expect prices to rise in the next 12 months, 42% of households expect to transact within the next year, 51% will need to borrow more, and 39% will consider the use of a mortgage broker.

Turning to portfolio investors who are households who are portfolio investors maintain a basket of investment properties. There are 178,000 households in this group.We see somewhat similar motivations as discussed above, with tax efficiency being the strongest driver, followed by appreciating property values and good returns. We see a number of these households devoted to property investment as a full-time occupation.

DFA-Sept-Port-InvIndeed, the median number of properties held by these households is seven. Most households expect that house prices will rise in the next 12 months (88%), and 77% said they will transact in the next 12 months.

Many will borrow more to facilitate the transaction (85%), and 53% will use a mortgage broker. Significantly we now see about 21% of portfolio investors looking to their property investments as the main source of income, it has in effect become their full time job.

Next time we look at those investing via a self managed superannuation fund.