Some time back we reported on the results of our household surveys, looking especially at the loan to income (LTI) data. This was prompted by the Bank of England’s move to limit banks abilities there to lend higher LTI loans. At the time we showed that at an aggregate level, LTI’s in Australia were higher than in the UK, yet despite this, there was no evidence of any local move to curb higher LTI borrowings, other than vague warnings from the regulators more recently. There is little relevant data published by the regulators on this important metric.
Today we delve into to the LTI data series in more detail. Interestingly the control of LTI’s was the preferred macroprudential tool of choice by BIS and others. The UK recommendation was to ensure that mortgage lenders do not extend more than 15% of their total number of new residential mortgages at Loan to Income ratios at or greater than 4.5 times.
In our surveys we ask about a households mortgage loan, and its total gross income. From this we can derive an LTI ratio.
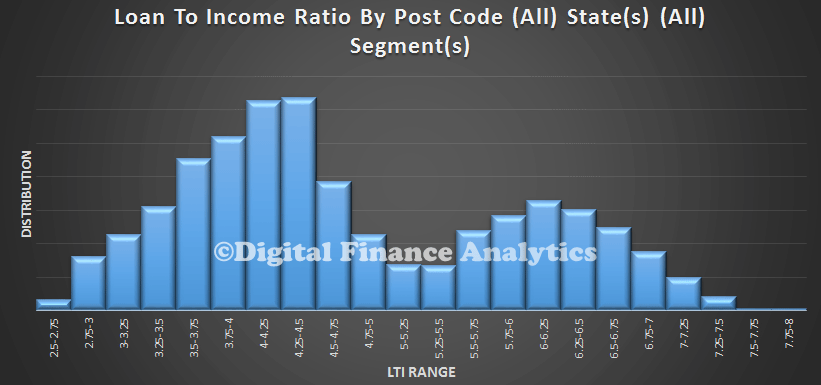
So, to recap. this is the current picture of LTI, averaged across post codes for all household segments, and all states. There is a peak around 4.5 times, and a second peak above 6 times.
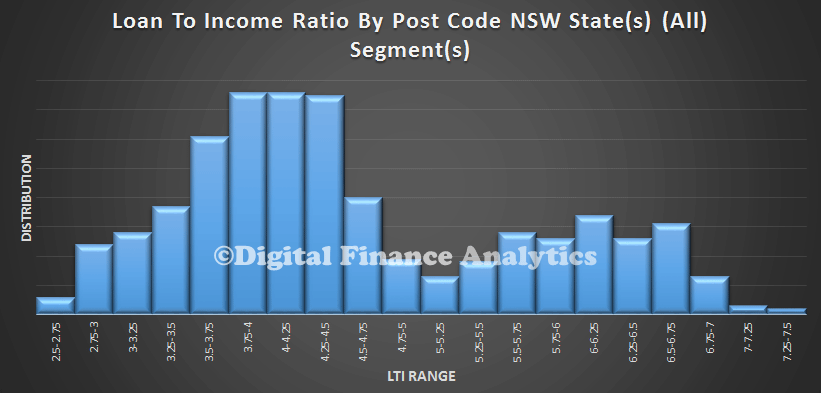
 Now, we can break the data out by state, and household segment, using the DFA survey data. The state specific data for NSW largely mirrors the national average.
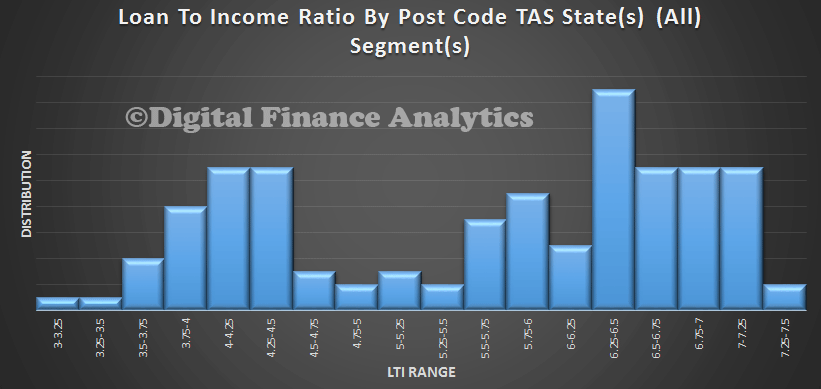
 However, looking at TAS, we see some interesting variations. There the LTI’s are higher, reflecting lower incomes relative to somewhat lower house prices. We have adjusted the sample to take account of the smaller populations.
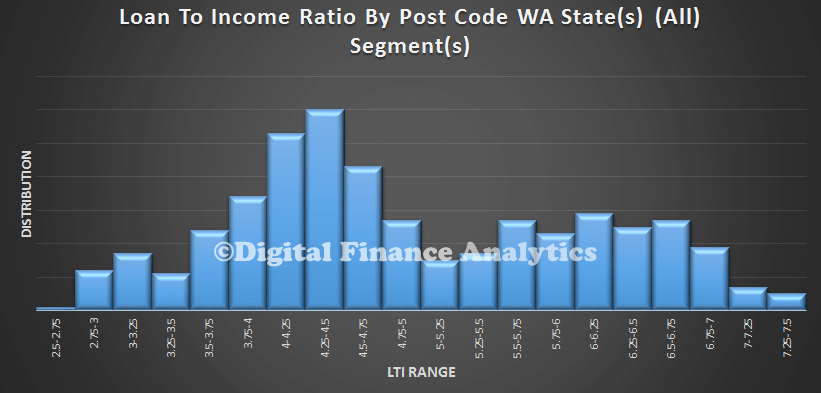
 WA again shows variation, with a significant spread of higher LTI loans than the average.
 QLD shows greater concentration at lower LTI’s but then a second smaller peak at the upper end.
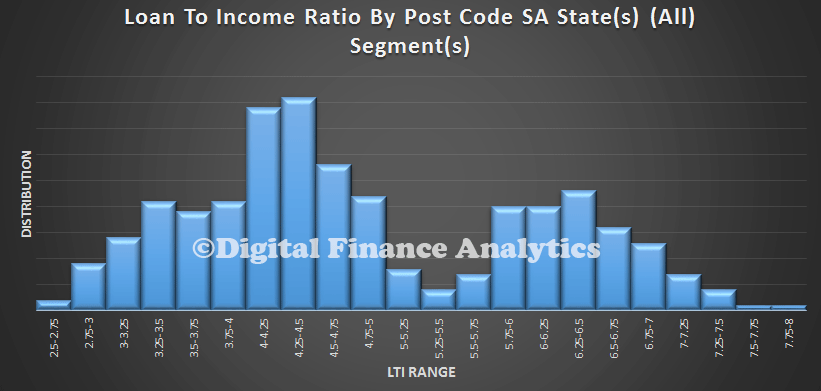
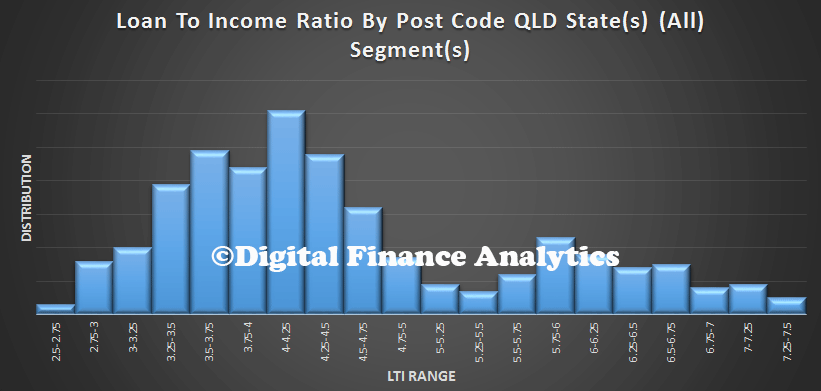 SA has quite a spike around 4.5 times, and a second peak around 6.5, again reflecting lower income levels in that state.
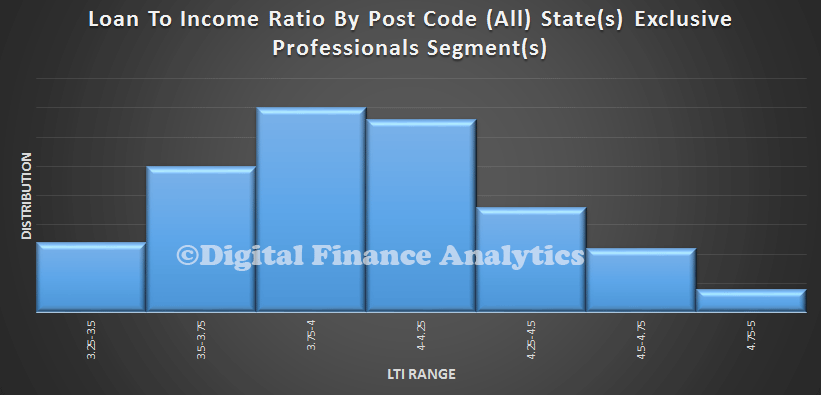
 If we then start to look at segments, we find that affluent group, Exclusive Professionals, has a consistently lower LTI, compared with…
 … Battlers …
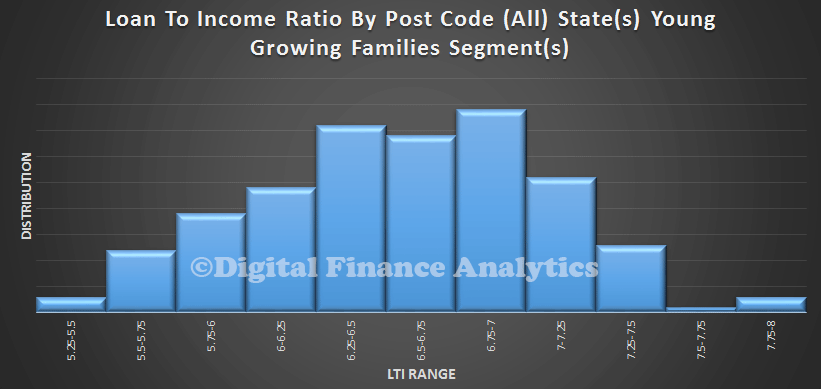
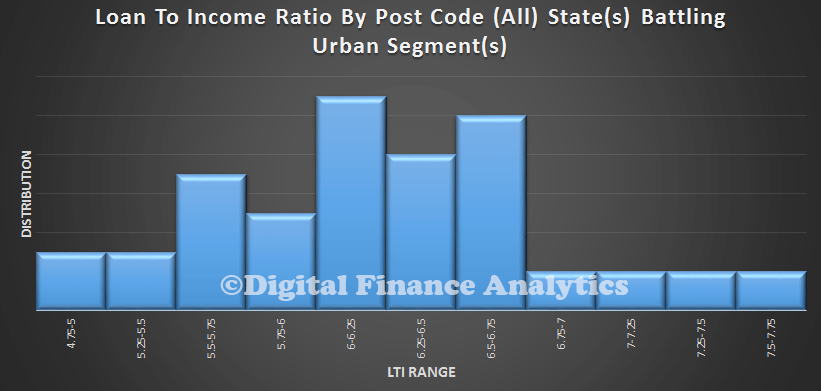 … And the Young Growing Families. Many of the First Time Buyers are in this segment. Effective LTI’s above 7 times are significantly extended.
 I won’t go through all the other segments now, but the analysis suggests to me that the LTI metric is significant, and a good leading indicator of risks in the system. Remember interest rates are at rock bottom at the moment, so households can keep their heads above water. But as we know rates may rise, and unforeseen events may change individual circumstances. Households with such high LTI’s have very little wriggle room. As the interim FSI report said “Since the Wallis Inquiry, the increase in housing debt and banks’ more concentrated exposure to mortgages mean that housing has become a significant source of systemic risk”. “Higher household indebtedness and the greater proportion of mortgages on bank balance sheets mean that an extreme event in the housing market would have significant implications for financial stability and economic growth”.
 You can compare this mapping with the mortgage stress analysis for Melbourne, as there are some significant correlations.
 In contrast the lowest LTI ratios are found in these post codes:
 We have already summarised the situation in Sydney, when we first discussed the data in the context of the recent UK initiatives to curb high LTI loans. We will present detailed data for other states later.
 Now, we can break the data out by state, and household segment, using the DFA survey data. The state specific data for NSW largely mirrors the national average.
 However, looking at TAS, we see some interesting variations. There the LTI’s are higher, reflecting lower incomes relative to somewhat lower house prices. We have adjusted the sample to take account of the smaller populations.
 QLD shows greater concentration at lower LTI’s but then a second smaller peak at the upper end.
 SA has quite a spike around 4.5 times, and a second peak around 6.5, again reflecting lower income levels in that state.
 If we then start to look at segments, we find that affluent group, Exclusive Professionals, has a consistently lower LTI, compared with…

