The Million Dollar Man Who Is Waiting For The Bubble To Burst

In the latest edition of my discussions with economist John Adams, we look at recent RBA monetary policy, and conclude is not fit for purpose.

Despite all the hype, the next cash rate move could well be down, as the bursting debt bubble approaches.

John’s original article is here.


Is The RBA Myopic On Financial Stability?

From The Conversation.

The Reserve Bank of Australia (RBA) is making an explicit trade-off between inflation and financial stability concerns. And this could be weighing on Australians’ wages.

In the past, the RBA focused more on keeping inflation in check, the usual role of the central bank. But now the bank is playing more into concerns about financial stability risks in explaining why it is persistently undershooting the middle of its inflation target.

In the wake of the global financial crisis, the federal Treasurer and Reserve Bank governor signed an updated agreement on what the bank should focus on in setting interest rates. This included a new section on financial stability.

That statement made clear that financial stability was to be pursued without compromising the RBA’s traditional focus on inflation.

The latest agreement, adopted when Philip Lowe became governor of the bank in 2016, means the bank can pursue the financial stability objective even at the expense of the inflation target, at least in the short-term.

While the RBA board has explained its recent steady interest rate decisions partly on the basis of risks to financial stability, this sits uneasily with what the RBA otherwise has to say about underlying fundamentals of our economy.

It correctly blames trends in house prices and household debt on a lack of supply of housing, and not on excessive borrowing. These supply restrictions amplify the response of house prices to changes in demand for housing. RBA research estimates that zoning alone adds 73% to the marginal cost of houses in Sydney.

Restrictions on lending growth by the Australian Prudential Regulation Authority since the end of 2014 have been designed to give housing supply a chance to catch-up with demand and to maintain the resilience of households against future shocks.

The RBA argues that it needs to balance financial stability risks against the need to stimulate the economy through lower interest rates. But this has left inflation running below the middle of its target range and helps explain why wages growth has been weak.

The official cash rate has been left unchanged since August 2016, the longest period of steady policy rates on record. The fact that inflation has undershot its target of 2-3% is the most straightforward evidence that monetary policy has been too restrictive.

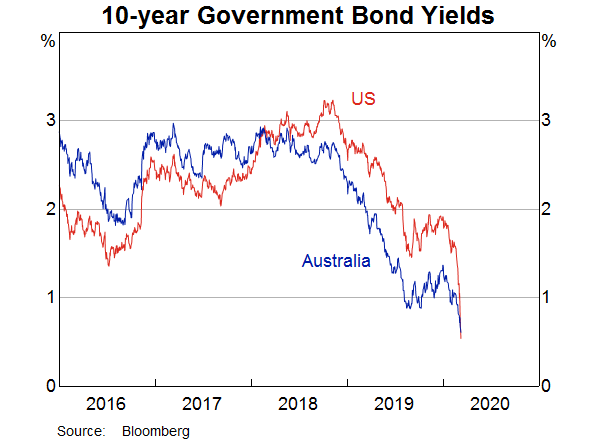
While long-term interest rates in the US continue to rise, reflecting expectations for stronger economic growth and higher inflation, Australia’s long-term interest rates have languished.

Australian long-term interest rates are below those in the US by the largest margin since the early 1980s. This implies the Australian economy is expected to underperform that of the US in the years ahead.

Inflation expectations (implied by Australia’s long-term interest rates) have been stuck around 2% in recent years, below the Reserve Bank’s desired average for inflation of 2.5%.

Financial markets can be forgiven for thinking the RBA will not hit the middle of its 2-3% target range any time soon. The RBA doesn’t believe it will either, with its deputy governor Guy Debelle repeating the word “gradual” no less than 12 times in a speech when describing the outlook for inflation and wages.

Inflation has been below the midpoint of the target range since the December quarter in 2014. On the RBA’s own forecasts inflation isn’t expected to return to the middle of the target range over the next two years.

The Reserve Bank blames low inflation on slow wages growth, claiming in its most recent statement on monetary policythat “labour costs are a key driver of inflationary pressure”. But this is putting the cart before the horse.

In fact, recently published research shows that it is low inflation expectations that are largely to blame for low wages growth.

Workers and employers look at likely inflation outcomes when negotiating over wages. These expectations are in turn driven by perceptions of monetary policy.

Below target inflation makes Australia less resilient to economic shocks, not least because it works against the objective of stabilising the household debt to income ratio. Subdued economic growth and inflation also gives the economy a weaker starting point if and when an actual shock does occur, potentially exacerbating a future downturn.

When the RBA governor and the federal treasurer renegotiate their agreement on monetary policy after the next election, the treasurer should insist on reinstating the wording of the 2010 statement that explicitly prioritised the inflation target over financial stability risks.

If the RBA continues to sacrifice its inflation target on the altar of financial stability risks, inflation expectations and wages growth will continue to languish and the economy underperform its potential.

Author: Stephen Kirchner, Program Director, Trade and Investment, United States Studies Centre, University of Sydney

RBA Sees Cake Tomorrow

The latest RBA Statement on Monetary Policy moves the dial a little in terms of expectations, but also is still predicting better economic outcomes down the track, if a little further away than originally expected (again).

By 2020, GDP could be somewhere between 1 and 5.5% – that should about cover it!

They call out risks relating to the amount of debt in the household sector, and the prospect of higher funding costs, and lower consumption should home prices fall.  So there are a number of important items in the economic cross currents, and I am going to focus there today.

First, the highlight that US funding costs are on the rise, as US dollar money markets have increased.

They highlight that these developments have had a notable knock-on effect on Australian money markets.  “In part, this is because Australian banks raise a portion of their funding in US markets to finance their domestic assets. So they have responded to higher US rates by seeking to borrow more in domestic markets, which has place upward pressure on rates in Australia. Similar effects, although less pronounced, can be seen on rates
in the United Kingdom and New Zealand. By contrast, banks in the euro area and Japan tend to raise funds in US dollar markets in order to fund US dollar assets, and so have less scope to substitute into domestic funding sources”.

“Higher bank bill swap (BBSW) rates affect bank funding costs in a number of ways. First, BBSW rates flow through to the rates banks pay on their new short- and long-term wholesale debt. In addition to this effect, bank bond
yields have increased by around 20 basis points since the start of the year.

Second, the higher BBSW rates increase some of the costs associated with hedging the risks on banks’ debt. Banks tend to issue fixed-rate bonds and then swap a sizeable share of these fixed interest rate exposures into floating rate exposures. This better aligns the interest rate exposure from their funding with their assets (which consist largely of variable interest rate loans). In doing this, the banks typically end up paying BBSW rates on their hedged liabilities, which flow through to the cost of funding.

Third, rates on wholesale deposits tend to be closely linked to BBSW rates, so the cost of these deposits is rising. Wholesale deposits include deposits from large corporations, pension funds and the government, and account for around 30 per cent of banks’ debt funding. Over the year to date, retail deposit rates have decreased slightly, mostly reflecting declines in the rates on online saving accounts. Most, but not all, of these decreases occurred
before the recent increase in BBSW”.

They suggest that “revisions” to the household consumption series shows a higher level of spend than previously thought. “Household consumption grew strongly in the December quarter and revisions to previous data
show that consumption growth held up better than previously thought in the second half of 2017 (Graph 2.8). Over the year, consumption grew by almost 3 per cent. Upward revisions to household consumption were particularly large for discretionary categories of expenditure, which tend to be more sensitive to household finances. Spending on overseas travel by Australian residents (which is classified as imports) was a major source of these revisions, while upward revisions to food and health expenditure
also lifted essential expenditure. More recent indicators suggest that household consumption growth was steady in early 2018: growth in retail sales held up in the first two months of the year. Measures of households’
sentiment towards their personal finances remain above their long-run averages, after increasing since the middle of 2017”.

“Household consumption grew at a faster rate than household disposable income over 2017; the household saving ratio is reported to have declined, although it stabilised towards the end of the year as income growth picked up (Graph 2.10). Growth in real household disposable income was below average over 2017 at 1.7 per cent, largely because of low wages growth. The prospect of continued low growth in household income remains a key risk to the outlook for household consumption, especially given high levels of household debt. Slower growth in household net wealth, particularly in an environment of below-average income growth, adds to uncertainty about the outlook for consumption”.

“New dwelling construction declined by 5 per cent over 2017. This follows a few years in which new dwelling construction increased to high levels, supported by low interest rates, strong population growth and higher
housing prices in the eastern states. The recent decline in residential construction activity has been concentrated in detached housing, while higher-density construction activity has remained at high levels (Graph 2.14). Alterations and additions appear to have been less responsive to the cycle in new dwelling construction than in previous episodes”.

Turning to mortgage rates, they confirm that new loans tend to be at lower variable rates than the average for outstanding loans. Moreover, new IO borrowers continue to pay a premium above the interest rate on new principal-and-interest (P&I) home loans.

“The value of housing loan approvals (excluding refinancing) has continued to decline over recent months, to be 8 per cent below the recent peak in August 2017. This has been driven by investors, with owner-occupier approvals remaining relatively steady since mid 2017 (Graph 3.12). The decline in investor approvals has been  primarily concentrated in New South Wales”.
They reviewed interest only loans (again) and concluded that “Currently it appears that the share of borrowers who will not be able to afford higher P&I repayments and are not eligible to alleviate their situation by refinancing is small. Liaison with the banks suggests that there are a few borrowers needing assistance to manage the transition. Over the past year, some banks have reported in liaison that there has been a small deterioration in asset quality. For some borrowers this has tended to be only temporary as they take some time to adjust their financial affairs to cope with the rise in scheduled payments. For a small share of borrowers though, it reflects difficulty making these higher repayments. That share could increase in the event that an adverse shock led to a deterioration in overall economic conditions”.

The forecasts for domestic output growth are broadly similar to those presented in the February Statement. GDP growth is expected to strengthen a little over the next year or so as the drag from mining investment comes to an end and accommodative monetary policy provides ongoing support for sustained growth in household income and consumption, and non-mining business investment. However, the economy is not expected to encounter broad-based capacity constraints for some time.

“There is also uncertainty about how much any decline in spare capacity will build into wage pressures and inflation. Wages and employment growth are
key components of household income growth, and uncertainty about the outlook for household income growth translates into uncertainty about
household consumption and so GDP. Another key source of risk to consumption growth is that high levels of debt are likely to increase the
sensitivity of households’ consumption decisions to changes in their income or wealth.

Household indebtedness is high; and debt levels relative to income have edged higher because household credit growth has outpaced weak income growth over recent years. Steps taken by regulators to strengthen household balance sheets have led to a moderation in the growth in the riskier types of lending to households, but risks remain. Even if overall household indebtedness currently appears sustainable, a highly indebted household sector is likely to be more sensitive to changes in income, wealth or interest rates. For example, a highly indebted household facing weaker-than-expected growth in disposable income or wealth is more likely to respond by reducing consumption. Consumption growth may also be weaker for a time if indebted households choose to pay down debt more quickly rather than consume out of additional income.

Housing assets account for around 55 per cent of total household assets, so weaker housing prices could be a factor that leads to weaker consumption growth than is currently forecast. National housing prices have eased following several years of strong price growth. To date, the cooling of conditions in the established housing market does not appear to have dampened consumption growth. Although the earlier gains in national housing wealth may not have encouraged much additional consumption, it is possible that households’ consumption and saving decisions could be more sensitive to an easing in housing price growth.

Tighter lending standards could also affect the outlook for domestic growth. While APRA recently announced plans to remove the investor loan
benchmark, the change in dynamics in the housing market and the high level of public scrutiny of lending decisions could see some tightening in the
supply of credit. This could affect the outlook for consumption and dwelling investment”.

An Alternative Financial Narrative

Mark this date – 10th June 2018.  This is the date of the Swiss Federal referendum on the Sovereign Money Initiative (or “Vollgeld-Initiative” in German). Swiss voters will be asked who should be allowed to create new Swiss francs: UBS, Credit Suisse and other private commercial banks or the Swiss National Bank which is obliged to act in the interest of Switzerland as a whole.

This is the latest incarnation of the so-called Chicago Plan, which is an alternative proposal as to how banking, and central banking should be set up.

The ideas are not new, they emerged in the 1930’s, at the height of the Great Depression when a number of leading U.S. economists advanced a proposal for monetary reform that later became known as the Chicago Plan.

It envisaged the separation of the monetary and credit functions of the banking system, by requiring 100% reserve backing for deposits. Irving Fisher (1936) claimed the following advantages for this plan: (1) Much better control of a major source of business cycle fluctuations, sudden increases and contractions of bank credit and of the supply of bank-created money. (2) Complete elimination of bank runs. (3) Dramatic reduction of the (net) public debt. (4) Dramatic reduction of private debt, as money creation no longer requires simultaneous debt creation. It was supported by other luminaries such as Milton Friedman.

The ideas were brought to more recent attention following the release of an IMF paper – The Chicago Plan Revisited.  We discussed the report in an earlier blog.

As we discussed more recently, the classic theory of banking, that deposits lead to banks making loans is incorrect. In fact banks create loans from “thin air”, and have all but unlimited capacity to do so. As customers take the loans, and use them to buy things, or place into deposit, money is created. No other party needs to be involved. The trouble is, not many central bankers get this alternative view, so continue to execute flawed policies, such as Quantitative Easing, and ultra-low interest rates.  Banks  are intermediaries, not credit creators, they say; when in fact the create funds from nowhere. But this leads to problems as we see today.

But, be clear, when a loan is created, it does indeed generate new purchasing power.It becomes part of a self-fulling growth engine. But at what cost?

Understand that the only limit on the amount of credit is peoples ability to service the loans – eventually. The more loans the banks can make, the larger they become, and the more of the economy banks consume. This is what has happened in recent times. It leads to the financialisation of property, asset price inflation and massive and unsustainable increases in debt. The only way out is the inevitable crash, so we get a state of booms and busts.

Whilst there are some controls on the banks thanks to the Basel requirement to hold a certain proportion of liquid assets against the loans, but it is a fraction of the total loans made, and there is a multiplier effect which means that very little of the shareholders capital in the banks are required to support the loans. In other words, Banks are hugely leveraged. In addition, Basel capital rules favours unproductive lending for secured property (houses and apartments) over productive lending to businesses.

In addition, Central banks have very limited ability to control the money supply, contrary to popular belief, and so their main policy control is interest rates. Lift rates to slow the economy, drop rates to drive the economy harder, against a target inflation outcome.  But this is a very blunt tool. This also means that the idea of narrow money, spilling out from a multiplier effect is also flawed.

Well, now perhaps the tide is turning.

In the aftermath of the 2008 financial crisis, Iceland commissioned a report “Monetary Reform – A better monetary system for Iceland” which was  published in 2015, and suggests that money creation is too important to be left to bankers alone.

Back in 2014 I discussed this, based on an insight from the Bank of England.  Their Quarterly Bulletin (2014 Q1), was revolutionary and has the potential to rewrite economics. “Money Creation in the Modern Economy” turns things on their head, because rather than the normal assumption that money starts with deposits to banks, who lend them on at a turn, they argue that money is created mainly by commercial banks making loans; the demand for deposits follows. Rather than banks receiving deposits when households save and then lending them out, bank lending creates deposits.

More recently the Bank of Norway confirmed this, and said “The bank does not transfer the money from someone else’s bank account or from a vault full of money. The money lent to you by the bank has been created by the bank itself – out of nothing: fiat – let it become.”.

And even the arch conservative German Bundesbank said in 2017 recently “this means that banks can create book money just by making an accounting entry: according to the Bundesbank’s economists, “this refutes a popular misconception that banks act simply as intermediaries at the time of lending – ie that banks can only grant credit using funds placed with them previously as deposits by other customers“.

So, the Chicago Plan is a alternative approach. Here banks cannot lend by creating new deposits.

Rather, their loan portfolio now has to be backed by a combination of their own equity and non-monetary liabilities. If we assume that this funding is supplied exclusively by the government treasury, private agents are limited to holding either bank equity or monetary instruments that do not fund any lending. Under this funding scheme the government separately controls the aggregate volume of credit and the money supply. The transition to this new balance sheet conceptually takes place in two stages that both happen in a single transition period. In the first stage, banks instantaneously increase their reserve backing for deposits from 0% to 100%, by borrowing from the treasury. In the second stage, the government can independently control money and treasury credit. It exercises this ability by cancelling all government debt on banks’ balance sheets against treasury credit, and by transferring part of the remaining treasury credit claims against banks to constrained households and manufacturers, by way of restricted accounts that must be used to repay outstanding bank loans. This second stage leaves only investment loans outstanding, with money unchanged and treasury credit much reduced. Net interest charges from the previous period remain the responsibility of the respective borrowers.

Part of the transition plan would be the full buy-back of household debt by the government, making all households effectively debt free. This of course means that household consumption is likely to rise.

In the transition period households only pay the net interest charges on past debts incurred by constrained households to the banking sector. The principal is instantaneously cancelled against banks’ new borrowing from the treasury, after part of the latter has been transferred to the above-mentioned restricted private accounts and then applied to loan repayments. From that moment onward the household sector has zero net bank debt, while their financial assets consist of government bonds and deposits, the latter now being 100% reserve backed.

Now this approach to me has significant merit, and I believe it should be considered as a platform to deal with the current economic situation we face. This appears to be a better, if more radical approach than the so called Glass-Steagall separation of speculative banking assets from core banking operations, but which still perpetuates the current rocky banking road. The Chicago Plan offers significantly more benefits, and the opportunity to reset the economy, and household debt.

So, if the vote is successful on 10th June, the sovereign money bill would give the Swiss National Bank a monopoly on physical and electronic money creation, “while the decision concerning how new money is introduced into the economy would reside with the government,” says Vollgeld.

This also means that Central Banks have the ability to managed the overall money supply, rather than just narrow money and interest rates. And the flows of credit can go to productive business investment, rather than inflated housing loans.

So the bottom line is, The Chicago Plan deserves to go mainstream, despite the howls from bankers, as their businesses get rightsized. It can also deal with the problem of highly indebted households and offers a path potentially to economic success. Current models have failed, time to move on!


How does monetary policy affect the distribution of income and wealth?

From The BankUnderground.

The BankUndergound posted an interesting analysis of the impact of on households of their loose monetary policy.  Here is an extract, follow the link for the entire paper.

Although existing differences in income and wealth means that the impact in cash terms varied substantially between households, in a recent staff working paper we find that monetary policy had very little impact on relative measures of inequality. Compared to what would have otherwise happened, younger households are estimated to have benefited most from higher income in cash terms, while older households gained more from higher wealth.

Households tend to report that looser monetary policy has made them worse offIn contrast to our findings, the balance of households in the 2017H1 NMG Survey – a biannual survey of households commissioned by the Bank of England – felt that they had been made worse off by lower interest rates since 2008. Those negative responses were concentrated among older households (Chart 7). When asked about the channels through which they had been affected, most focused on the effects on their interest payments and receipts – where older households have tended to lose out – rather than on their wealth.

Conclusion

There has been growing interest in the effects of monetary policy on the distribution of income and wealth. We find that the gains from monetary easing were distributed roughly in line with initial income and wealth holdings. Because the percentage changes in income and wealth were similar across all distributions there was no large impact on inequality. If anything, those at the bottom end of the wealth distribution gained slightly more in percentage terms. Furthermore, most households are estimated to have been made better off than they otherwise would have been if policy had been left unchanged.

Bank Underground is a blog for Bank of England staff to share views that challenge – or support – prevailing policy orthodoxies. The views expressed here are those of the authors, and are not necessarily those of the Bank of England, or its policy committees.

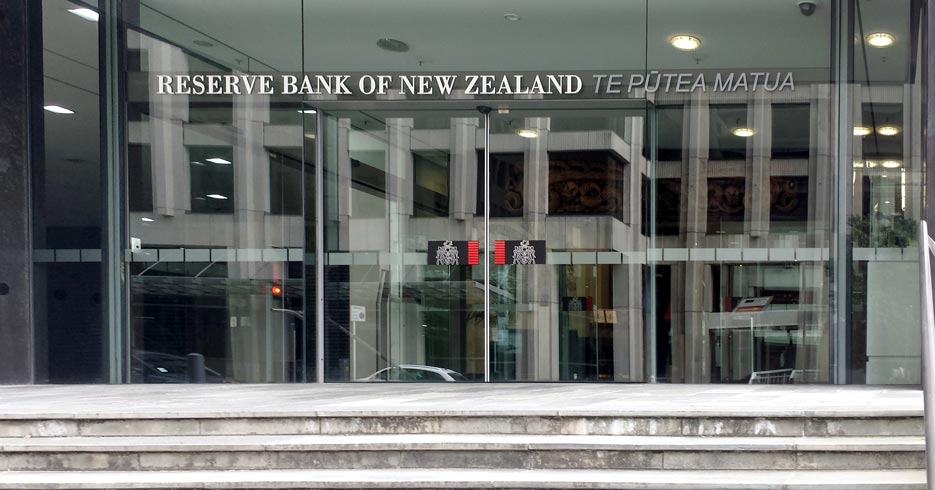
NZ Reserve Bank to consider employment alongside price stability mandate

The New Zealand Government’s New Policy Targets Agreement requires monetary policy to be conducted so that it contributes to supporting maximum levels of sustainable employment within the economy.

The new focus on employment outcomes is an outcome of Phase 1 of the Review of the Reserve Bank Act 1989, which the Coalition Government announced in November 2017.

“The Reserve Bank Act is nearly 30 years old. While the single focus on price stability has generally served New Zealand well, there have been significant changes to the New Zealand economy and to monetary policy practices since it was enacted,” Grant Robertson said.

“The importance of monetary policy as a tool to support the real, productive, economy has been evolving and will be recognised in New Zealand law by adding employment outcomes alongside price stability as a dual mandate for the Reserve Bank, as seen in countries like the United States, Australia and Norway.

“Work on legislation to codify a dual mandate is underway. In the meantime, the new PTA will ensure the conduct of monetary policy in maintaining price stability will also contribute to employment outcomes.”

A Bill will be introduced to Parliament in the coming months to implement Cabinet’s decisions on recommendations from Phase 1 of the Review. As well as legislating for the dual mandate, this will include the creation of a committee for monetary policy decisions.

“Currently, the Governor of the Reserve Bank has sole authority for monetary policy decisions under the Act. While clear institutional accountability was important for establishing the credibility of the inflation-targeting system when the Act was introduced, there has been greater recognition in recent decades of the benefits of committee decision-making structures,” Grant Robertson said.

“In practice, the Reserve Bank’s decision-making practices for monetary policy have adapted to reflect this, with an internal Governing Committee collectively making decisions on monetary policy. However, the Act has not been updated accordingly.”

The Government has agreed a range of five to seven voting members for a Monetary Policy Committee (MPC) for decision-making. The majority of members will be Reserve Bank internal staff, and a minority will be external members. The Reserve Bank Governor will be the chair.

“It is my intention that the first committee of seven members would have four internal, and three external members. Treasury will also have a non-voting observer on the MPC to provide information on fiscal policy,” Grant Robertson said.

The MPC is expected to begin operation in 2019 following passage of amending legislation. There will be a full Select Committee process for the legislation.

Reserve Bank Governor-Designate, Adrian Orr, said that the PTA recognises the importance of monetary policy to the wellbeing of all New Zealanders.

“The PTA appropriately retains the Reserve Bank’s focus on a price stability objective. The Bank’s annual consumer price inflation target remains at 1 to 3 percent, with the ongoing focus on the mid-point of 2 percent.

“Price stability offers enduring benefits for New Zealanders’ living standards, especially for those on low and fixed incomes. It guards against the erosion of the value of our money and savings, and the misallocation of investment.”

Mr Orr said that the PTA also recognises the role of monetary policy in contributing to supporting maximum sustainable employment, as will be captured formally in an amendment Bill in coming months.

“This PTA provides a bridge in that direction under the constraints of the current Act. The Reserve Bank’s flexible inflation targeting regime has long included employment and output variability in its deliberations on interest rate decisions. What this PTA does is make it an explicit expectation that the Bank accounts for that consideration transparently. Maximum sustainable employment is determined by a wide range of economic factors beyond monetary policy.”

Mr Orr said that he welcomes the intention to use a monetary policy committee decision-making group, including both Bank staff and a minority of external members.

“Legislating for this committee will give a strong basis for the Bank’s use of a committee decision-making process. Widening the committee to include external members also brings the benefit of diversity and challenge in our thinking, while enhancing the transparency of decision-making and flow of information.”

Phase 2 of the Review is being scoped. It will focus on the Reserve Bank’s financial stability role and broader governance reform. Announcements on the final scope will be made by mid-2018 and subsequent policy work will commence in the second half of 2018.

Unconventional Monetary Policies And Persistently Low Interest Rates

A working paper from the BIS – “Effectiveness of unconventional monetary policies in a low interest rate environment” examines the connection between low interest rates and unconventional monetary policy, and their findings suggest the “neutral” rate is likely to rise much faster than many are currently expecting, with significant potential economic impact. Indeed, Central Banks are “behind the curve” and that the assumed lower “neutral interest rate may in fact be wrong.

A reliance on balance sheet tools can, for example, result in resource misallocations, disruptive risk-taking behaviour and political economy challenges. These costs, among others, would have to be weighed against the benefits when considering the appropriate role for central bank balance sheets in the new normal era as well as in future crisis periods.

They suggest that unconventional monetary policies (UMPs) became less effective in the post-GFC period, but not for the reasons typically given. The explanation is nuanced and emerges from careful assessment of the various links in the monetary transmission mechanism.

Post the GFC, major central banks in advanced economies cut policy rates sharply and, then when the room for manoeuvre closed, resorting to a range of unconventional monetary policies (UMPs) that exploited the financial firepower of central bank balance sheets. The lacklustre recovery that followed has naturally raised questions about the effectiveness of these new tools. This paper uses extensive modelling to investigate the links, and the results are troubling.  Not least, they  find evidence supporting the hypothesis that the economy did not become less interest-sensitive in the aftermath of the GFC, once changes in the “natural” rate of interest are taken into account. They conclude that UMPs had a declining impact on economies over time. Looking forward, the results suggest that the normalisation of balance sheet policies could be accompanied by an increase in the conventionally estimated “natural” rate, which if not taken into account would increase the risk that central banks will find themselves falling behind the curve.

They conclude:

We find that unconventional monetary policies were effective in providing some stimulus to economies at the perceived lower bound for policy rates. The responsiveness of the economy to private sector interest rates remained remarkably stable in our sample. However, it must also be noted that the overall effectiveness fell for two key reasons. First, the “bang for the buck” of central bank balance sheet stimulus declined over time. Larger and larger programmes were necessary to achieve a given change in sovereign yields. Second, the “natural” rate tended to decline with (unexpected) expansionary unconventional monetary policies. This suggests that monetary policy decisions have influenced the perceived “natural” rate, contrary to what is implied by the conventional wisdom. This correlation may also help to explain why monetary policy appears to have had been less stimulative than expected in the past decade, and may indicate that monetary policy could prove to be more stimulative than expected during the normalisation with no change in the conventional wisdom.

Note: BIS Working Papers are written by members of the Monetary and Economic Department of the Bank for International Settlements, and from time to time by other economists, and are published by the Bank. The papers are on subjects of topical interest and are technical in character. The views expressed in them are those of their authors and not necessarily the views of the BIS.

Why Are Interest Rates So Low? – Blame Central Banks

Current statements from central bankers around the world argue that current low real interest rates reflect a change in the “neutral” rate, and is linked to demographic shifts, investment patterns and globalisation.  In other words, monetary policy is NOT to blame – they are simply reacting.

However, an interesting (and complex) working paper Why so low for so long? A long-term view of real interest rates?  from the Bank for International Settlement raises serious questions about the assumption which Central Banks are working with. In fact, their analysis suggests that monetary policy is the cause of the low rates, not a reaction to them and this has long range impact. This turns current thinking on its head. Central Bankers policy have driven rates lower!

Global real (inflation-adjusted) interest rates, short and long, have been on a downward trend throughout much of the past 30 years and have remained exceptionally low since the Great Financial Crisis (GFC). This has triggered a debate about the reasons for the decline. Invariably, the presumption is that the evolution of real interest rates reflects changes in underlying saving-investment determinants. These are seen to govern variations in some notional “equilibrium” or natural real rate, defined as the real interest rate that would prevail when actual output equals potential output, towards which market rates gravitate.

Prevailing explanations of the decline in real interest rates since the early 1980s are premised on the notion that real interest rates are driven by variations in desired saving and investment.

But based on data stretching back to 1870 for 19 countries, our systematic analysis casts doubt on this view. The link between real interest rates and saving-investment determinants appears tenuous. While it is possible to find some relationships consistent with the theory in some periods, particularly over the last 30 years, they do not survive over the extended sample. This holds both at the national and global level. By contrast, we find evidence that persistent shifts in real interest rates coincide with changes in monetary regimes. Moreover, external influences on countries’ real interest rates appear to reflect idiosyncratic variations in interest rates of countries that dominate global monetary and financial conditions rather than common movements in global saving and investment. All this points to an underrated role of monetary policy in determining real interest rates over long horizons.

Overall, our results raise questions about the prevailing paradigm of real interest rate determination. The saving-investment framework may not serve as a reliable guide for understanding real interest rate developments. And inflation may not be a sufficiently reliable signal of where real interest rates are relative to some unobserved natural level. Monetary policy, and financial factors more generally, may have an important bearing on persistent movements in real interest rates.

Note: BIS Working Papers are written by members of the Monetary and Economic Department of the Bank for International Settlements, and from time to time by other economists, and are published by the Bank. The papers are on subjects of topical interest and are technical in character. The views expressed in them are those of their authors and not necessarily the views of the BIS.


Can Gradual Interest-Rate Tightening Prevent a Bust?

From The Mises Institute.

The boom brought about by the banks’ policy of extending credit must necessarily end sooner or later. Unless they are willing to let their policy completely destroy the monetary and credit system, the banks themselves must cut it short before the catastrophe occurs. The longer the period of credit expansion and the longer the banks delay in changing their policy, the worse will be the consequences of the malinvestments and of the inordinate speculation characterizing the boom; and as a result the longer will be the period of depression and the more uncertain the date of recovery and return to normal economic activity

Fed policy makers are of the view that if there is the need to tighten the interest rate stance the tightening should be gradual as to not destabilize the economy.

The gradual approach gives individuals plenty of time to adjust to the tighter monetary stance. This adjustment in turn will neutralize the possible harmful effect that such a tighter stance may have on the economy.

But is it possible by means of a gradual monetary policy to undo the damage inflicted to the economy by previous loose monetary policies? According to mainstream economic thinking, it would appear that this is the case.

In his various writings, the champion of the monetarist school of thinking, Milton Friedman, has argued that there is a variable lag between changes in money supply and its effect on real output and prices. Friedman holds that in the short run changes in money supply will be followed by changes in real output. In the long run, according to Friedman, changes in money will only have an effect on prices.

It follows then that changes in money with respect to real economic activity tend to be neutral in the long run and non-neutral in the short run. Thus according to Friedman,

In the short-run, which may be as much as five or ten years, monetary changes affect primarily output. Over decades, on the other hand, the rate of monetary growth affects primarily prices.1

According to Friedman, the effect of the change in money supply shows up first in output and hardly at all in prices. It is only after a longer time lag that changes in money start to have an effect on prices. This is the reason, according to Friedman, why in the short run money can grow the economy, while in the long run it has no effect on the real output.

According to Friedman, the main reason for the non-neutrality of money in the short run is the variability in the time lag between money and the economy. Consequently, he believes that if the central bank were to follow a constant money rate of growth rule this would eliminate fluctuations caused by variable changes in the money supply rate of growth. The constant money growth rule could also make money neutral in the short run and the only effect that money would have is on general prices.

Thus according to Friedman,

On the average, there is a close relation between changes in the quantity of money and the subsequent course of national income. But economic policy must deal with the individual case, not the average. In any case, there is much slippage. It is precisely this leeway, this looseness in the relation, this lack of mechanical one-to-one correspondence between changes in money and in income that is the primary reason why I have long favoured for the USA a quasi-automatic monetary policy under which the quantity of money would grow at a steady rate of 4 or 5 per cent per year, month-in, month-out.2

In his Nobel lecture, Robert Lucas raised an issue with this. According to Lucas,

If everyone understands that prices will ultimately increase in proportion to the increase in money, what force stops this from happening right away?3

Consequently, Lucas has suggested that the reason why money does generate a real effect in the short run is not so much due to the variability of monetary time lags but more bound up with whether money changes were anticipated or not. If monetary growth anticipated, then people will adjust to it rather quickly and there will not be any real effect on the economy. Only unanticipated monetary expansion can stimulate production.

Moreover, according to Lucas,

Unanticipated monetary expansions, on the other hand, can stimulate production as, symmetrically, unanticipated contractions can induce depression.4

Both Friedman and Lucas are of the view, although for slightly different reasons, that it is desirable to make money neutral in order to avoid unstable and therefore unsustainable economic growth.

The current practice of Fed policy makers seems to incorporate the ideas of Friedman and Lucas into the so-called transparent monetary policy framework. This framework accepts Lucas’s view that anticipated monetary policy could lead to stable economic growth. This framework also accepts that a gradual change in monetary policy in the spirit of Friedman’s constant money growth rule could reinforce the transparency.

If unexpected monetary policies can cause real economic growth, what is wrong with this? Why not constantly surprise people and cause more real wealth?

Money, Expectations and Economic Growth

What is required for economic growth is a growing pool of real savings, which funds various individuals that are engaged in the build-up of capital goods. An increase in money, however, has nothing to do, as such, with this. On the contrary this increase only leads to consumption that is not supported by production of real wealth. Consequently, this leads to a weakening in the real pool of savings, which in turn undermines real economic growth. All that printing money can achieve is a redirection of real savings from wealth generating activities towards non-productive wealth consuming activities. So obviously, there cannot be any economic growth because of this redirection.

Now if unanticipated monetary growth undermines real economic growth via the dilution of the pool of real savings why is it then that one observes that rising money is associated with a rise in economic indicators like real GDP?

We suggest that all that we observe in reality is an increase in monetary spending — this is what GDP depicts. The more money that is printed, the higher GDP will be. So-called real GDP is merely nominal GDP deflated by a meaningless price index. Hence, so-called observed economic growth is just the reflection of monetary expansion and has nothing to do with real economic growth. Incidentally, real economic growth cannot be measured as such — it is not possible to establish a meaningful total by adding potatoes and tomatoes.

While unanticipated monetary growth cannot grow the economy, it definitely produces a real effect by undermining the pool of real savings and thereby weakening the real economy.

Likewise anticipated money growth cannot be harmless to the real economy. Even if the money rate of growth is fully anticipated there is always someone who gets it first. Consequently, also anticipated money growth rate will set in motion an exchange of nothing for something.

For instance, consider the individual who fully expects the future course of monetary policy. This individual now decides to borrow $1000 from a bank. The bank obliges and lends him the $1000, which the bank has created out of “thin air”. Now, since this money is unbacked by any previous production of real wealth it will set in motion an exchange of nothing for something, or a redirection of real savings from wealth generators towards the borrower of the newly created $1000. This redirection and hence real negative effect on the pool of savings cannot be prevented by an individuals’ correct expectation of monetary policies.

Even if the money is pumped in such a way that everybody gets it instantaneously, changes in the demand for money will vary. After all, every individual is different from other individuals. There will always be somebody who will spend the newly received money before somebody else. This of course will lead to the redirection of real wealth to the first spender from the last spender.

We can thus conclude that regardless of expectations, loose monetary policy will always undermine the foundations of the real economy while tight monetary policy will work to arrest this process. Hence monetary policy can never be neutral.

Can a Gradual Tightening Prevent an Economic Bust?

Since monetary growth, whether expected or unexpected, gives rise to the redirection of real savings it means that any monetary tightening slows down this redirection. Various economic activities, which sprang-up on the back of strong monetary pumping, because of a tighter monetary stance get now less real funding. This in turn means that these activities are given less support and run the risk of being liquidated. It is the liquidation of these activities what an economic bust is all about.

Obviously, then, the tighter monetary stance by the Fed must put pressure on various false activities, or various artificial forms of life. Hence, the tighter the Fed gets the slower the pace of redirection of real savings will be, which in turn means that more liquidation of various false activities will take place. In the words of Ludwig von Mises,

The boom brought about by the banks’ policy of extending credit must necessarily end sooner or later. Unless they are willing to let their policy completely destroy the monetary and credit system, the banks themselves must cut it short before the catastrophe occurs. The longer the period of credit expansion and the longer the banks delay in changing their policy, the worse will be the consequences of the malinvestments and of the inordinate speculation characterizing the boom; and as a result the longer will be the period of depression and the more uncertain the date of recovery and return to normal economic activity.5

Consequently, the view that the Fed can lift interest rates without any disruption doesn’t hold water. Obviously if the pool of real savings is still expanding then this may mitigate the severity of the bust. However, given the reckless monetary policies of the US central bank it is quite likely that the US economy may already has a stagnant or perhaps a declining pool of real savings. This in turn runs the risk of the US economy falling into a severe economic slump.

We can thus conclude that the popular view that gradual transparent monetary policies will allow the Fed to tighten its stance without any disruptions is based on erroneous ideas. There is no such thing as a “shock-free” monetary policy any more than a monetary expansion can ever be truly neutral to the market.

Regardless of policy transparency once a tighter monetary stance is introduced, it sets in motion an economic bust. The severity of the bust is conditioned by the length and magnitude of the previous loose monetary stance and the state of the pool of real savings.


1. Milton Friedman The Counter-Revolution in Monetary Theory. Occasional Paper 33, Institute of Economic Affairs for the Wincott Foundation. London: Tonbridge, 1970.

2. Milton Friedman The Counter-Revolution in Monetary Theory

3. Robert E. Lucas, Jr Nobel Lecture:Monetary Neutrality, Journal of Political Economy, 1996, vol. 104,no. 4

4. Ibid.

5. Ludwig von Mises, The “Austrian” Theory of the Trade Cycle. The Ludwig von Mises Institute 1983.


Does past inflation predict the future?

Interesting Analytical Note from the Reserve Bank New Zealand. They have recently changed their modelling of inflation, preferring to use past data rather than a two year prediction because despite low unemployment, inflation has remained lower than would be expected on the old method. This suggests monetary policy needs to be more stimulatory than expected .

Forecasts of non-tradables inflation have been produced using Phillips curves, where capacity pressure and inflation expectations have been the key drivers. The Bank had previously used the survey of 2-year ahead inflation expectations in its Phillips curve. However, from 2014 non-tradables inflation was weaker than the survey and estimates of capacity pressure suggested. Bank research indicated the weakness in non-tradables inflation may have been linked to low past inflation and its impact on pricing behaviour.

This note evaluates whether measures of past inflation could have been used to produce forecasts of inflation that would have been more accurate than using surveys of inflation expectations. It does this by comparing forecasts for annual non-tradables inflation one year ahead. Forecasts are produced using Phillips curves that incorporate measures of past inflation or surveys of inflation expectations, and other information available at the time of each Monetary Policy Statement (MPS). This empirical test aims to determine the approach that captures pricing behaviour best, highlighting which may be best for forecasting going forward.

The results show that forecasts constructed using measures of past inflation have been more accurate than using survey measures of inflation expectations, including the 2-year ahead survey measure previously used by the Bank. In addition, forecasts constructed using measures of past inflation would have been significantly more accurate than the Bank’s MPS forecasts since 2009, and only slightly worse than these forecasts before the global financial crisis (GFC). The consistency of forecasts using past-inflation measures reduces the concern that this approach is only accurate when inflation is low, and suggests it may be a reasonable approach to forecasting non-tradables inflation generally.

From late 2015, the Bank has assumed that past inflation has affected domestic price-setting behaviour more than previously. As a result, monetary policy has needed to be more stimulatory than would otherwise be the case. This price-setting behaviour is assumed to persist, and is consistent with subdued non-tradables inflation and low nominal wage inflation in 2017.

Figure 6 shows the average 1-year ahead forecast of non-tradables inflation for the measures of past inflation and surveys of inflation expectations. The range of forecasts produced by the models is currently large relative to history, perhaps reflecting differences between the surveys of inflation expectations and measures of past inflation. The two most accurate measures (shown by the red lines) suggest non-tradables inflation will be between 2.5 and 3 percent in 2018 – similar to the forecast in the August 2017 MPS and only a little higher than the latest outturn of 2.4 percent in the June quarter 2017.

Conclusion

Non-tradable inflation has been surprisingly weak since 2014. Phillips curves with the survey of 2-year ahead inflation expectations suggest non-tradables inflation should have risen by more than we have seen, given the level of the unemployment rate and the Bank’s estimates of the output gap. This note shows that using measures of past CPI inflation instead of surveyed inflation expectations would have produced more accurate forecasts of non-tradables inflation, although not all of the weakness in non-tradables inflation would have been predicted.

The Bank has adjusted its forecasting models to better capture the role of past inflation, moving away from using the survey of 2-year ahead inflation expectations to underpin its forecasts

The Analytical Note series encompasses a range of types of background papers prepared by Reserve Bank staff. Unless otherwise stated, views expressed are those of the authors, and do not necessarily represent the views of the Reserve Bank.