Credit Card Lending Portfolio Data to May 2014

Continuing our analysis of the APRA monthly banking statistics, today we execute a deeper dive into the credit card portfolios. The $40.5 billion portfolio is relatively static, fluctuating by about $200m in recent months. As we highlighted, previously, CBA has the biggest share, and Citigroup is the 5th largest player.

ADIMay2014CardsTrends1We can show the relative share trends as a percentage of total book. CBA has 28% of the market, and Westpac 23% – together holding more than half the market. Macquarie is a small, but growing player, as we will see in a moment. Citigroup’s share dropped just a little.

ADIMay2014CardsTrends3So. lets look at the changes in more detail. Here are the movements by percentage change of individual portfolios. Thanks to Macquarie’s acquisition of HSBC’s Woolworths white label credit card portfolio for $362 million in May, we see a significant swing away from HSBC, to Macquarie, who more than doubled their portfolio in the transaction. HSBC released a statement saying it was still committed to the Australian market, but the Woolworth agreement would terminate, although they would continue to provide card services through to 2015.

ADIMay2014CardsTrends2Looking at the data another way, in portfolio dollar terms, we see CBA growing a little, whilst nab, ANZ and Citigroup fell in May. The Macquarie transaction also shows up clearly. Overall in May the total across all banks fell just over $200 million.

ADIMay2014CardsTrends4So, we see household card debit is quite constrained at the moment. We also see Macquarie extending its reach across retail banking, including mortgage lending, and credit cards.

Home Lending Portfolio Analysis To May 2014

Following on for our analysis of the APRA monthly banking statistics, today we explore some of the detail in the home loan statistics. The data shows the net monthly movement by lending institution, split by owner occupation and investment lending. We dropped a few of the smallest players from the data to make the picture clearer. We see some interesting segmental trends. First, lets look at the major changes amongst the main lenders between April and May. The most significant element relates to the CBA portfolio where there appears to be a big swing to investment lending (is this changes in policy, or a data coding issue?). Westpac continues to grow its investment portfolio so, We think CBA may be hunting investment loans more aggressively, but its a big monthly swing.

ADIMay2014Trends2Now looking at the loan portfolios from January to May, we see again Westpac leading the investment lending, and we see CBA’s uptick in May, offset by a fall in owner occupation lending.

ADIMay2014Trends1Another way to look at the data is by percentage movement, this view shows the change at the portfolio level, the sum of investment and owner occupied loans. It is worth highlighting the Macquarie Bank growth,  much higher than system growth. Bendigo had quite a spike, and AMP had a bad March. What we do not know is how much is a data problem, and how much is a real response to business strategy and execution.

ADIMay2014Trends3We can also split the data by loan type. This the owner occupation trend, note that at a marker level, it fell slightly overall in May. We see the fall at CBA in May, the spike at Bendigo, the consistent growth at Macquarie and the AMP hiccup.

ADIMay2014Trends4Turning to the Investment Loan portfolio, the CBA spike shows clearly, the Macquarie Bank growth spurt, the growth at Members Equity, and strong overall spike in investment lending.

ADIMay2014Trends5We should await the next months data, because the CBA data movements would mask, or change the outcomes. Our own data suggest investment lending is not as strong as suggested by the APRA data.

APRA Reports ADI Housing Lending Is Up In May To $1.25 trillion

Alongside the RBA data, APRA released the latest monthly banking statistics for May, covering the Authorised Deposit Institutions (=Banks). Total housing loans was reported at $1.25 trillion, up from $1.245 trillion in April. The RBA number, which we reported already, was $1.36 trillion, the difference is the non-bank sector, at around $110 billion, around the same as last month.

Looking at the detail in the APRA data, we look first at housing lending. The big four maintain their market leading positions, with CBA the largest home loan lender.

ADIMay2014HousingLooking at the relative share of owner occupied to investment home loan lending, whilst some of the smaller players lend a greater proportion, Westpac is slightly behind Bank of Queensland, but the largest lender with the greatest proportion of investment loans. Nab has the lowest share of investment loans amongst the four majors.

ADIMay2014HousingRatioTurning to Securitisation, Members Equity leads out, with Bendigo, Westpac and AMP following.

ADIMay2014SecuritisationLooking at Credit Cards, CBA is in first place, with Citigroup in fifth.

ADIMay2014CreditCardsIn the business bank area, National Australia Bank is the largest business bank, with CBA following. The bulk of the lending is to the non financial corporation sectors.

ADIMay2014BusinessFinally here is a snapshot of total lending, showing that CBA is the largest lender.

ADIMay2014AllOn the deposit side of the equation, CBA also leads the share of total deposits.

ADIMay2014DepositsLooking specifically at household deposits, CBA leads the banks, with nab in fourth place, behind ANZ.

ADIMay2014Household-Deposits

Housing Lending Up, Again, in May – RBA

The RBA released their financial aggregates for May 2014 today. Housing lending now totals $1.36 trillion, up by $7.2 billion, a growth rate of 0.5% in the month, and 6.2% in the past 12 months. Investment lending grew at 0.8% in May, whilst owner occupied loans grew at 0.4%.

RBAMay2014HousingTypeInvestment lending is growing faster, at 8.3% compared with 5.2% for owner occupation over 12 months. These are all seasonally adjusted numbers.

RBAMay2014HousingTrendPersonal credit fell again, by 0.3% in the month, giving an annual rate of 0.3%, and business lending grew 0.2%, giving and annual rate of 2.7%. So, the focus on lending for housing continues.

Housing Finance Was Highest Ever In April

Continuing our analysis of the ABS April 2014 lending data, it is worth looking at the overall housing finance data. Total lent, including owner occupied and investment secured lending, refinance, and unsecured was $28.3 billion, a record. The previous highest was $28.0 billion in February (both figures are seasonally adjusted).

April14HousingLendingLooking at the percentage splits, in April, 33% went to secured finance of existing dwellings, 32.5% on investment housing by individuals, 17.3% on refinancing and 6.1% on finance for owner occupied construction. On the investment side, 3.4% went to investment housing purchases by other entities, including companies and self-managed superannuation, and 2.86% went to investment housing construction.

April14HousingLendingTypeThe long term percentage mix from 2000 onwards shows the inroads investment lending is making into the overall portfolio.

April14HousingLendingTypePCFrom2000We can also show this by looking at the percentage relating to investment lending as a percentage of all housing lending, currently at 38.8%. This is a high.

April14InvestmentTrendWe still hold the view the current policy settings are wrong. Too much lending is pouring into an inflated housing sector. Interest rates are too low. The banks are lending too freely, and benefiting from inflated balance sheets and profits as a result. Households have more debt than everThe IMF is right.

Commercial Lending Outstrips Housing Growth In April

The ABS released their Lending data for April 2014. In the last month, commercial lending was up 5.8% seasonally adjusted, to $43,802 million whilst housing finance was up 1.4% to $16,911 million. Personal finance and lease finance were both down. This data presents the monthly flows.

April14LendingAcross the sectors, ABS reports:

HOUSING FINANCE FOR OWNER OCCUPATION –  The total value of owner occupied housing commitments excluding alterations and additions rose 0.4% in trend terms, and the seasonally adjusted series rose 1.4%.

PERSONAL FINANCE –  The trend series for the value of total personal finance commitments fell 0.3%. Revolving credit commitments fell 0.5% and fixed lending commitments fell 0.2%.  The seasonally adjusted series for the value of total personal finance commitments fell 2.2%. Revolving credit commitments fell 3.3% and fixed lending commitments fell 1.4%.

COMMERCIAL FINANCE – The trend series for the value of total commercial finance commitments rose 2.0%. Revolving credit commitments rose 3.3% and fixed lending commitments rose 1.6%. The seasonally adjusted series for the value of total commercial finance commitments rose 5.8% in April 2014, following a rise of 3.9% in March 2014. Fixed lending commitments rose 6.3%, following a rise of 1.6% in the previous month. Revolving credit commitments rose 4.3%, following a rise of 11.4% in the previous month.

LEASE FINANCE – The trend series for the value of total lease finance commitments fell 1.0% and the seasonally adjusted series fell 20.3%, after a rise of 7.5% in March 2014.


Investment Loans Break More Records In April

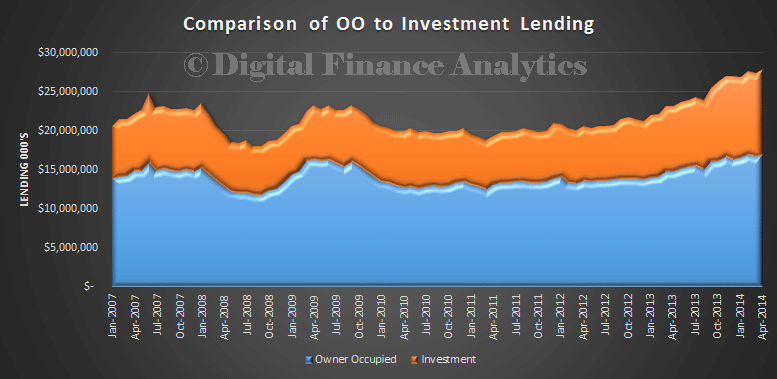
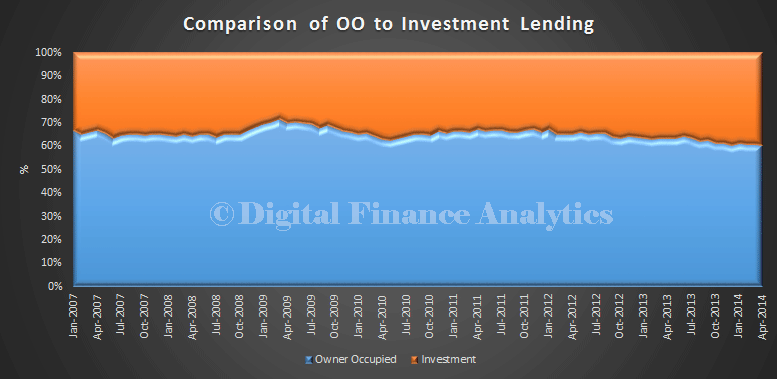
The ABS published their housing finance data for April 2014. It is slightly below expectations, but the most significant element is the further rise in investor lending, which accounted for $10.9bn, or 39.4% of loans written. The highest ever was in December 2013, when Investment loans reached 39.6%.

According to the ABS, the trend estimate for the total value of dwelling finance commitments excluding alterations and additions rose 0.4%. Investment housing commitments rose 0.5% and owner occupied housing commitments rose 0.4%. In seasonally adjusted terms, the total value of dwelling finance commitments excluding alterations and additions rose 1.7%. In trend terms, the number of commitments for owner occupied housing finance rose 0.1%, the number of commitments for the construction of dwellings rose 1.1% and the number of commitments for the purchase of established dwellings rose 0.1%, while the number of commitments for the purchase of new dwellings fell 1.3%.

OO-and-Inv-April-2014

OO-and-Inv-PC-April-2014
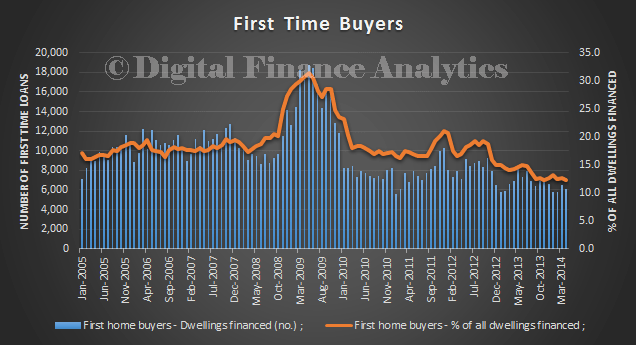
In original terms, the number of first home buyer commitments as a percentage of total owner occupied housing finance commitments fell to 12.3% in April 2014 from 12.6% in March 2014. This trend continues to show that first time buyers are unable or unwilling to enter the market. We will be publishing some of our recent survey results soon which will show affordability is the main factor preventing them entering the market.

First-Time-April-2014