RBA Data Confirms Home Lending Up – To $1.584 Trillion

The latest RBA credit aggregates to end August 2016, shows that total credit grew again, thanks to higher home lending, which reached a new record of $1.584 trillion.  A further $1 billion of loans were reclassified between between owner occupied and investment loans, making $44 billion in total, or 2.8% of all loans.

Seasonally adjusted owner occupied loans grew 0.62% or $6.3 billion, whilst investment lending grew $1.5 billion or $0.27%. Investment loans comprise 34.98% of all home lending, down from a high of 38.6% in June 2015. Business lending went sideways, dropping to 33.2% of all lending, continuing its drift downwards – not a good sign for real future growth. Other personal credit fell slightly.

rba-aggregates-aug-2016-allThe 12 month growth analysis shows owner occupied loans sitting at 7.6%, investment loans 4.6%, total housing at 6.5% and business lending at 5.7%.  All higher than inflation and income growth. Australia is living with ever higher debt.

rba-aggregates-aug-2016The RBA says:

Following the introduction of an interest rate differential between housing loans to investors and owner-occupiers in mid-2015, a number of borrowers have changed the purpose of their existing loan; the net value of switching of loan purpose from investor to owner-occupier is estimated to have been $44 billion over the period of July 2015 to August 2016, of which $1.0 billion occurred in August 2016. These changes are reflected in the level of owner-occupier and investor credit outstanding. However, growth rates for these series have been adjusted to remove the effect of loan purpose changes.

Home Lending Continues Higher

The latest APRA monthly banking stats to end August 2016 shows that total lending for housing rose 0.53%, equivalent to an annualised rate of 6.41%, well ahead of inflation and wage growth.  Total loans are now $1.487 trillion, up another $7.9 billion in the month.

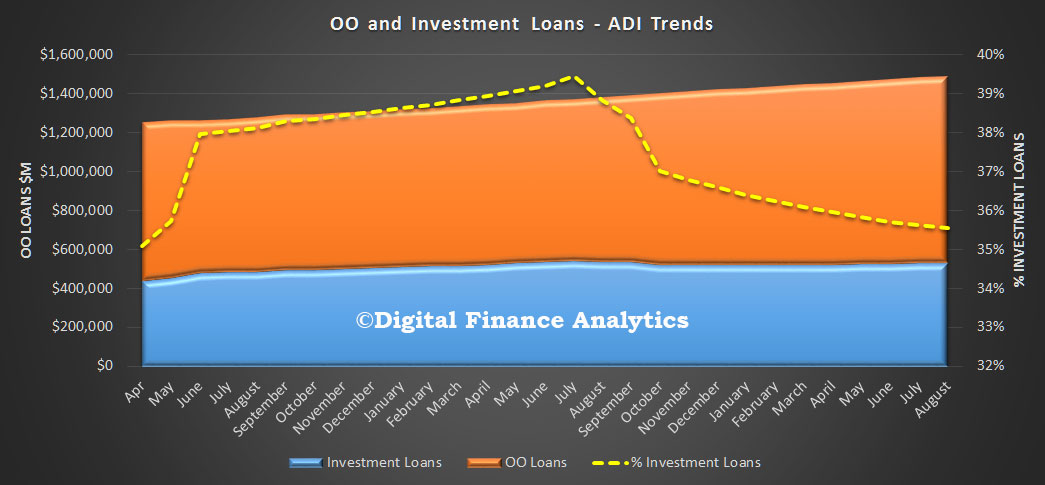
apra-august-2016-trendsWithin that, owner occupied loans rose 0.63% (up $6bn) and investment loans rose 0.35% (up $1.8bn). Investment loans comprise 35.55% of loans on book, down just a little from last month.

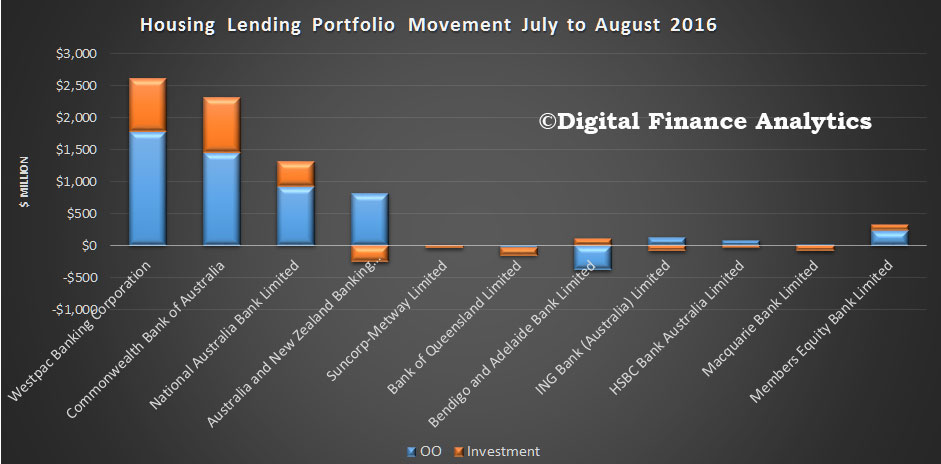
apra-august-2016-trendsLooking at the individual banks, Westpac grew their portfolio the largest, up $2.5 billion, followed by CBA. ANZ reduced their investment portfolio – perhaps thanks to restatement of loan purpose? Bendigo dropped their portfolio of owner occupied loans in the month.

apra-august-2016-mon-movementsHere are the current relative shares.

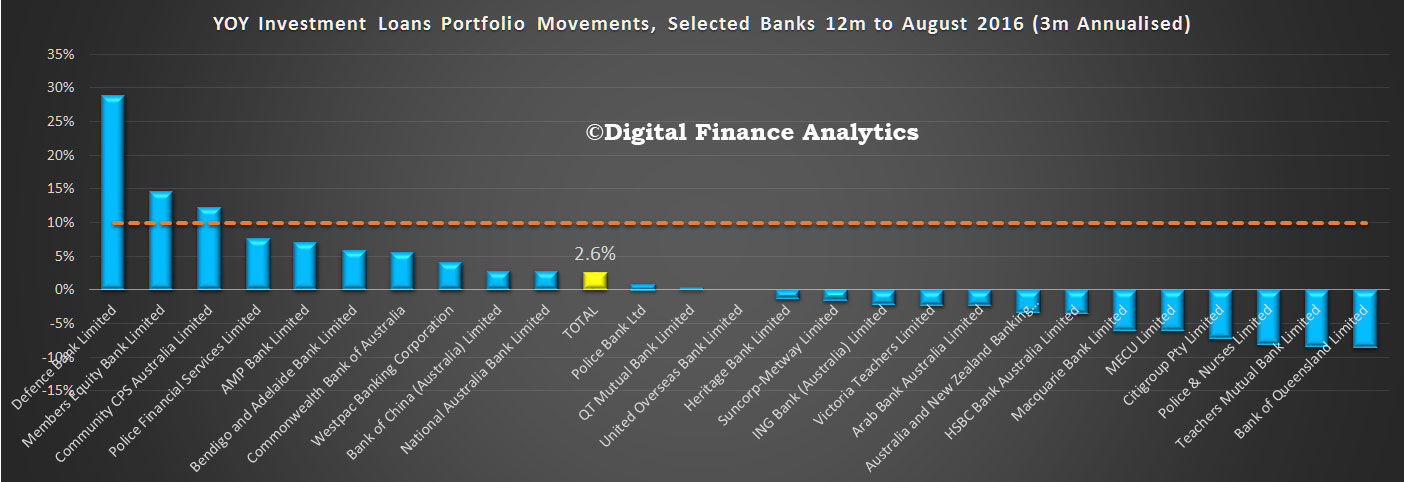
apra-august-2016-sharesFinally, here is the investment growth, by lender, which is running on a 3 month annualised basis at 2.6%. We see some of the majors growing their investment loans faster than system but below the theoretical 10% speed limit, which has little use currently. A couple of players are running well over however.

apra-august-2016-inv-hurdletrends   The RBA data, out soon will tell use more about the overall portfolio, including non-banks, and also about the restatement adjustments.

Home Lending Higher In July 2016, But Slowing

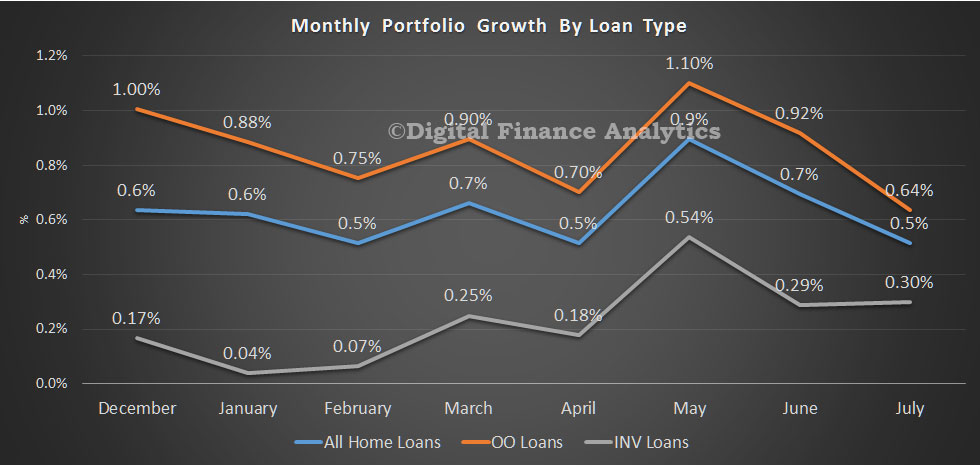
The latest monthly banking stats from APRA shows that total lending for home loans by the ADI’s (banks, building societies, credit unions etc.) rose 0.5% in July, down slightly from the previous month. Within that loans for owner occupied loans rose 0.64% to reach $952.5 billion, and investment lending rose 0.3% to $527 billion. Loans for investment property now comprise 35.6% of outstanding loans. So the rate of loan growth is slowing, but the overall level of household debt continues to rise and investment loans are back in favour. Remember too that these numbers are still messed up with ongoing loan reclassification with $43 billion over the period of July 2015 to July 2016, of which $1.0 billion occurred in July.

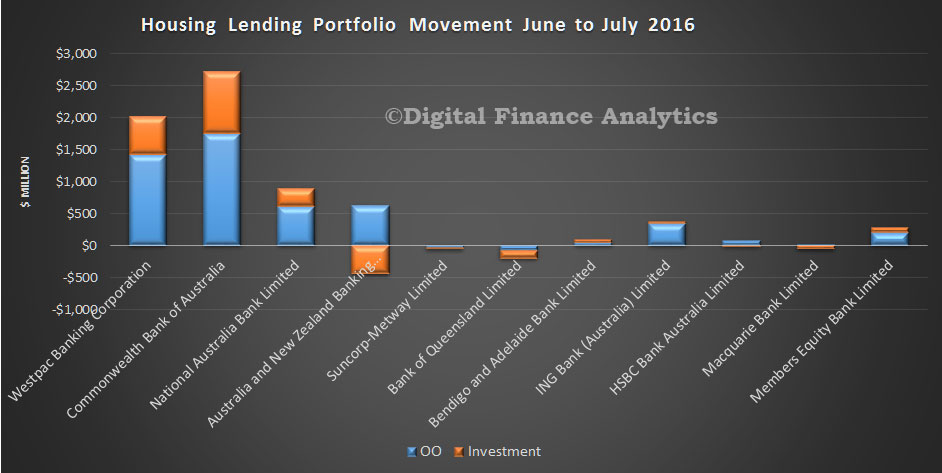
APRA-July-2016-ADI-Mon-PC-MoveLooking at individual lender movements, CBA lent more on both the owner occupied and investment side of the ledger.

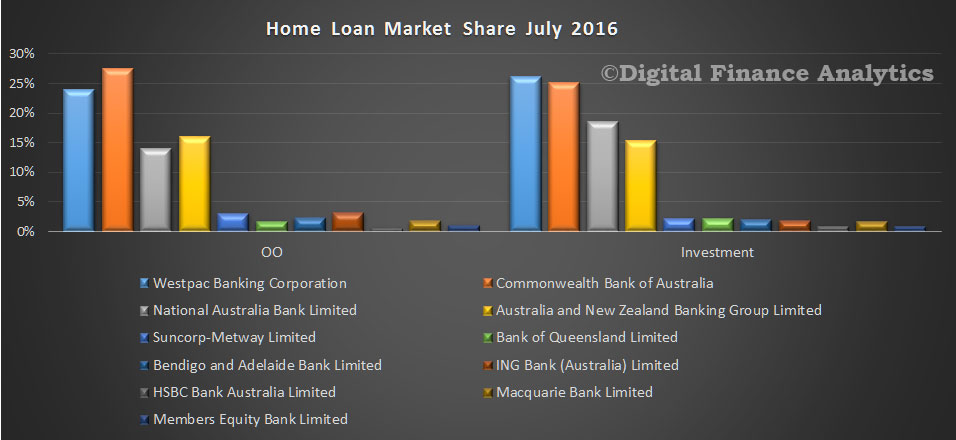
APRA-July-2016-ADI-HL-MoveAs a result we see CBA lifting its market share, though Westpac still has a greater share of investment loans.

APRA-July-2016-ADI-HL-ShareIf we examine the relative growth of loan portfolios against the APRA 10% speed limit, most major players remain within the 10% target.

APRA-July-2016-ADI-TrendWe will look at the RBA financial aggregates next, which gives us the view of all loans across the market, including the non-bank sector.


Banks Are Still Chasing Home Loans

The latest data from APRA on the loan books of the banks shows that in June 2016, housing loans grew by $10.1 billion to $1,471 billion, up 0.69%. Owner occupied loans grew by $8.6 billion and investment loans by $1.5 billion.

Looking at the individual banks, CBA maintains its first place position with owner occupied loans, Westpac, first place on investment loans.

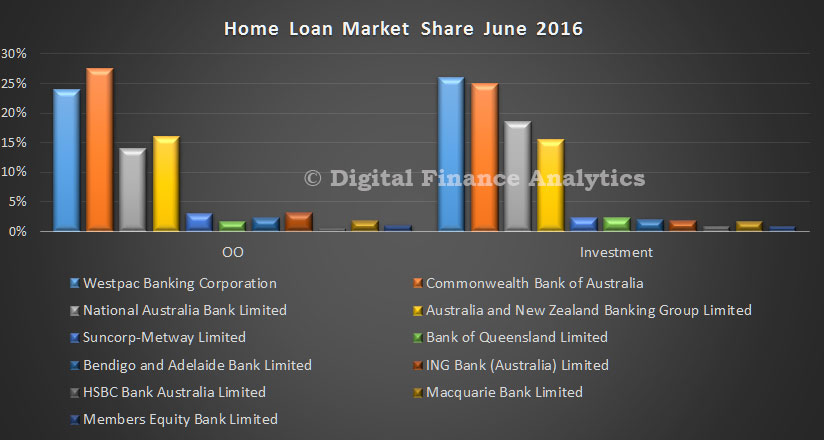
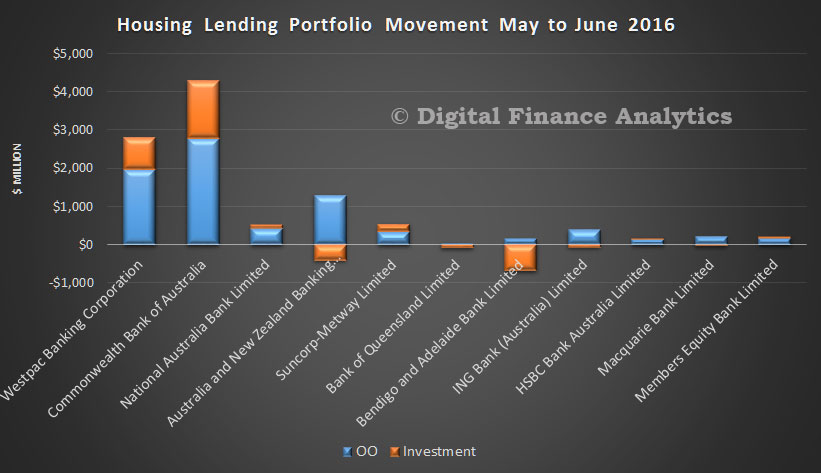
APRA-June-2016-1Loan portfolio movements show that CBA grew its overall book the most. However, bear in mind there were $1.3 billion of adjustments between classifications of loans in the month, so there is noise in the data.

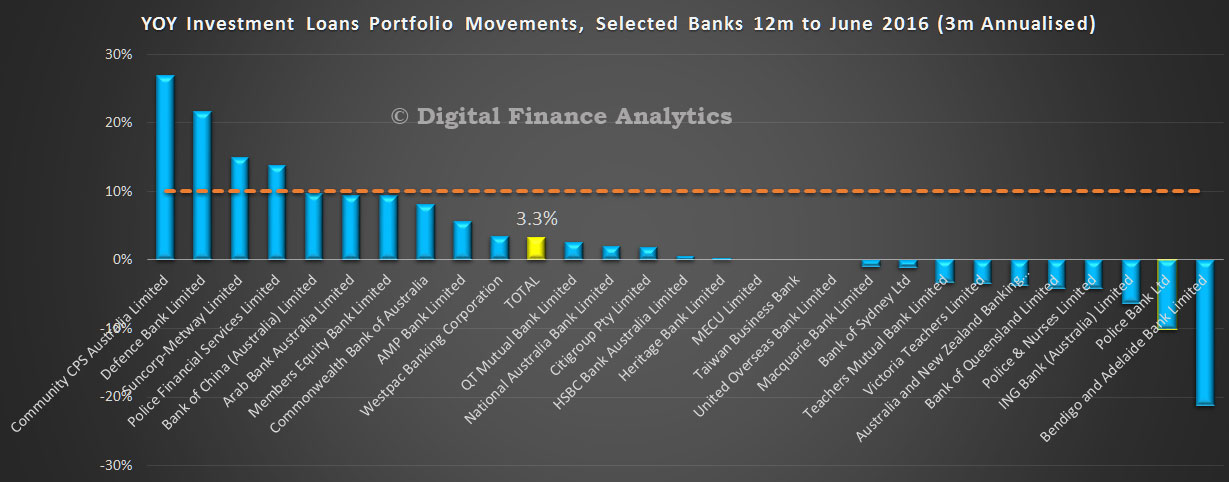
APRA-June-2016-2However, if we take this as right, we can estimate overall investment loans growth. We use the data from the past 3 months, and gross it up to 12 months, to remove some of the noise. On that basis, overall growth is 3.3%, and most players are well within the APRA 10% speed limit.

APRA-June-2016-3

Have We Passed Peak Mortgage?

The housing finance data from the ABS today shows that there has been a slight slowing in absolute mortgage lending flows in May.  But the overall stock of housing loans held by ADIs rose 0.62%, or $9.3 billion (after taking account of new additions, repayments and refinance, as well as adjustments). Total loans on book were worth $1.5 trillion, another record. Within that, owner occupied loans rose 0.76% or $7.3 billion, and investment loans rose 0.37% or $2.0 billion.

We will concentrate on the more reliable trend data series. Overall new owner occupied lending flows fell, in trend terms by 0.56%, or $115 million. Withing that overall fall though, refinanced loans were static, at 34.3% of lending, as households took up the low rate offers available. Lending for construction was down 0.54%, or $9.9 million, whilst purchases of new property were down 3.5% or $34 million and purchase of establish property was down 0.4%, or $71.6 million. Remember we are looking at flows of new loans here, so in trend terms, the value of mortgages is still growing, just more slowly.

May-2016--OOFlowsLooking across the various states, the weighted average was a drop of just 0.2%. ACT rose 1.2% and SA rose 0.8%, whilst all other states, other than NT fell around 0.2%. NT fell 1.4% on small volumes.

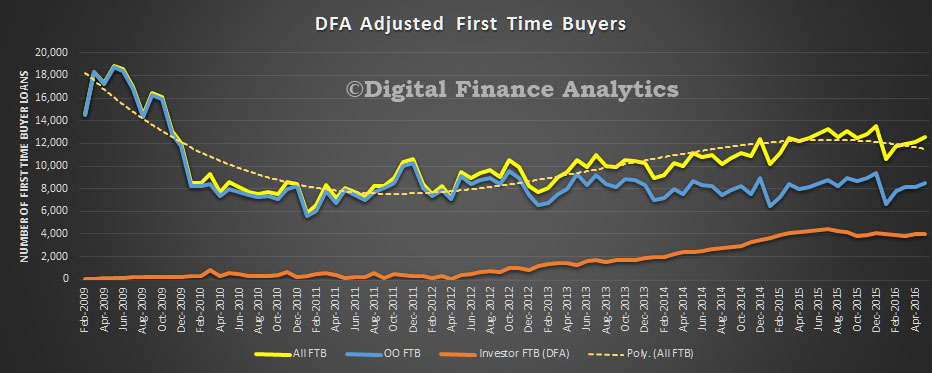
May-2016--State-ChangesLooking at the original data for first time buyers, the number of loans jumped by 4.5% to 8,488, but comprised 13.9% of all transactions, down from 14.14% last month. The average loan size fell again by 1.3%, showing that tighter lending standards are biting, the average new loan for first time buyers is now $326,000, whilst the average loan to other borrowers also fell, to $362,000, down 1.2%. Using data from our surveys, we are able to identify those first time buyers going direct to the investment property sector. Investor loans grew 1.2% making 4,041 loans in the month, so total REAL first time buyers of all types rise by 3.4% to 12,529 during May.
May-2016-FTBLooking at the mix of lending for investment and owner occupation, the flow of investment loans fell by 0.1% in trend terms (down $6m) whilst owner occupied loans flows fell 0.6% or $115 million. $11.6 billion of investment loans and $20.5 billion of owner occupation loans were written. In total more than $32.1 billion of new loans were written, compared with $32.2 billion last month, an overall fall of 0.4%.

May-2016-oo-and-INV-FlowsAs a result, the mix of new loans for investment purposes rose to 36.2%. We continue to see a rise in investment lending, with a 1.9% lift in loans for new investment property construction, compared with a fall of 0.5% for construction for owner occupation.

May-2016--OO-and-IV-Detail Finally, we look at loan stock, remembering some reclassifications continue. The overall stock of housing loans held by ADIs rose 0.62%, or $9.3 billion (after taking account of new additions, repayments and refinance, as well as adjustments). Total loans on book were worth $1.5 trillion, another record. Within that, owner occupied loans rose 0.76% or $7.3 billion, and investment loans rose 0.37% or $2.0 billion.

May-2016-StockSo, we conclude that momentum is likely to drive home loan demand higher, even if the rate of growth is somewhat curtailed by tighter lending standards. Demand is still being seen from investors and first time buyers are still active. Refinance to new low rates is still in play. So, no we have not yet reached “peak mortgage”.

ADI’s Battle For Home Loans

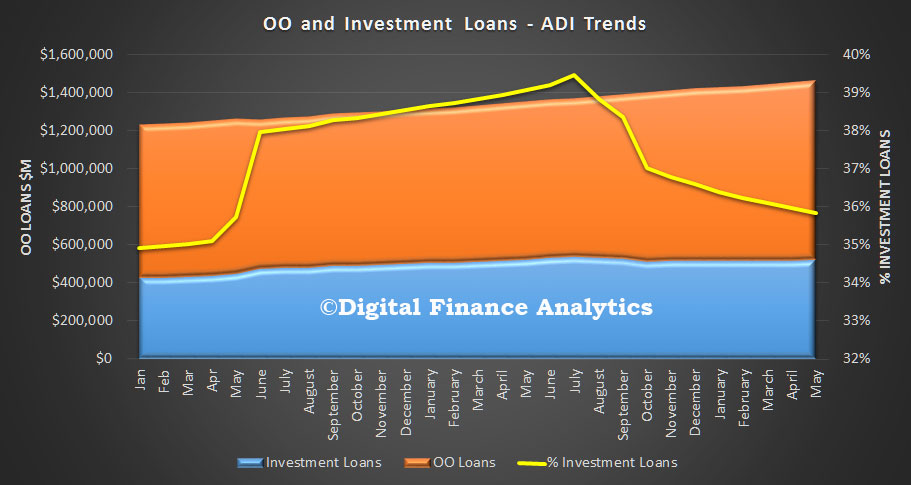
The latest data from APRA provides an insight into the relative movements between players in the home loan market as well as the total book held by ADIs. The RBA today released their aggregate data to May. APRA data shows that total home loans by ADI’s grew by 0.9% in the month, from $1.45 trillion in April to $1.46 in May, up $13 billion. Of this $10.2 billion was for owner occupied loans and $2.8 billion for investment lending, which has gained momentum recently. Total owner occupied loans were worth $938 billion, and investment loans $524 billion, or 35.9% of book.

ADI-May-2016-typeLooking at the monthly movements in absolute dollar terms, CBA grew its book the most, with a hike in both owner occupied and investment lending. Westpac grew its owner occupied book more, compared with its investment loans book, though it still has the largest share.

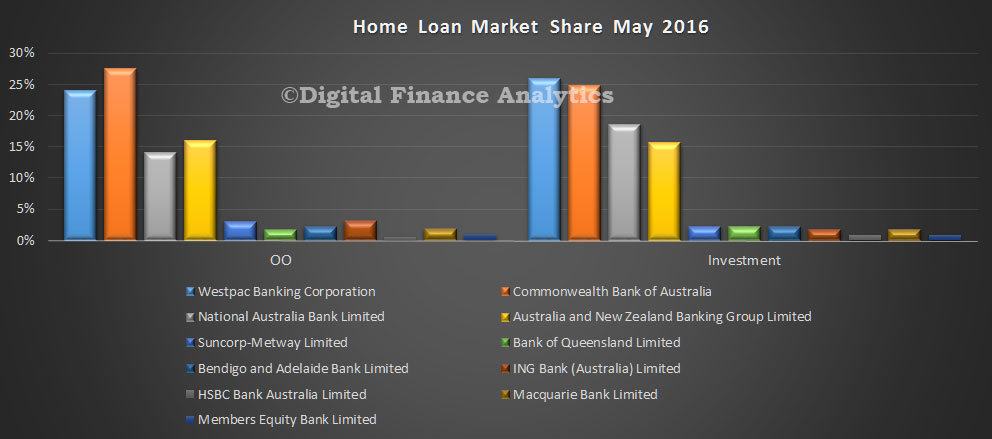
ADI-May-2016--Mon-MovOverall the relative shares changed but slightly.

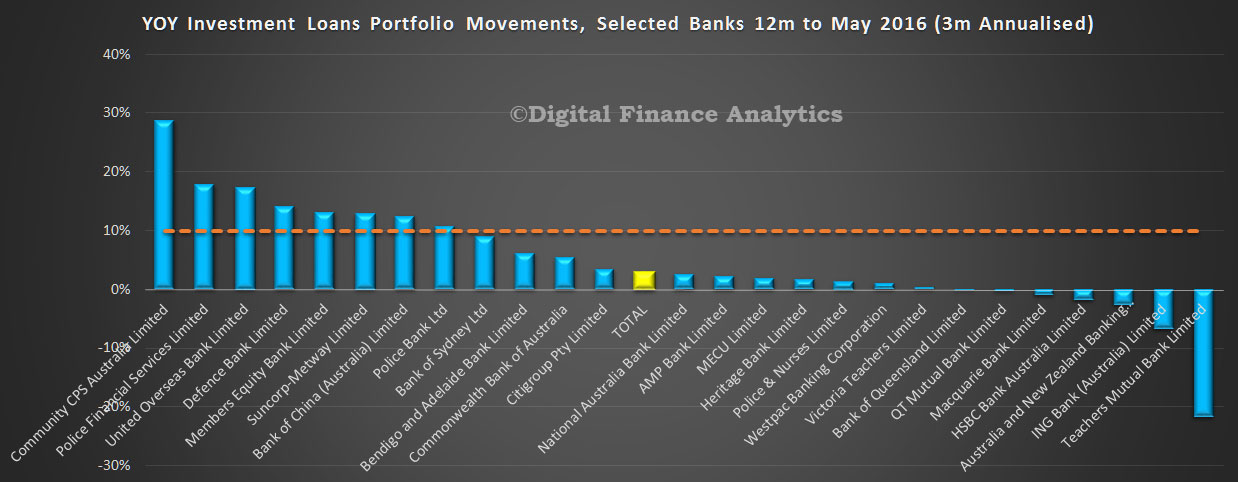
ADI-May-2016--ShareFinally, we cross-checked the speed limits for investment loans at 10% (not a squeak from APRA as to whether this limit still applies by the way). The majors are all well below, which gives them capacity to make more investor loans in coming months.  This is based on a 3 month rolling average, annualised. It will still be noisy, as more than $1bn of loans were switched between categories in the month.

ADI-May-2016.-Inv-Trendsjpg

Home Lending Accelerates In May To Another Record

The RBA released their Financial Aggregates for May 2016. Total housing grew by 0.5% in May, compared with 0.4% in April. Business lending grew by 0.3%, compared with 0.8% in April. Personal credit fell again by 0.1%. Housing lending overall lifted by $7.5bn, of which $6.5 bn was for owner occupation and $0.9bn for investor loans. Total housing loans are now $1.56 trillion, another record and comprise 61% of all loans outstanding.

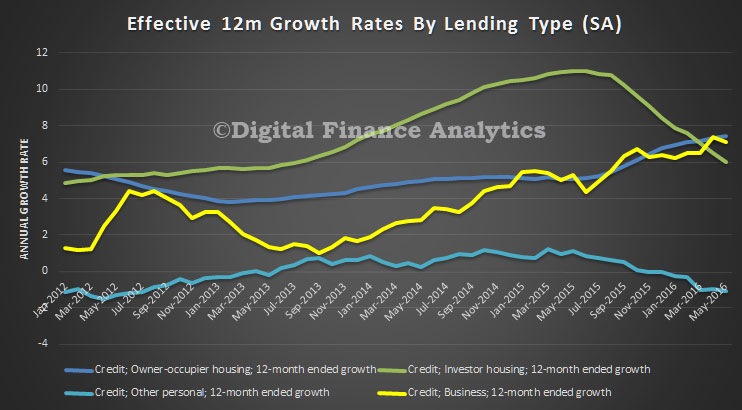
May-Credit-Agg-2016Annual growth rates for home lending is 6.5%, compared with 6.2% in May 2015, Business was 7.1%, compared with 5.3% last year, and Personal lending was down 1.1% to May 2016, compared with up 1.1% this time last year.

May-Credit-Agg-Growth--2016A further $1.1 bn of loans were switched between owner occupied and investment housing loan categories.

Following the introduction of an interest rate differential between housing loans to investors and owner-occupiers in mid-2015, a number of borrowers have changed the purpose of their existing loan; the net value of switching of loan purpose from investor to owner-occupier is estimated to have been $41 billion over the period of July 2015 to May 2016 of which $1.1 billion occurred in May. These changes are reflected in the level of owner-occupier and investor credit outstanding. However, growth rates for these series have been adjusted to remove the effect of loan purpose changes.

Bank Home Lending Credit Growth Continues

The latest data from APRA reporting home lending to end March shows total ADI balances grew by $9.5 bn to $1,441,253, a rise of 0.67% in the month, which is an annualised rate of 7.9%. Superficially, $8.2.billion was for owner occupation and $1.3 billion for investment home purchase but the RBA warned that $1.5 bn was due to loan reclassification between OO and INV loans so there is still noise in the system.

There was little net market share movement among the larger players. CBA still has the largest share of owner occupation loans, and Westpac of investment loans.

APRA-March-2016---Home-SharesThe value of portfolio movements shows the focus on owner occupied lending, compared with investment loans. Perhaps.ANZ’s fall in investment loans could signal a reclassification?

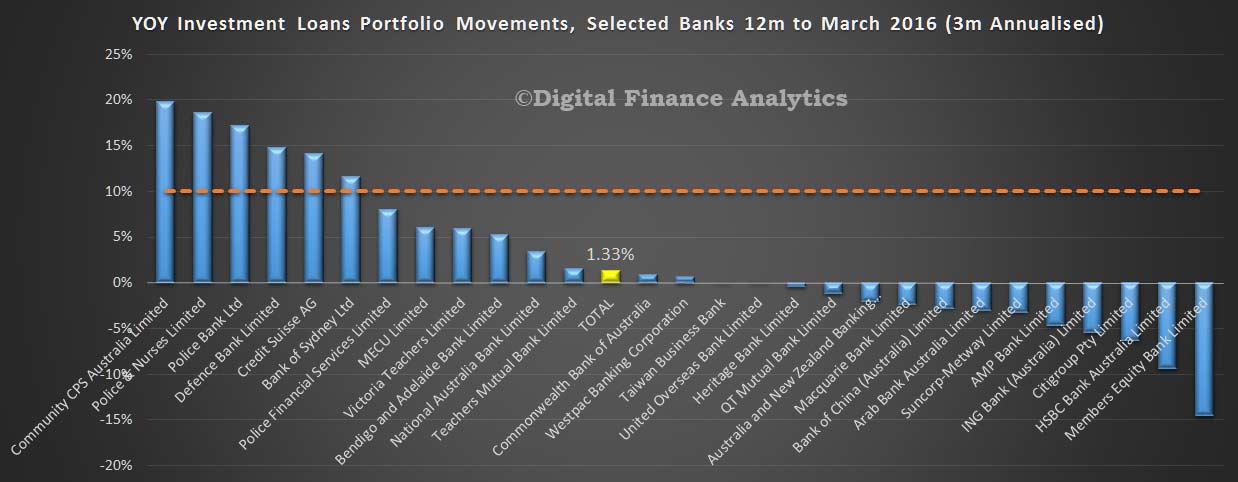
APRA-March-2016---Home-Share-MovcementsLooking at the growth in investment loans in terms of the APRA 10% speed limit, calculating movements on a 3 month annualised basis, against a market movement of 1.33%, NAB has growth above system, whilst the other major players are below system. Some smaller players continue to write high volumes of investment loans.

Investment-Growth-April-2016-By-Bank

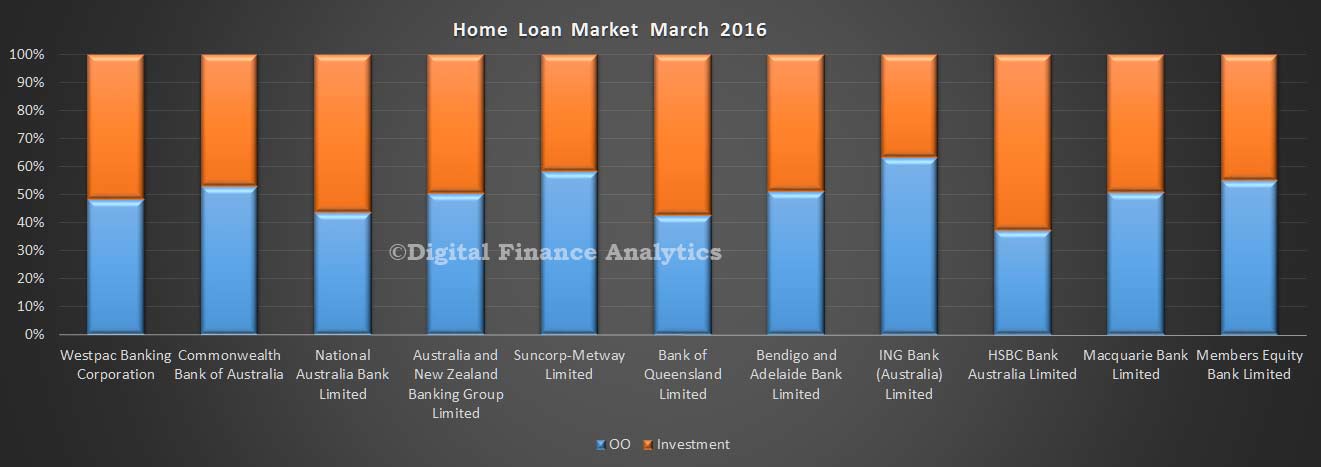
Finally we look at the relative share by loan type. This chart takes the relative percentages for owner occupied and investment loans by bank. It does not show the relative value, but the relative share (which we think is a more important lens).

Share-Splits-Mar-2016-APRAWe will not post on the deposit or credit card portfolios as there is little to see this month.


OO Home Lending Drives Mortgages To A Record $1.55 Trillion

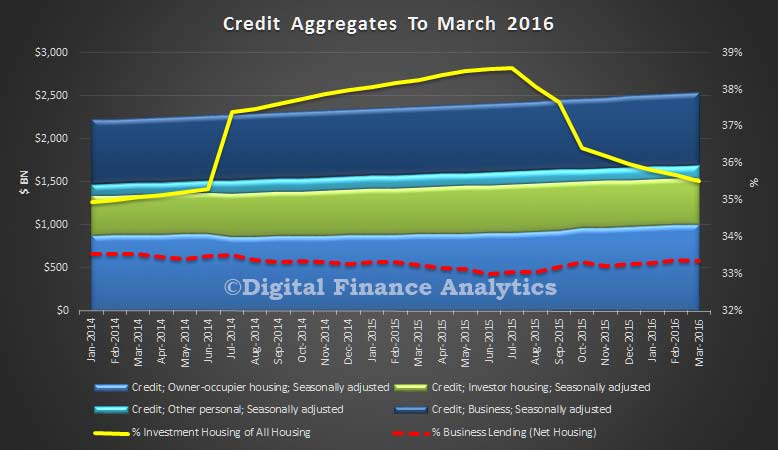
The RBA released their credit aggregates to end March today.  Housing lending grew 0.5% in March and reflects an annual rate of 7.2% – well above inflation! Business credit grew by 0.3% or $2.6 billion (annualised 6.5%) and personal credit fell 0.3% or $0.6 billion, and represents an annualised fall of 1%. We are still not seeing real relative growth in the important business investment sector.

RBA-March-2016-AggregatesSo, housing momentum is driving banks lending books. Seasonally adjusted lending for owner occupation grew 0.76%, or $7.5 billion, whilst lending for investment homes grew just 0.08%. Total growth was 0.5% or $7.7 billion to a new record of $1,547.6 billion.  One third of loans are for investment purposes, though there is still some movement and reclassification. The RBA says:

Following the introduction of an interest rate differential between housing loans to investors and owner-occupiers in mid-2015, a number of borrowers have changed the purpose of their existing loan; the net value of switching of loan purpose from investor to owner-occupier is estimated to have been $39 billion over the period of July 2015 to March 2016 of which $1.5 billion occurred in March. These changes are reflected in the level of owner-occupier and investor credit outstanding. However, growth rates for these series have been adjusted to remove the effect of loan purpose changes.

Such strong growth in home lending will make the RBA pause for thought before they cut the cash rate again – household debt continues to sky rocket, at a time when incomes are static. Not a good formula for enduring financial stability. Cutting rates will have little impact on personal credit (which is still falling) or business borrowing (driven more by confidence and future prospective growth). This should temper the knee-jerk calls for a cut following the lower than expected inflation number earlier in the week.

We will post separately on the APRA numbers, also released today.

Whats Really Going On With Investment Housing Lending?

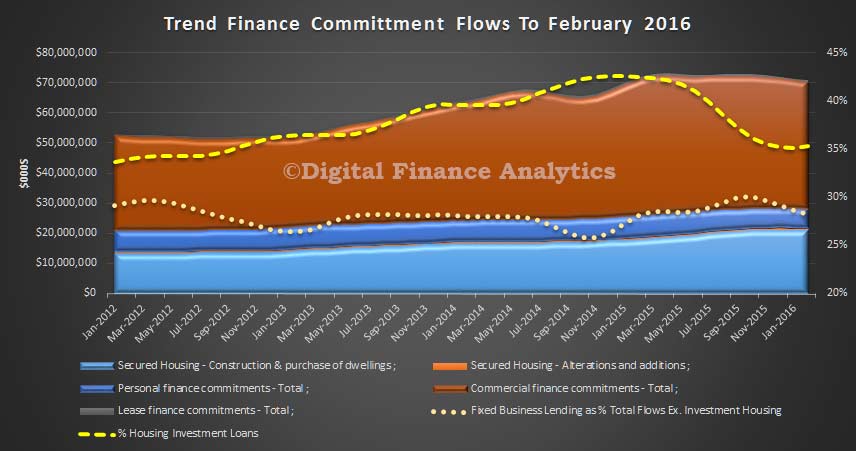
The ABS data on lending finance was issued on Wednesday, and the seasonally adjusted numbers caught the headlines. Housing finance was up 1.7% month on month, and commercial finance was up 5.6%. However, the seasonally adjusted numbers have lots of noise in the data, we we think they obscure what is really going on. So, first we look at the trend data. Overall credit flows fell by 0.9% in the month.  Within that secured housing fell 0.6%, whilst secured lending for alternations and additions rose 0.5%.  Revolving credit (mainly credit cards) fell 1.7% as households continues to pay off the Christmas binge, but fixed loans rose 0.5%. Commercial fixed loans (which include housing investment loans), fell 1.6%. However, the value of housing investment loans were line ball from last month, so the fall was from other commercial sectors, which is not good.

As a result, we see from the summary chart that the proportion of fix commercial lending NET of housing investment fell, from 28.7% to 28.2%, so in trend terms, lending for commercial purposes continued to fall. Assuming that lending is correlated to prospective economic growth, this is bad news.

On the other hand, lending for investment housing was still very present, and lifted to 35.3% of all secured housing loans. Investment lending still has momentum. Also, now we are seeing more households deciding to stay put and renovate. We expect lending demand for renovations to be strong in coming months.

ABD-Feb-2016-All-Lenidng

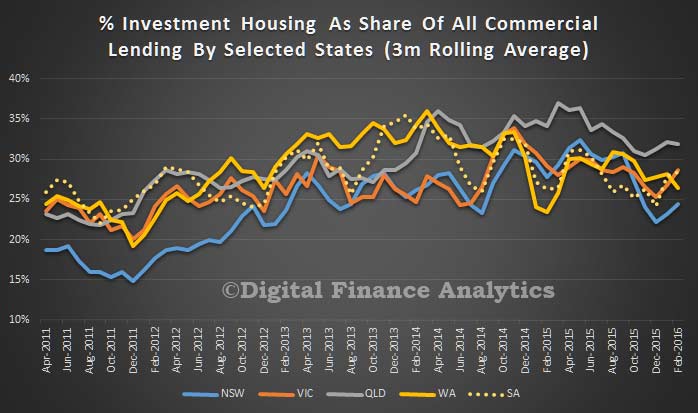
The other piece of data which is important is the state lending footprint. Some made much of the apparent fall in investment lending in NSW, but taking the original data (there are no trend or seasonally adjusted series), and using a rolling average over 3 months, we see a different story. The best way to look at this is to compare lending for investment housing (sum of new construction and purchase of existing dwellings for rental), compared with all commercial lending. When we look at the series, we do see a small fall in NSW, though with an upward inflection in the latest data. But we see that NSW has a lower relative share of housing investment loans compared with QLD and WA. In fact relatively there has been a greater proportion of investment loans written in these states for since 2011. VIC is also lower, though above NSW. So, the story about the great fall in housing investment momentum in NSW is over done. On the other hand, we should be more concerned about the ongoing investment momentum in QLD and WA, where house prices are set to ease, and mining re-balancing is most at work. We think the risks are higher here.

State-Inv-Lending-Feb-2016 We are still not seeing sustained commercial investments which are required to drive true economic growth. Housing is still doing too much of the heavy lifting, with household debt as high as it has ever been.