Relative Value At Risk By State

After I posted the summary data on owner occupied mortgages yesterday, including the latest estimated probability of 30-day default, I was asked if I could estimate the relative value-at-risk by state represented by these numbers, with a focus on WA.

Hi Martin, It looks as if WA is in some serious trouble. Do you know if the big banks are very exposed there? Thanks

In today’s post I will try to answer this question. Bear in mind that there is more than $1 trillion owing on owner occupied residential mortgages. We can apply the estimated PD30 (30 Day Default Probability) values to each mortgage pool and so estimate the value of loans at risk by state.

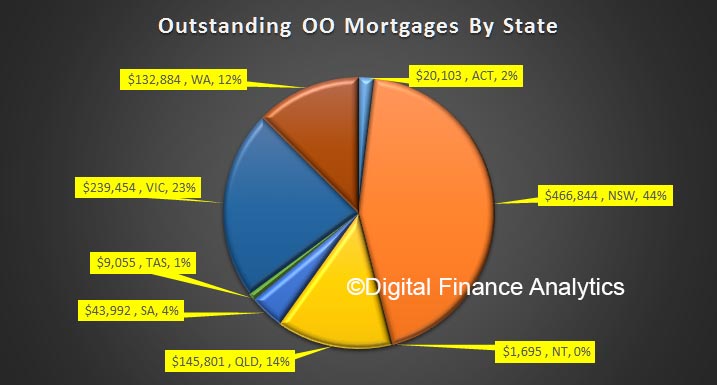
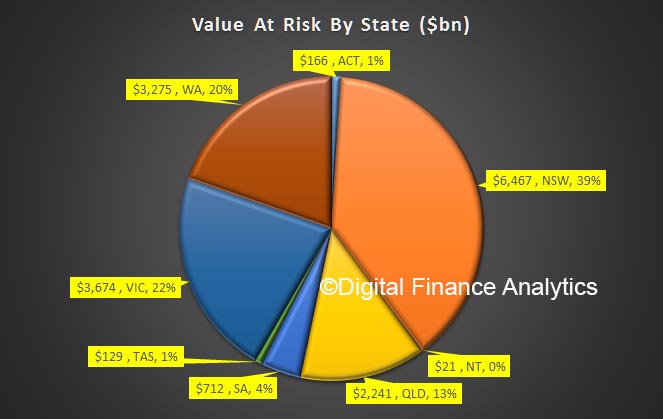
The charts below displays the output from the analysis. Each state is shown separately, together with its relative share of outstanding owner occupied mortgages by value – as a percentage of the total. But we also show the value – in billions – of loans at potential default risk and their relative distribution.

For example, in NSW, whilst around 30% of all households who have a mortgage live there, the total value of those mortgages is worth around $467 billion, which is 44% of the total national OO mortgage pool. From our modelling, $6.5 billion are at PD30 risk, which is 39% of the risk value pool.

But now compare this with WA. Around 12% of all households who have a mortgage live there. The total value of these mortgages is worth around $133 billion, which is also 12% of the total mortgage pool.  But from our modelling, $3.3 billion are at PD30 risk, which is 20% of the risk value pool.

This highlights the relative higher risks in the WA mortgage portfolio, which is why lenders are being more cautious.  Not all lenders are equally exposed, indeed some are targeting NSW and VIC, but WA is clearly a problem area in terms of risk assessment and management.
Any changes to the lending standards or capital rules needs to take account of the different characteristics in the various local markets.  Lenders need to calibrate their risk models accordingly.

Mortgaged Households, Vital Statistics

We have pulled out the latest data on residential mortgaged households, incorporating the latest mortgage increases and market valuations. So today we run over the top-level vital statistics.

To explain, our market model replicates the industry, across all lenders banks and non-banks and looks beyond the performance of just the securitised mortgage pools (as some of the ratings agencies report). It is looking from a “household in” perspective, not a “lender out” point of view.

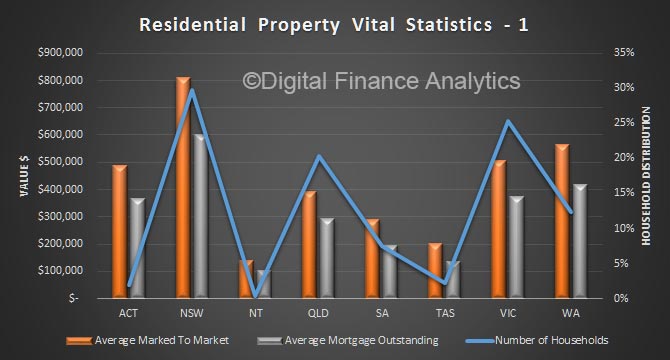
To start, we look at the average home price, and average mortgage outstanding across the states, plotted against the relative number of households borrowing.  NSW has the largest values, and thus mortgages, on average. But note that WA runs ahead of VIC though in the west prices are falling.

Next we look at average loan to value (LVR) marking the market value to market, and the latest loan outstanding data. NSW has the highest LVR on average, at ~75%. We also plot the average loan to income (LTI) and again NSW has the highest – at more than 6x income.

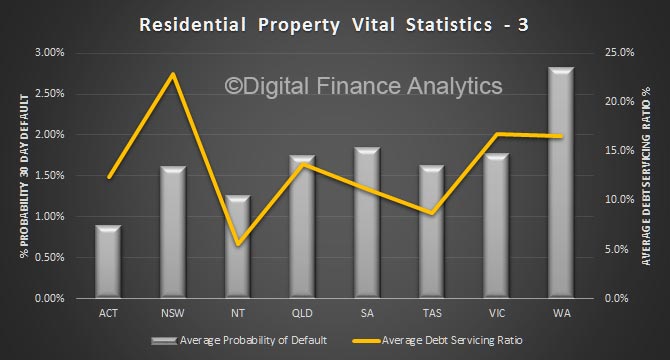
Then we look at debt servicing ratios, where again NSW leads the way on average at more than 23% of income, even at these low rates. VIC and WA are a little lower but still extended. Finally, we look at estimated probability of 30-day default, projecting forward to take account of expected economic conditions, interest rates and employment. WA has the highest score, followed by SA. NSW is a little lower, thanks to relatively buoyant economic conditions. That could all change quite quickly, and as highlighted the high leverage in NSW suggests that risks could become more elevated here.

We will update the market model again next month, and track movements across the states. Be warned, averages of course tell us something, but the relative spreads across segments and locations are more important. But that, as they say, is another story!

Mortgage arrears trending upwards nationally

Mortgage arrears underlying prime residential mortgage backed securities (RMBS) have increased from 1.14% to 1.15% from the third to fourth quarter last year says S&P, as reported in Australian Broker.

These values are determined through the Standard & Poor’s Performance Index (SPIN), which measures the weighted average arrears of more than 30 days past due on residential loans in publicly and privately rates Australian RMBS transactions.

Analysts at S&P Global Ratings have said this increase is in line with expectations of a cyclical rise towards the end of the year.

While arrears in the fourth quarter were up by 19% year-on-year, levels remain far below the historical peak of 1.69% according to the S&P report, RMBS Performance Watch – Australia.

Reasons for these low levels of arrears include a low interest rate environment, and, for RMBS, seasoned loans with established payment histories, S&P Global Ratings analyst Narelle Coneybeare, told Australian Broker.

S&P predictions, however, indicate that arrears are likely to rise towards the decade-long average of 1.25% which may put some areas at risk.

“Areas where unemployment is high may be facing increasing pressure. The recent trend has, to date, been Queensland and WA facing the most pressure on arrears performance,” Coneybeare said.

New South Wales (NSW) and Victoria experienced low rates of mortgage arrears – supporting the stable SPIN levels found in the report. Together, these states account for around 55% of total prime RMBS exposures.

While the SPIN in NSW and Victoria helped to offset higher levels of arrears in other states, analysts warned that further interest rate rises could still have negative effects.

“The majority of underlying loans in the portfolio are variable-rate mortgages, and a rise in interest rates is likely to exacerbate debt serviceability pressures, particularly for borrowers with higher loan-to-value (LTV) ratios and limited refinancing prospects,” the report stated.

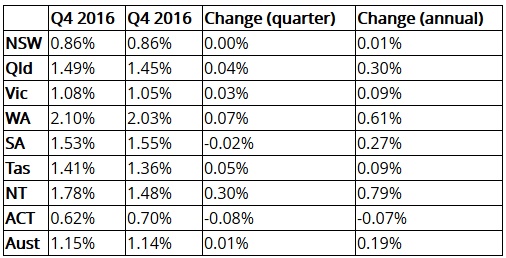
Breaking down by the states, the levels of 30+ day mortgage arrears, as well as the quarterly and annual changes are as follows:

Thirty-day arrears for non-conforming loans also increased from 4.36% to 4.43% from the third to fourth quarter last year, but were down from 4.63% in Q4 2015. The latest figure is also well below the 17.09% peak experienced after the financial crisis.

“The non-conforming arrears trend reflects a few factors, including low interest rates, accompanied by a relatively benign economic environment and stable unemployment conditions,” Coneybeare said.

“We’ve also observed changes in the overall mix of loans/borrower types in the nonconforming space, with more recent vintages having lower exposure to low-doc loans, as an example.”

Mining Areas Are Taking A Property Hit

From Reuters.

Australia’s quarter-century run of uninterrupted economic growth has made its property market one of the world’s most expensive, but mortgage pain in towns hit by a commodities downturn is beginning to be felt in parts of the financial system.


While most Australians are able to pay their debts, alarm bells have sounded around pockets of distress in the mining-heavy states, raising warnings from policymakers, ratings agencies and the Organisation for Economic Co-operation and Development.

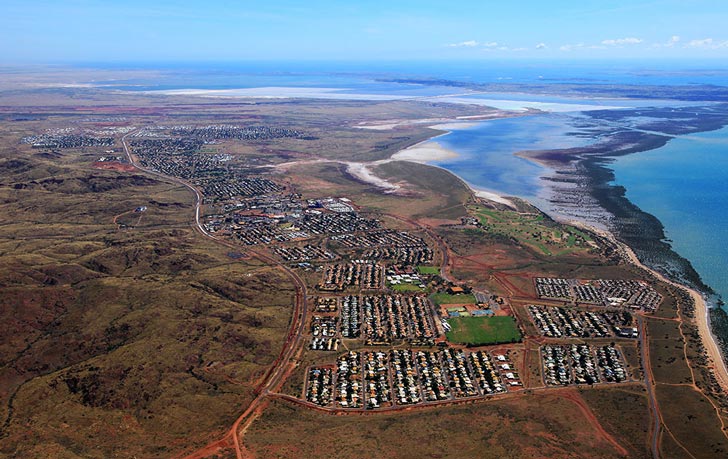
In the remote mining town of Karratha in Western Australia, 61-year-old Peter Lynch received a letter advising him that his bank was going to repossess his house at the end of the March.

“My property in 2010 was worth $905,000, today it’s worth $260,000,” Lynch said, estimating that seven out of 20 homes on his suburban street were for sale.

Two decades ago, Lynch borrowed money to buy a five-bedroom house in the town, thinking his job as a railway maintenance worker at Rio Tinto would last until he retired.

But the end of a one-in-a-century mining boom changed all that.

He now owes $222,000 and earns $42,000 a year as a cleaner, or roughly half his pay at the mine.

Western Australia is the hardest hit Australian state, with mortgage delinquencies topping 2.1 per cent, up by nearly half year-on-year, according to credit ratings house S&P Global.

S&P Global said 30-day arrears on mortgages packaged in issued securities were at multi-year highs.

Alena Chen, a senior analyst at Moody’s, expects rising underemployment and weak wage growth to drive delinquencies higher in mining-intensive states.

Signs of stress are now showing in the mortgage insurance market – shares in Australia’s largest mortgage insurer, Genworth Mortgage Insurance, are down 19 per cent since early February.

The company, which provides protection to lenders from borrowers defaulting on their home loans, last month reported an 11 per cent profit drop in 2016 due to a jump in mortgage delinquencies.

Borrowers typically pay for insurance when they have less than a 20 per cent deposit on their home purchase.

Genworth said in February that last year’s loss ratio of 35.1 per cent, up from 24 per cent in 2015, reflected higher average paid claims in resources-exposed regions, particularly Queensland and Western Australia.

Pockets of pain

Australia’s arrears rate of under 1 per cent, according to industry estimates, is still modest compared with the US peak of 27 per cent seen during the 2007-09 subprime mortgage crisis, and Australia has almost no subprime loans as such.

For now, rising arrears have not materially impacted the wider property market or financial system.

The major banks remain in good health and the mortgage-backed securities market, which finances the loan books of smaller banks and lenders, enjoys strong investor demand. And unlike the US, Australia has had no mortgage-backed bond defaults.

But investors and economists are worried stress could spread should there be a sudden loss of faith in the property market.

Concerns ‘already present’

Real estate is a national obsession in Australia, where two-thirds of households own a home. Since 2009, home values in the nation’s largest city of Sydney have more than doubled, while Melbourne has increased 88 per cent.

Australian households are among the world’s most indebted with a debt-to-disposable income ratio at an all-time peak around 180 per cent, compared with about 100 per cent in Germany and 150 per cent in the US.

Domestic mortgage debt stands at a whopping $1.7 trillion, equal to the country’s entire annual economic output.

Last week, the OECD singled out a “dramatic house-price correction” as the biggest threat to the Australian economy.

Reserve Bank of Australia governor Philip Lowe last month said the bank was wary of easing further for fear of creating housing vulnerabilities, particularly in the mining states.

Steven Hur, acting head of credit at AMP Capital which manages around $58 billion in fixed income, said market concerns about property prices were already present.

“It may push sellers to move first, thereby potentially signalling to the market a decrease in house prices, which may in turn spark further pressure on pricing,” Hur said.

Rate Cuts Help Lower Australian Mortgage Arrears in 3Q16

Australia’s mortgage arrears decreased by 8bp to 1.06% in 3Q16, as borrowers benefitted from the May and August 2016 Reserve Bank of Australia rate cuts and continued low mortgage rates, says Fitch Ratings in the latest Dinkum RMBS Index report.

The lower arrears were primarily in the 30-59 days bucket, but when compared to 3Q15, arrears were actually up by 16bp, despite Australia’s strong economic environment of appreciating house prices and low interest rates. Fitch believes underemployment and the mining sector slowdown, which have led to lower house prices in the regional areas of Queensland, Western Australia and the Northern Territory, may have also affected borrowers.

Losses experienced by Australian RMBS transactions remained extremely low, with lenders’ mortgage insurance payments and/or excess spread sufficient to cover principal shortfalls during the quarter.

Fitch’s Dinkum RMBS Index tracks arrears and performance of mortgages underlying Australian residential mortgage-backed securities

Genworth FY16 Results Highlight Changing Market Conditions

Lender’s Mortgage Insurer Genworth released their results to December 2016 today. From it, we get insights into the changing nature of the housing market, and also a view of the pressure LMI’s are under.

Genworth reported a statutory net profit after tax (NPAT) of $203.1m, down 10.9% on prior year. After adjusting for the after-tax mark-to-market move in the investment portfolio of $9.1m, underlying NPAT was $212.2m down 19.8% on prior year. The loss ratio was 35.1%, compared with 24% last year. They remain strongly capitalised, and though claims are higher, they declared a final fully franked dividend of $14.00,  a FY16 payout ratio of 67.2%, but down from last half.

Banks are clearly writing less high LVR mortgages, thanks to APRA, and when households default, and are forced to sell, there is sufficient capital appreciation in most properties to avoid a LMI claim due to strong price rises.  The banks, can’t loose! (Remember the LMI protects the bank, not the borrower). However, in regions where prices are falling – for example in the mining belts of WA and QLD, and home prices are falling, claims are up. This does not bode well if home prices were to revere more widely.

Genworth was listed in 2014, but since then has completed share buy-backs to reduce the number of issued shares. Further restructure will simplify the corporate structure in 2017, with a view to driving efficiency. They are the only separately listed LMI in Australia, (the banks have their own LMI captives, and the other player in the market is less transparent).

We will look at the market data they provided first, then look at the drivers of their results more specifically.

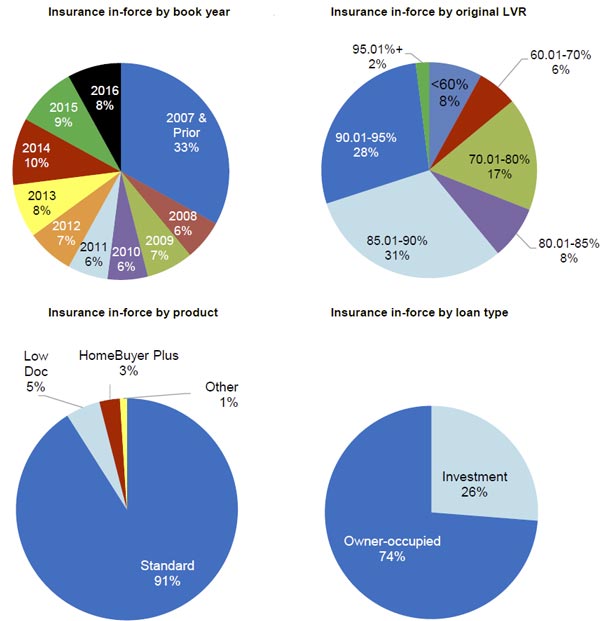
Genworth had an in-force portfolio of approximately $324 billion at Dec 2016. Standard LMI accounted for 91% of the book, and Low Doc 5%. 26% of the book relates to Investment loans.

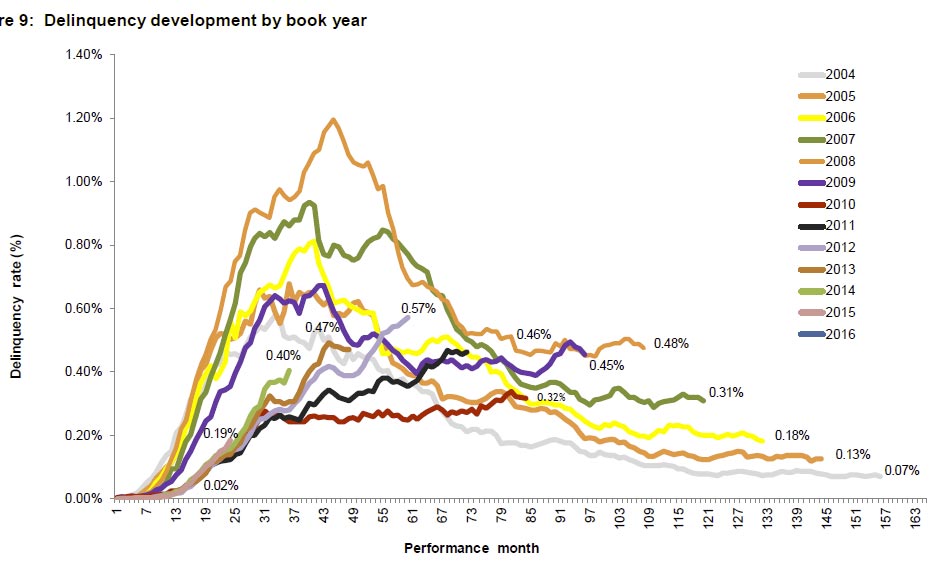
The seasoning picture is interesting.  This shows the evolution of Genworth’s 3 month+ delinquencies (flow) by residential mortgage loan book year, from issue.

The delinquency population by months in arrears aged buckets shows that over the past two years, the mortgagee in possession (MIP) as a proportion of total delinquency is trending down. This is because the strong property market has allowed stressed households to sell and release equity, with no LMI claim.

With regards to the current results, a range of factors influenced the lower outcomes.

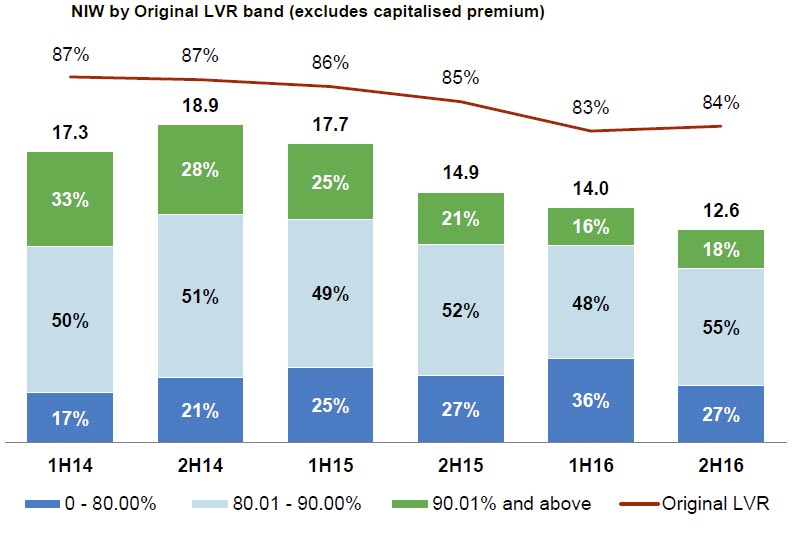
New Insurance Written (NIW) fell 18.4% in FY16, to $26.6 billion. Moreover, NIW above 90% LVR decreased 39.8%, and 80-90% LVR fell 17.2%. This reflects changing appetite among lenders for higher LVR business, following regulatory intervention from APRA.

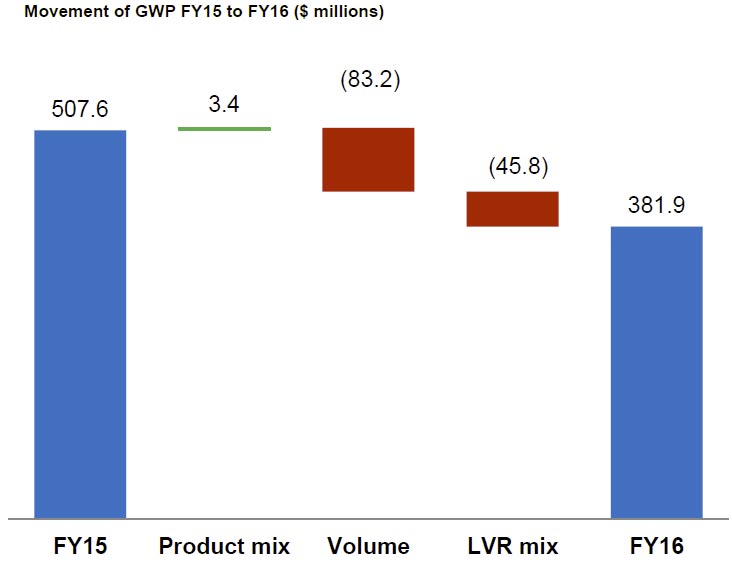
Lower Sales (Gross Written Premium – GWP) fell 24.8% compared to previous period due to the lower number of high loan-to-value (LVR) penetration in the market and a lower LVR mix of business.

The average price for Flow (GWP/NIW) decreased from 1.63% to 1.51% in FY16. However, they got some benefit from premium repricing in the second half.

Lower Revenue (Net Earned Premium) – NEP fell 3.6% reflecting lower earned premiums from current and prior book years.

Higher Net Claims Incurred – Net claims incurred increased by $46.1 m to $158.8m due to an increase in the number of delinquent loans relative to a year ago, and a higher average claim amount.  The performance in QLD and WA is “challenging”, reflecting increased delinquencies, especially in resource exposed regions. NSW and VIC were better performers.  Overall, the delinquency rate rose from 0.38% to 0.46%.

Whilst financial income (interest income and realised and unrealised gains/losses) increased by $18.1 m, to $126.0 m in FY16, the yield on the investment portfolio dropped 3.69%.

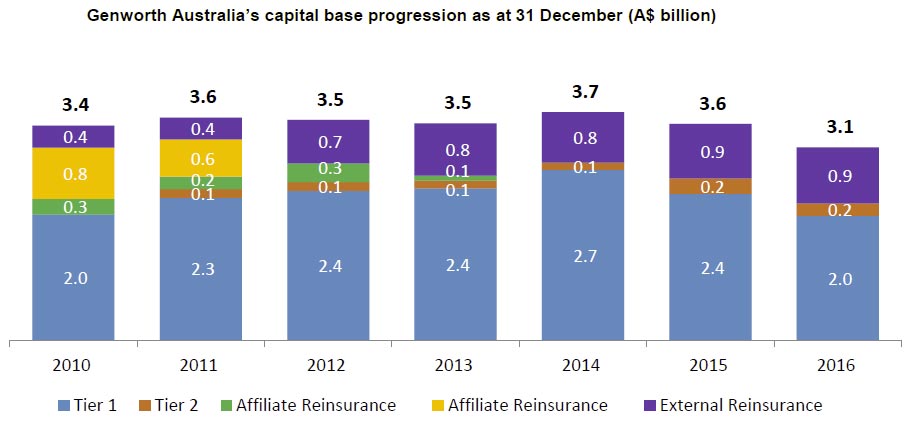
Regulatory capital fell from $2,600 m in 2015 to $2,213 m in 2016. CET1 decreased in FY16 mainly reflecting the $250 m of dividends, $202 m capital reduction and $86 m decrease in the excess technical provision, offset by $203 m NPAT. Tier 2 capital decreased following the redemption of $50 m of the $140 m notes issued. The PCA coverage ratio was consistent with FY15.

Increase in delinquencies predicted for 2017

From Australian Broker.

After sitting at historically low levels for 2014 and 2015, the number of mortgage delinquencies rose last year. This signalled the start of a trend which analysts expect to continue throughout the coming 12 months.

S&P Global Ratings’ RatingsDirect noted that arrears increased in 2016 despite low interest rates and stable unemployment rates.

This rise – which commenced in November 2015 and continued until May – was driven by a surge in the rate of under and part-time employment while fulltime employment growth declined.

“When we say they’ve gone up, these are modest increases. It was slightly under 1% a year ago and it’s 1.15% now but clearly there’s a trend. If you’re looking at year-on-year comparisons, these have been moving upwards,” Erin Kitson, primary credit analyst at S&P Global Ratings told Australian Broker.

This trend would persist if the Reserve Bank of Australia (RBA) increases the cash rate or if lenders continue to move out-of-cycle. Conversely, a drop in rates would see arrears performance trend lower.

“In terms of any meaningful movement, it will largely be driven by what happens with interest rates.”

These predictions are based on the Australian residential mortgage backed securities (RMBSs) that S&P rates, Kitson said. This includes about $140 million worth of loans outstanding.

“So it’s really a bit of a snapshot of the overall mortgage performance. Obviously, it doesn’t include every single loan in the Australian mortgage market.”

Since most of the loans included in these RMBS’s have variable rates, there is a correlation between what interest rates and arrears are doing, she said.

However, Kitson noted that overall numbers of delinquencies are still relatively low with even the 90+ day mortgage arrears around 0.55%.

“Your 90+ day mortgage arrears are a good proxy for default. At 0.55%, that’s still quite a low number. Given that, my opinion is it’s probably not likely to tip over into lots of defaults which then impact the housing market.”

Mortgage holders at greatest risk of rising interest rates and economic changes are those with higher loan to valuation (LTV) ratios as they have less wriggle room and less equity in their home loans, she said.

“If we’re looking at the RMBS portfolio, about 17% of borrowers have an LTV of greater than 80%. Generally in terms of when an economic situation starts to change, that will be felt first on higher LTV borrowers.”

Prime mortgage arrears rise 25% from a year ago

From Mortgage Professional Australia.

Prime mortgage arrears are up 25% from a year earlier, but remain relatively low, a report by S&P Global Ratings shows.

However, the number of prime home loan delinquencies fell in November 2016 from the previous month.

A total of 1.15% of the mortgages underlying Australian prime RMBS were more than 30 days in arrears in November, as measured by Standard & Poor’s Performance Index (SPIN), down from 1.16% in October.

Arrears fell month on month for most originator categories apart from regional banks, which recorded an increase in arrears to 1.88% from 1.85% a month earlier.

Nonbank financial institutions have maintained the lowest arrears, at 0.63%, followed by nonbank originators, at 0.95%, then other banks, at 0.96%. Major bank arrears were unchanged month on month in November.

A $90 Billion Debt Wave Shows Cracks in U.S. Property Boom

From Bloomberg.

A $90 billion wave of maturing commercial mortgages, leftover debt from the 2007 lending boom, is laying bare the weak links in the U.S. real estate market.

It’s getting harder for landlords who rely on borrowed cash to find new loans to pay off the old ones, leading to forecasts for higher delinquencies. Lenders have gotten choosier about which buildings they’ll fund, concerned about overheated prices for properties from hotels to shopping malls, and record values for office buildings in cities such as New York. Rising interest rates and regulatory constraints for banks also are increasing the odds that borrowers will come up short when it’s time to refinance.

“There are a lot more problem loans out there than people think,” said Ray Potter, founder of R3 Funding, a New York-based firm that arranges financing for landlords and investors. “We’re not going to see a huge crash, but there will be more losses than people are expecting.”

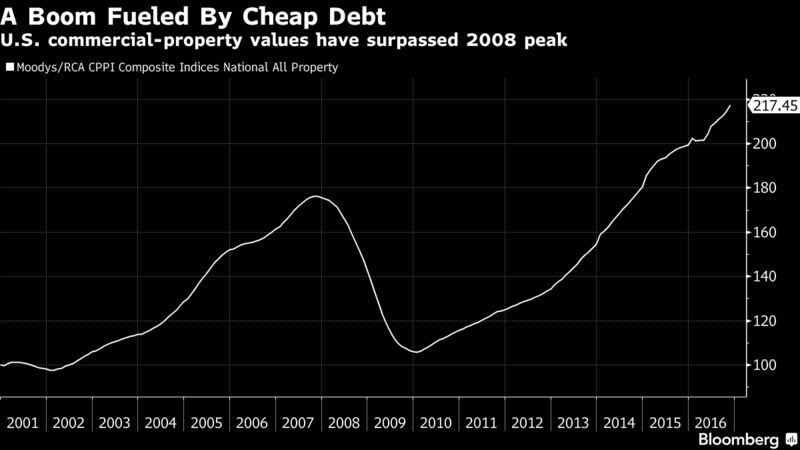
The winners and losers of a lopsided real estate recovery will be cemented as the last vestiges of pre-crisis debt clear the system. While Manhattan skyscraper values have surged 50 percent above the 2008 peak, prices for suburban office buildings still languish 4.8 percent below, according to an index from Moody’s Investors Service and Real Capital Analytics Inc. Borrowers holding commercial real estate outside of major metropolitan areas are now feeling the pinch as they attempt to secure fresh financing, Potter said.


The delinquency rate for commercial mortgages that have been packaged into bonds is forecast to climb by as much as 2.4 percentage points to 5.75 percent in 2017, reversing several years of declines, as property owners struggle with maturing loans, according to Fitch Ratings. That sets the stage for bondholder losses.

CMBS Record

Banks sold a record $250 billion of commercial mortgage-backed securities to institutional investors in 2007, and lax lending standards enabled landlords across the U.S. to saddle buildings with large piles of debt. When credit markets froze the following year, Wall Street analysts warned of a cataclysm, with $700 billion of commercial mortgages set to mature over the next decade.

“At the depths of the panic, it was just that: panic,” said Manus Clancy, a managing director at Trepp LLC, a firm that tracks commercial-mortgage debt. “That made people’s future expectations extremely bearish. Extremely low interest rates over the last four or five years have forgiven a lot of sins.”

The CMBS market roared back after an 16-month shutdown, and lenders plowed into real estate as an antidote to skimpy returns for other investments. The cheap loans helped propel property values to record highs in big cities such as New York and San Francisco, alleviating concerns about the mountain of debt coming due.

Credit for property owners has once again become scarce in some pockets. Borrowing costs jumped following the surprise election of President Donald Trump, and Wall Street firms are being more cautious as new regulations kick in requiring them to hold a stake in the mortgages they sell off. Other lenders are scaling back on commitments to property types and locations where problems have gotten harder to ignore.

Struggling Malls

Lenders are taking an increasingly dim view of retail properties — especially malls — as the growth of e-commerce eats into sales at brick-and-mortar stores. Malls tend to have higher loss rates than other property types after a default, increasing the stigma for lenders, according to Lea Overby, an analyst at Morningstar Credit Ratings LLC.

When malls “start to go downhill, if nothing is done to turn the ship around, they plummet,” Overby said. “The fate of some of these malls is very, very uncertain.”

The Sunset Mall in San Angelo, Texas, added a glow-in-the-dark mini golf course in June, part of a nationwide trend of retailers trying to lure customers with experiences they can’t find online. Yet when a $28 million mortgage came due in December, the borrower couldn’t refinance it, according to data compiled by Bloomberg. The debt, part of a bond deal sold by Citigroup Inc. and Deutsche Bank AG in March 2007, was handed off to a firm specializing in troubled loans.

A similar storyline is playing out at a 82,000-square-foot (7,600-square-meter) suburban office complex in Norfolk, Virginia, whose tenants include health-care services firms. The borrower stopped making payments on a $20 million loan that comes due next month and can’t refinance the debt, Bloomberg data show.

Representatives for the owners of the properties didn’t respond to phone calls seeking comment on the loans.

Manhattan Tower

Landlords that own high-profile buildings in big cities are faring better. At 5 Times Square, the Manhattan headquarters for Ernst & Young LLP, the owners are close to securing a five-year loan to pay off $1 billion in debt that comes due in March, according to Scott Rechler, chief executive officer of RXR Realty, which owns 49 percent of the building. RXR acquired its stake in the 39-story tower shortly after the building was sold to real estate investor David Werner for $1.5 billion in 2014.

“We are currently reviewing term sheets from a number of institutions and expect to settle on a lender within a week or so,” Rechler said.

Some borrowers chipped away at the maturity wall by retiring their mortgages early in order to take advantage of ultra-low interest rates. At the same time, landlords with the weakest properties have already defaulted, further reducing the pool of loans that need to be refinanced. The maturity wall has been whittled down to about $90 billion from $250 billion in 2008, according to data from Morningstar. The firm estimates that roughly half of the remaining loans will have difficulty refinancing.

S&P analysts are predicting that about 13 percent of real estate loans coming due will ultimately default, up from 8 percent over the past two years, according to Dennis Sim, a researcher at the firm. That’s their base case, but the default rate could be higher, he said.

“There are a lot of headwinds currently — with the interest-rate increase, with the new administration coming in, and also risk retention,” Sim said. “Those three wild-card factors could also play a role in how some of the better-performing loans are able to refinance or not.”

One in five homeowners will struggle with rate rise of less than 0.5%

From News.com.au

ONE in five Australians are walking such a fine mortgage tightrope that they could lose their homes if interest rates rise by even 0.5 per cent.

Our love affair with property has pushed Australia’s residential housing market to an eye-watering value of $6.2 trillion.

But as we scramble over each other to snap up property while interest rates are at historic lows, we have gotten ourselves into a bit of a pickle. We might not actually be able to afford funding our affair.

An analysis, based on extensive surveys of 26,000 Australian households, compiled by Digital Finance Analytics, examined how much headroom households have to rising rates, taking account of their income, size of mortgage, whether they have paid ahead, and other financial commitments. And the results are distressing.

It showed that around 20 per cent — that’s one in five homeowners — would find themselves in mortgage difficulty if interest rates rose by 0.5 per cent or less. An additional 4 per cent would be troubled by a rise between 0.5 per cent and one per cent.

Almost half of homeowners (42 per cent) would find themselves under financial pressure if home loan interest rates were to increase from their average of 4.5 per cent today to the long term average of 7 per cent.

“This is important because we now expect mortgage rates to rise over the next few months, as higher funding costs and competitive dynamics come into pay, and as regulators bear down on lending standards,” Digital Finance Analytics wrote.

The major banks have already started increasing their home loan rates this year, despite the market broadly expecting the Reserve Bank to keep the cash rate steady at 1.5 per cent this year.

Just this week NAB upped a number of its owner-occupied and investment fixed rate loans.

“There are a range of factors that influence the funding that NAB — and all Australian banks — source, so we can provide home loans to our customers,” NAB Chief Operating Officer, Antony Cahill, said of the announcement.

“The cost of providing our fixed rate home loans has increased over recent months.”

So as interest rates rise and leave mortgage holders in its dust, it leaves a huge section of society, and our economy, exposed and at risk.

NOT TERRIBLY SURPRISING

Martin North, Principal of Digital Finance Analytics, said the results are concerning, albeit not surprising.

“If you look at what people have been doing, people have been buying into property because they really believe that it is the best investment. Property prices are rising and interest rates are very low, which means they are prepared to stretch as far as they can to get into the market,” Mr North told news.com.au.

But the widespread assumption that interest rates will remain at historic lows is a disaster waiting to happen, especially in an environment where wage growth is stagnant.

“If you go back to 2005, before the GFC, people got out of jail because their incomes grew a lot faster than house prices, and therefore mortgage costs. But the trouble is that this time around we are not seeing any evidence of real momentum in income growth,” Mr North said.

“My concern is a lot of households are quite close to the edge now — they are not going to get out of jail because their incomes are going to rise. We are in a situation where interest rates are likely to rise irrespective of what the RBA does … There has already been movement up.”

Australia’s wages grew at the slowest pace on record in the three months to September 2016, according to the latest Wage Price Index released by the Australian Bureau of Statistics (ABS).

And as a result Australia’s debt-to-income ratio is astronomical. The ratio of household debt to disposable income has almost tripled since 1988, from 64 per cent to 185 per cent, according to the latest AMP. NATSEM Income and Wealth report.

What this means is that many Australian households are highly indebted, thanks in large part to the property market, without the income growth to pay it down.

“The ratio of debt to income is as high as it’s ever been in Australia and there are some households that are very, very exposed,” Mr North said.

THE YOUNG AND RICH MOST AT RISK

This finding will come as a surprise: young affluent homeowners are the most at risk — it is not just a problem with struggling families on the urban fringe. When it comes to this segment of the market, around 70 per cent would be in difficulty with a 0.5 per cent or less rise. If rates were to hike 3 per cent, bringing them to around the long term average of 7 per cent, nine in ten young affluent homeowners would feel the pressure.

“It is not necessarily the ones you think would be caught. And that’s because they are actually more able to get the bigger mortgage because they’ve got the bigger income to support it.

“They have actually extended themselves very significantly to get that mortgage — they have bought in an area where the property prices are high, they have got a bigger mortgage, they have got a higher LVR [loan-to-valuation ratio] mortgage and they have also got lot of other commitments. They are usually the ones with high credit card debts and a lifestyle that is relatively affluent. They are not used to handling tight budgets and watching every dollar.”

And while the younger wealthy segment of the market being most at risk might not be of that much importance compared to other segments, Mr North said what is concerning is the intense focus on this market.

“Any household group that is under pressure is a problem for the broader economy because if these people are under pressure they are not going to be spending money on retail and the broader economy,” Mr North told news.com.au.

“The banks tend to focus in on what they feel are the lower risk segments and the young affluent sector has actually been quite a target for the lending community in the last 18 months. Be that investment properties or first time owner-occupied properties, my point is there is more risk in that particular sector than perhaps the industry recognises.”

TOUGHER HOME LOAN RESTRICTIONS NEEDED

Now an argument is mounting that Australian banks need to toughen up their approach to home lending.

“I think we have got a situation where the information that is being captured by the lenders is still not robust enough. I am seeing quite often lenders willing to lend what I would regard as relatively sporty bets … I’m questioning whether the underwriting standards are tight enough,” Mr North said.

This includes accepting financial help from relatives for a deposit, a growing trend among first home buyers.

“The other thing that I have discovered in my default analysis is that those who have got help from the ‘Bank of Mum and Dad’ to buy their first property are nearly twice as likely to end up in difficulty … It potentially opens them to more risk later because they haven’t had the discipline of saving.”

News.com.au contacted several banks for comment on whether they think a rethink of their underwriting standards is needed. Only one lender, Commonwealth Bank, agreed to comment, but remained vague on the topic.

“In line with our responsible lending commitments, we constantly review and monitor our loan portfolio to ensure we are maintaining our prudent lending standards and meeting our customers’ financial needs. Buffers and minimum floor rates are used when assessing loan serviceability so it is affordable for customers,” a CBA spokesman said in an emailed statement.

But Mr North said something needs to be done before we find ourselves in a property and economic downturn.

“I’m assuming that with the capital growth we have seen in the property market, it will allow people who get into significant difficulty to be able to get out, however, it’s the feedback concern that I’ve got.

“If you have got a lot of people in the one area struggling with the same situation, you might see property prices begin to slip. If we get the property price slip, and we get unemployment rising and interest rates rising at the same time, we have that perfect storm which would create quite a significant wave of difficulty.

“We need to be thinking now about how to deal with higher interest rates down the track. We can’t just say it will be fine because it won’t be,” he told news.com.au.