Fintechs cash in on bank lending limits to curb property boom

From Australian Fintech.

As regulators weigh new limits on bank lending to cool the housing boom, their impact may be muted as tech-savvy borrowers turn to fintechs to access cheaper rates offered by non-bank lenders.

Hashching is raising $6 million of fresh equity on the Neu Capital fundraising platform in a deal valuing the Sydney-based start-up – which gives borrowers access to the best interest rates negotiated by mortgage brokers – at $40 million.

Since it was set up in August 2015, Hashching has received applications for $5 billion of home loans, which has doubled in the last five months. Around 20 per cent of loans are made to property investors.

On the platform, borrowers are increasingly turning to loans from non-bank lenders who are undercutting the big banks on price, said Hashching co-founder Mandeep Sodhi.

Last year, 65 per cent of borrowers were choosing products from one of the big four banks, but over the past six months, the share of the big four has dropped 38 per cent, he said.

Big banks have been been forced to raise interest rates to curb growth in their investor lending portfolios due to APRA’s caps; owner-occupier rates are also moving up due to higher funding costs.

‘There are new deals every week’

Borrowers have access to 60 lenders through Hashching, including non-bank lenders like Liberty Financial, Pepper Group, Resimac and La Trobe Financial, and foreign banks like Citigroup.

“We are seeing that even though the big four have tightened investor lending, smaller banks and non-banks are going more aggressive,” Mr Sodhi said.

“There are new deals every week. They are going hard on rates. They are wanting to increase investor lending. We have been seeing this trend since November where discounts last for two or four weeks then jack back up again. But then when one lender stops their discount, someone else steps right in.

“It’s the non-bank lenders taking the market share.”

Mr Sodhi said that if the Council of Financial Regulators put additional macroprudential limits on the banking sector as expected, this would increase volumes on Hashching because it could make the interest rate differential between banks and non-bank lenders even larger.

Last year, some brokers on Hashching were able to access rates from big banks as low as 3.5 per cent per annum but at present none of the big banks are offering rates below 4.5 per cent. But some brokers have secured prices from foreign banks and non-bank lenders at below 4 per cent.

AFG, the country’s largest mortgage aggregator, has also pointed to growing market share from smaller lenders undercutting the big four.

“AFG’s data today shows flows to the non-majors are increasing quarter on quarter and are up to 35 per cent of our flows,” said AFG interim CEO David Bailey this week.

Pepper said in February it would look to raise at least $1.5 billion in residential mortgage backed securities (RMBS) in 2017 to fund its growth as demand booms, with mortgage applications hitting the highest level in the company’s 15-year history in January and February.

Mortgage fraud increasing year on year

From Australian Broker.

The number of cases of mortgage fraud has been on the rise, with brokers warned to look out for falsified documents supplied by clients seeking unsuitable loans.


“Unfortunately, fraud continues to increase year on year,” said Paul Palmer, Connective’s compliance support manager, at the aggregator’s professional development day in Sydney on Thursday (23 March).

“The technological advancements of digital applications enable people to create documents or change existing documents to be more and more authentic looking.”

The aggregator has seen statements that lenders could only identify as fraudulent because they had no record of issuing them, Palmer said.

“Obviously, you can’t expect brokers to pick that up. Fortunately for us, most people trying to commit fraud aren’t that good. They always make spelling mistakes, a typo, or they get their mathematics wrong.”

As fraud investigations are inherently unpleasant for both broker and aggregator, Palmer urged a proactive rather than reactive approach.

To do this, he suggested brokers undertake all due diligence, meet required responsible lending obligations, cross check & verify all documents provided by the customer, and look for inconsistencies.

“We see a lot of differences in fonts, in key financial data, and also, as I said, a lot of mathematical areas. Run their payslips through the pay calculator and you’ll be amazed at how often that finds something.

“One of the biggest ones I found over the past 12 months is where there were two payslips and they forgot to change the accrued annual leave entitled from payslip to payslip; which we would expect to change. It’s a very common mistake.”

If it is impossible to meet the customer face-to-face, Palmer encouraged brokers to mitigate any risks by becoming familiar with conditions that lenders set up to accept remote broker-client meetups.

“From our perspective, a good thing is to get certified ID. Through Skype or Facetime conversations, get a snapshot of their ID. It fulfils an obligation to show you actually know who you’re dealing with.”

Finally, Palmer warned brokers to put themselves in the right mindset when it comes to fraud.

“Don’t think that you can’t get caught,” he said. “Unfortunately, there’s been a significant increase in the amount of referrals looking to give loans to mortgage brokers. In particular new-to-industry brokers have been targeted by people who have clients that can only service or get a loan through submitting fraudulent documentation.”

He urged brokers to do due diligence on their referrers as well.

“Make sure you’re comfortable with them as people, make sure they’re people you do your own business with yourself, and don’t trust anything they give you more than anything provided by your clients. In some ways, you need to be more skeptical.”

Referrers being paid ‘almost as much’ as brokers

From The Advisor.

There has been a sharp increase in the use of mortgage referrers, such as real estate agents and developers, whom are being paid “almost as much” as mortgage brokers in commissions “despite doing much less”, according to the financial services regulator.

ASIC’s Review of mortgage broker remuneration, which was released for consultation last week, included 13 findings about mortgage distribution and the home loan market.

Notably, the regulator highlighted that those who merely refer consumers to lenders are paid “almost as much as brokers”, despite “doing much less”.

The regulator described mortgage referrers as individuals or businesses that provide a referral service to lenders or brokers.

“Some of the most common referrers are real estate agents, financial planners, accountants and lawyers. However, referrers may also include other types of individuals and organisations, including property developers and non-profit organisations,” ASIC said.

The number of referrals being made to lenders, either by the referrer directly or through a referrer aggregator has increased significantly.

According to ASIC, the total number of home loans sold after a referral increased from 8,124 in 2012 to 26,106 in 2015, representing an increase in value from $3.3 billion to $14.6 billion (22.6 per cent).

ASIC noted that more than 87 per cent of those sales were by two major banks.

Referrals by professional services businesses (either directly or through a referrer aggregator) made up the bulk of referrals, with one out of three of these referrals coming through a referrer aggregator.

“We found that referrers are paid almost as much as brokers. Like brokers, they receive an upfront commission when a loan application is successful.”

ASIC found that on average, lenders paid 0.46 per cent of the loan amount as an upfront commission, although for some groups of referrers this was as much as 0.56 per cent.

“This level of commission-based remuneration is paid even though referrers play a very limited role,” the regulator said.

“The referrers we reviewed all operated under a licensing exemption. Under this exemption, they are permitted to merely refer a consumer to a lender, and in doing so they are required to disclose what remuneration they may receive. They cannot provide advice to consumers, or assist them in applying for a home loan. Referrers are also not subject to the responsible lending conduct obligations in the National Credit Act.”

ASIC asked lenders and aggregators whether they sought to restrict brokers from passing on some of their commission to referrers. No lenders reported that they sought to impose such restrictions.

“Around one-third of aggregators reported that the referral agreement with the broker did include limitations,” according to ASIC.

“However, based on aggregators’ additional comments, these provisions did not appear to prohibit a broker from making such payments; rather, they appeared to require the broker to comply with the relevant legislative provisions.”

Tougher home lending not the answer for WA: REIWA, UDIA WA

From The Real Estate Conversation.

The Real Estate Institute of Western Australia and the Urban Development Institute of Australia WA Division have spoken out strongly against applying tightener home lending conditions across the country.

REIWA President Hayden Groves said any decision to do so would be a knee-jerk reaction to market conditions on the east coast, in particular in Sydney and Melbourne, and would not be taking into account the varied market circumstances of all states and territories.

“Western Australia’s property market has softened considerably over the last couple of years. If lending conditions are made tougher for existing home owners, new home buyers and investors in WA, this will have a detrimental effect on our local housing market,” said Groves.

The Western Australian market is just beginning to show signs of stabilisation, said Groves, so any disruption at this point could have a particularly negative impact.

UDIA WA CEO Allison Hailes said imposing further lending restrictions may be viable on the east coast where the market is heated, but in Western Australia it will do more harm than good.

“Decision makers in the eastern states need to take Western Australia’s delicate economic and property market situation into account before introducing any changes, otherwise we could see the green shoots that are just starting to emerge killed off,” she said.

“Affordability remains a significant issue for West Australians, with the recent slowdown in the mining sector and challenging economic conditions continuing to present difficulties. Tightening lending conditions in Western Australia will have an adverse effect on affordability for West Australian home buyers, owners and investors,” said Groves.

Lending finance for investment represents a substantial proportion of the Western Australian property market, with 35 per cent of all lending in the state attributed to investors.

Even if tightened lending conditions were only applied to investors, increased borrowing costs “would mean investors have no choice but to pass this down to tenants and would also limit the number of investors entering the market,” said Groves.

Hailes said tighter lending conditions would also constrain the housing construction sector, and therefore would mean fewer jobs.

The Rule of Thirds

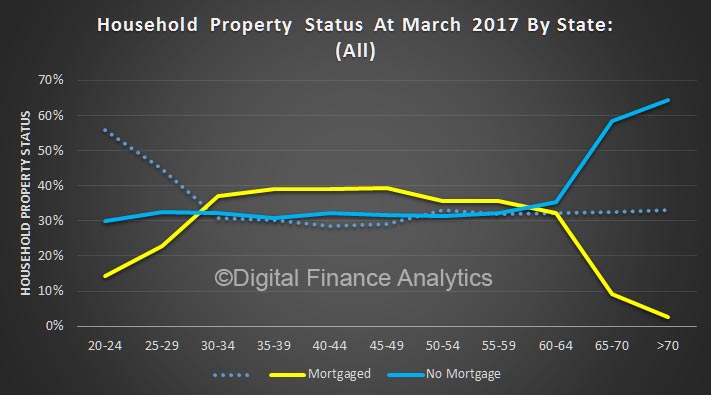
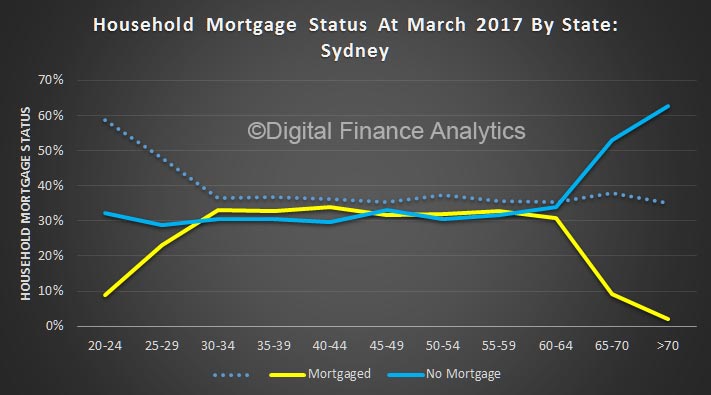
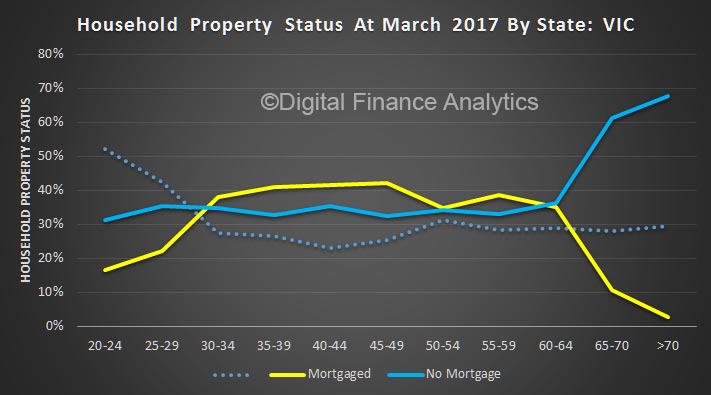
On average, according to our surveys, one third of households are living in rented accommodation, one third own their property outright, and one third have a mortgage. Actually the trend in recent years has been to take a mortgage later and hold it longer, and given the current insipid income growth trends this will continue to be the case. Essentially, more households than ever are confined to rental property, and more who do own a property will have a larger mortgage for longer.

Now, if we overlay age bands, we see that “peak mortgage” is around 40% from late 30’s onward, until it declines in later age groups. The dotted line is the rental segment, which attracts high numbers of younger households, and then remains relatively static.

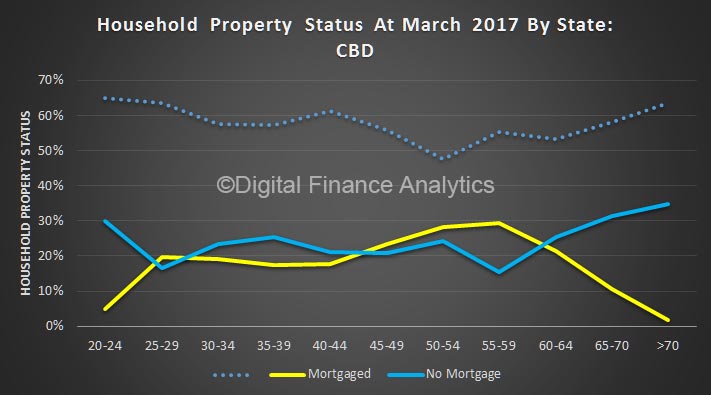
But the mix varies though the age bands, and across locations. For example, in the CBD of our major cities, most people rent. Those who do own property will have a mortgage for longer and later in life.

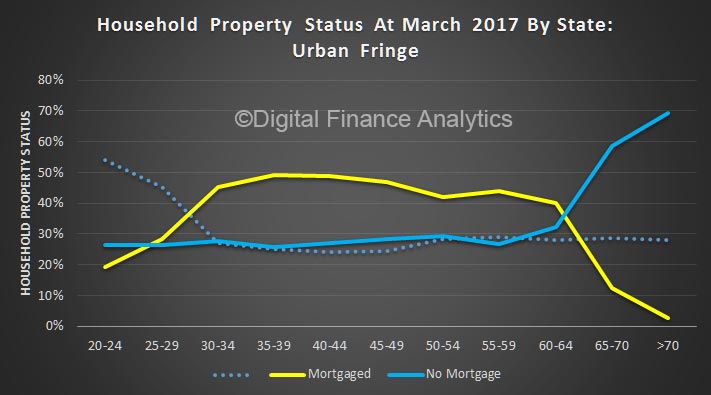
Compare this with households on the urban fringe. Here more are mortgaged, earlier, less renting, and mortgage free ownership is higher in later life.

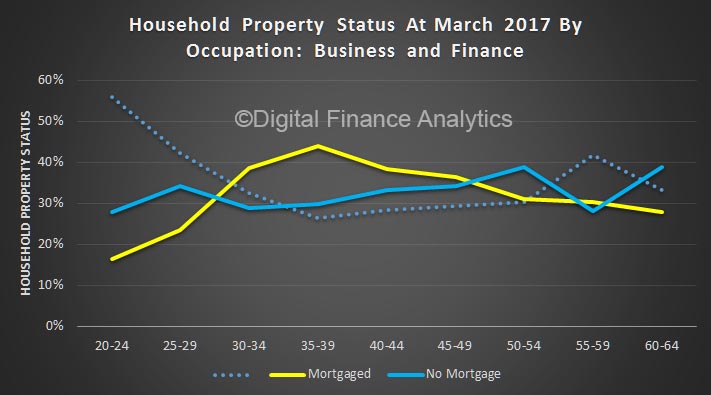
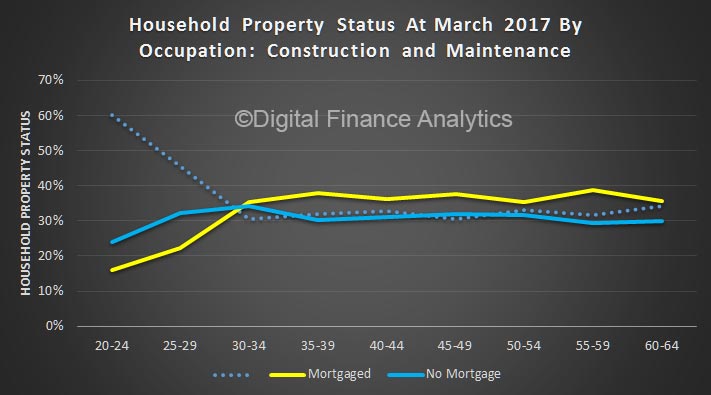
Different occupations have rather different profile. For example those employed in business and finance reach a peak mortgage 35-39 years, and then it falls away (thanks to relatively large incomes).

Compare this with those working in construction and maintenance.

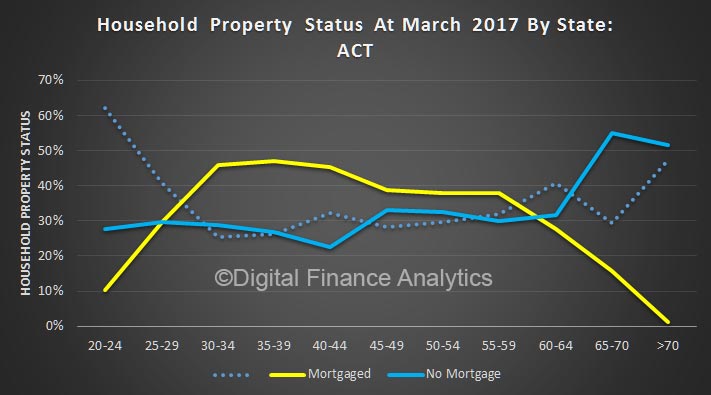
Finally, across the states, the profiles vary. In the ACT more households get a mortgage between 30-34, thanks to predictable public sector wages.

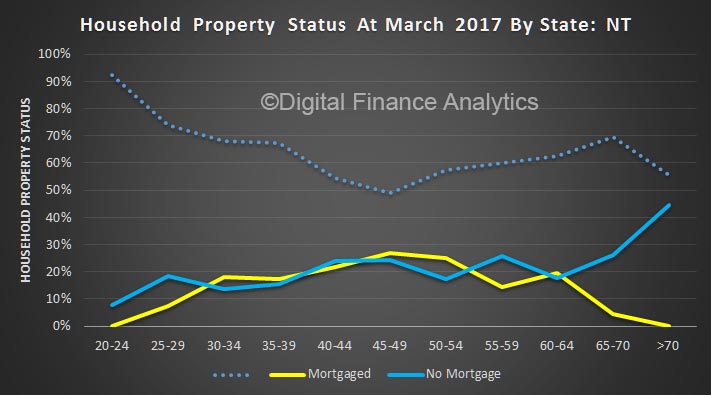
Renting is much more likely for households in NT.

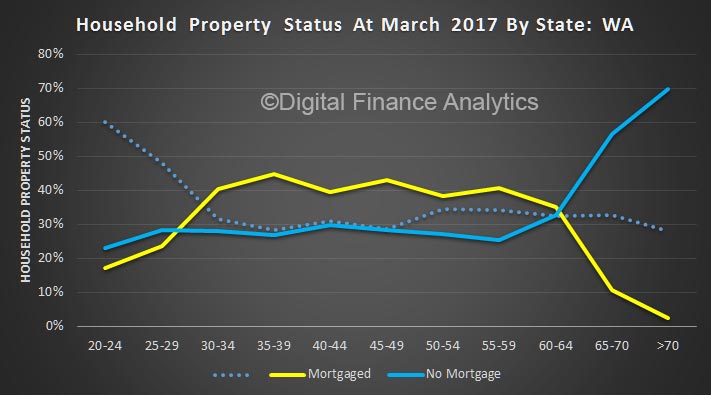
WA has a high penetration of mortgages among younger households (reflecting the demography there).

Most of the other states follow the trend in NSW, with the rule of thirds clearly visible.

Victoria, for example, has a higher penetration of mortgages, and smaller proportions of those renting.

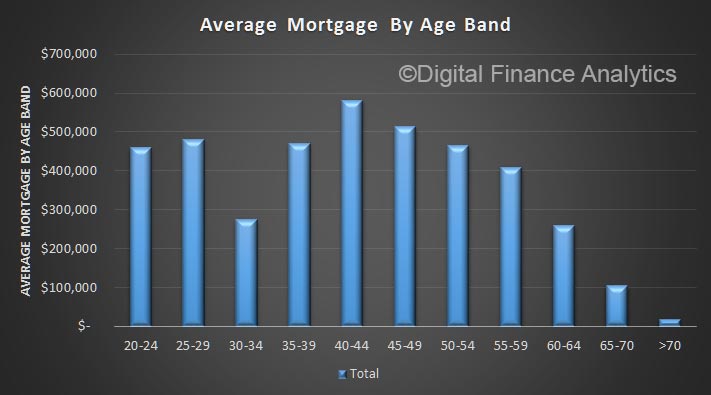
We find these trends important, because it highlights local variations, as well as the tendency for mortgages to persist further in the journey to retirement. This explains why, as we highlighted yesterday, some older households still have a high loan to income ratio as they approach retirement. To underscore this, here is average mortgage outstanding by age bands.


New Report On Mortgage Industry With JP Morgan Released

The report, released today highlights that property investors will be hit hard as banks re-price their mortgages.

Volume 24 of the mortgage report, a collaboration between J.P. Morgan and Digital Finance Analytics (DFA), explores how to practically define the term ‘materially dependent on property cash flows’ and looks to translate that into potential incremental capital requirements for the Australian major banks. The report also considers different re-pricing strategies and competitive dynamics, particularly around the issue of dynamic Loan-to-Value Ratios (LVR).

Significant changes are afoot for investor loans defined as being ‘materially dependent on property cash flows’ to repay the loan. Amidst the transition to Basel 4, these mortgages will see the most extreme effects on their capital intensity and pricing – with capital levels somewhere between 3x and 5x current requirements, which could have a significant impact on pricing of investor loans down the track.

The report draws heavily on modelling completed by Digital Finance Analytics from our household surveys, as presented in the recently published The Property Imperative 8, available here. Our survey is based on a rolling sample of 52,000 households and is the largest currently available. It includes data to end February 2017.

“The dispersion of impacts across the portfolio highlights the fact that assessing the mortgage by Probability of Default band or LVR band isn’t necessarily ‘good enough’. Although banks may have access to significant pools of data, the new regulatory regime is forcing them to become ever-more granular in their analysis – top-down portfolio analytics just won’t cut it anymore,” said Martin North, principal, DFA.

“Rather than managing the portfolio with ‘macro-prudential’ drivers, banks need to move to the other end of the analysis spectrum and become ‘micro-prudential’,” Mr North concluded.

Unfortunately because of compliance issues, the JPM report itself is only available direct from them, and not via DFA.

DFA is not authorized nor regulated by ASIC and as such is not providing investment advice. DFA contributors are not research analysts and are neither ASIC nor FINRA regulated. DFA contributors have only contributed their analytic and modeling expertise and insights. DFA has not authored any part of this report.

A Perspective On Investor Loans

Using data from our household surveys, we can look at investor loans by our core master household segments. These segments allow us to explore some of the important differences across groups of borrowers.  We believe granular analysis is required to see what is really going on.

Today we look at the distribution of these segments by loan to value (LVR) and amount borrowed and also compare the footprint of loans via brokers, and by loan type.

Looking at LVR first, there is a consistent peak in the 60-70% LVR range, with portfolio investors (those with multiple investment properties) below the trend above 70%.

However, the plot of loan values shows that portfolio investors are on average borrowing much more, thanks to the multiple leverage across properties. A small number of portfolios are north of $1.4 million.

Investors who borrow with the help of a mortgage broker, on average is more likely to get a larger loan.

But there is very little difference in the relative LVR by channel.

On the other hand, interest only loans will tend to be at a higher LVR.

The average balance of interest only loans is also higher, especially in the $400-600k value range.

Microprudential analysis reveals interesting insights! The loan type and segment are better indicators of relative risk than LVR or origination channel.

ME Bank profit up 34 per cent

Industry super fund-owned bank ME today reported an after-tax underlying net profit of $40.4 million for the six months to 31 December 2016, a rise of 34% on the previous corresponding period.

ME CEO, Jamie McPhee, said it was a strong result in the face of margin pressures that are expected to continue throughout the year.

Home loan settlements hit $3.2 billion for the six months, up 54% compared to the previous corresponding period, while ME’s home loan portfolio grew 9% to $20.6 billion. Total assets grew 6% to $24.6 billion.

ME’s statutory profit after tax, which includes the amortisation of realised losses on hedging instruments, a loss on the sale of the business banking portfolio and transition costs associated with a significant new technology partnership with Capgemini, was $29.3 million (HY16: $34.5 million).

Net interest margin declined 3 basis points to 1.46% relative to the previous corresponding period due to competition for new customers and higher funding costs; however, the impact on earnings was offset by increased home loan sales.

ME’s digital strategy incorporates increasing levels of process automation, including credit assessments and valuations, leading to further improvements in the cost to income ratio.

Customer numbers grew 8% to 393,416 and the bank passed the 400,000-mark in in early March 2017.

Net interest income increased 9% to $162.4 million with total income up by 3% to $187.1 million. Total operating expenses decreased from $118.9 million to $117.2 million.

ME remains very well capitalised at 31 December 2016, with a Common Equity Tier 1 ratio of 10.40% and a Total capital ratio of 14.84%.

McPhee said several strategic initiatives with its industry super fund partners were progressing well including providing customers with a single view of their banking and super accounts through a partnership with Link Group, which is scheduled to be launched with a major industry super fund in the second half of FY17.

As reported in Australian Broker,

Over half of the bank’s home loan settlements came through the broker channel, Lino Pelaccia, ME’s general manager of broker, told Australian Broker.

“The contribution from brokers is slightly up on the same time as last year due mainly to our continued expansion into the broker market,” he said.

“Increasing numbers of brokers are considering ME home loans, we continue to improve our broker services and service levels have remained very consistent over the last 12 months with new technology, and we continue to offer very competitive prices compared to other banks.”

Looking at the breakdown of settlements between owner-occupier buyers and investors, Pelaccia said the ratio will not change much given APRA’s current cap on growth in investment lending.

“We also note ME is well below that cap at the moment and so have some room to win more investor business before the end of the financial year,” he said.


Investors Boom, First Time Buyers Crash

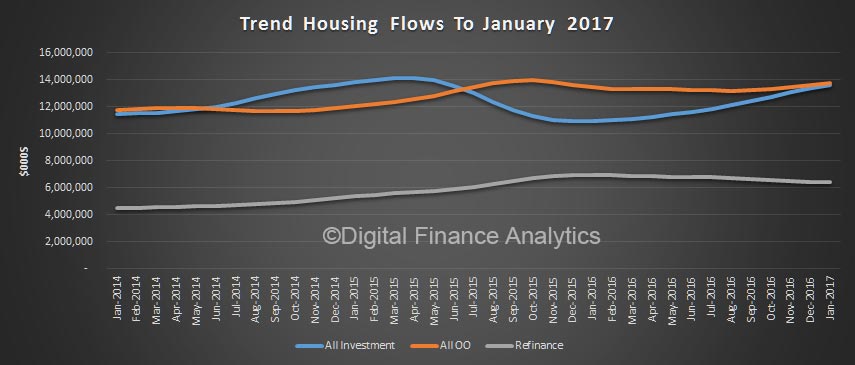
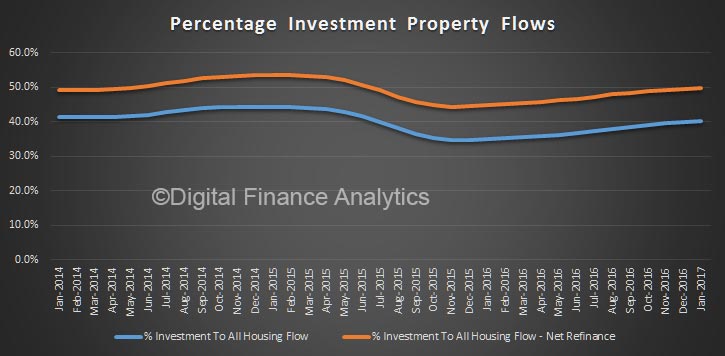
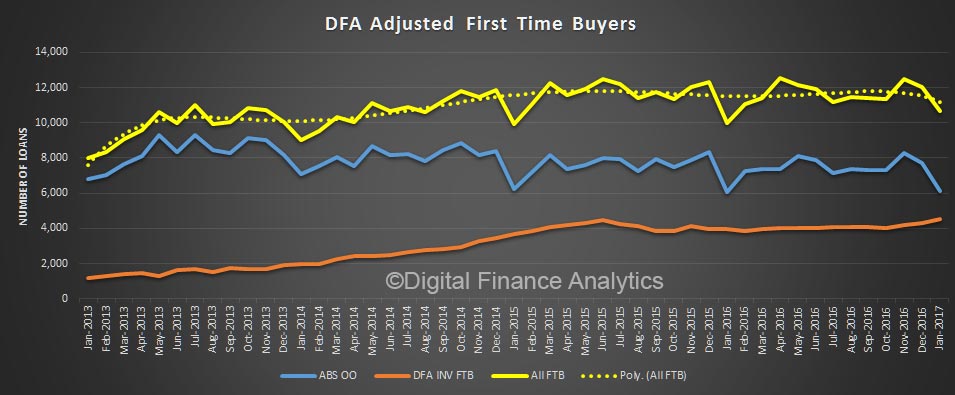
The ABS released their Housing Finance data today, showing the flows of loans in January 2017. Those following the blog will not be surprised to see investor loans growing strongly, whilst first time buyers fell away. The trajectory has been so clear for several months now, and the regulator – APRA – has just not been effective in cooling things down.  Investor demand remains strong, based on our surveys. Half of loans were for investment purposes, net of refinance, and the total book grew 0.4%.

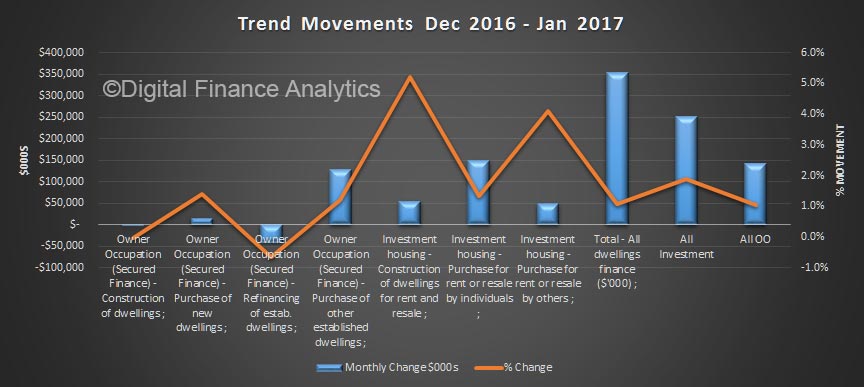
In January, $33.3 billion in home loans were written up 1.1%, of which $6.4 billion were refinancing of existing loans, $13.6 billion owner occupied loans and $13.5 billion investor loans, up 1.9%.  These are trend readings which iron out the worst of the monthly swings.

Looking at individual movements, momentum was strong, very strong across the investor categories, whilst the only category in owner occupied lending land was new dwellings.  Construction for investment purposes was up around 5% on the previous month.

Stripping out refinance, half of new lending was for investment purposes.

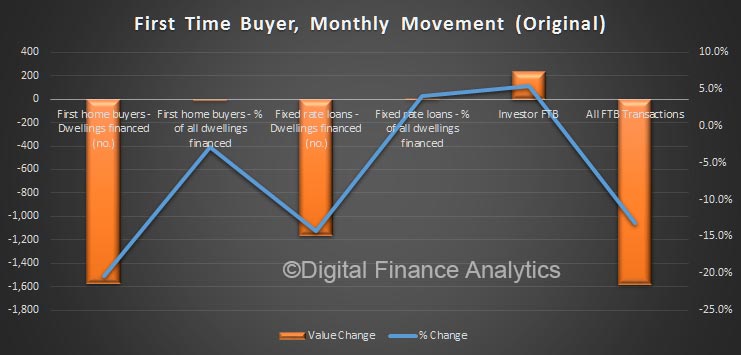
First time buyers fell 20% in the month, whilst using the DFA surveys, we detected a further rise in first time buyers going to the investment sector, up 5% in the month.

Total first time buyer activity fell, highlighting the affordability issues.

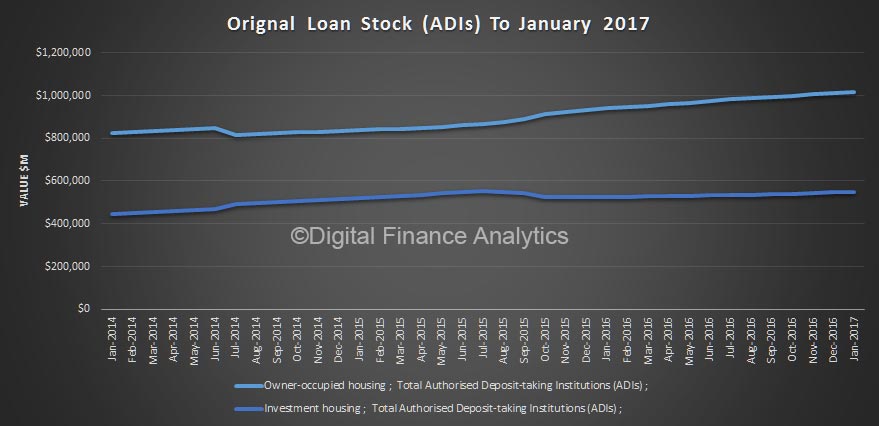
In original terms, total loan stock was higher, up 0.4% to $1.54 trillion.

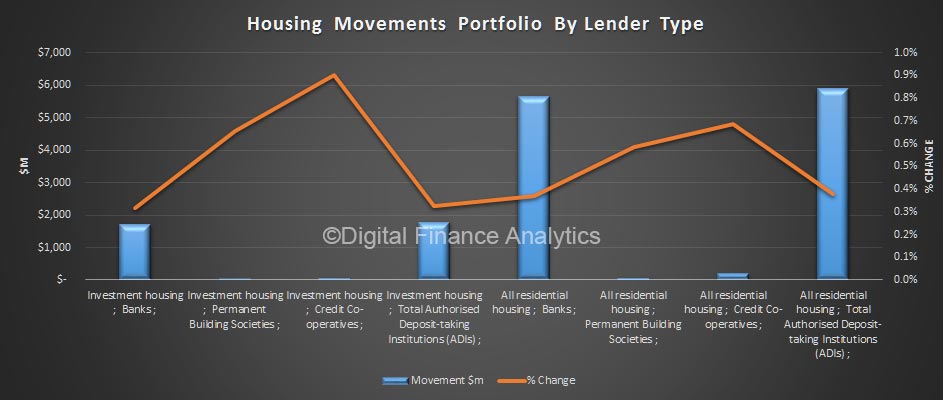
Looking at the movements across lender types, we see a bigger upswing from credit unions and building societies, compared with the banks, across both owner occupied and investment loans. Perhaps as banks tighten their lending criteria, some borrowers are going to smaller lenders, as well as non-banks.

We think APRA should immediately impose a lower speed limit on investor loans but also apply other macro-prudential measures.  At very least they should be imposing a counter-cyclical buffer charge on investment lending, relative to owner occupied loans, as the relative risks are significantly higher in a down turn.

The budget has to address investment housing with a focus on trimming capital gain and negative gearing perks.  The current settings will drive household debt and home prices significantly higher again.

LMI Genwoth Confirms Loss Of Exclusive Contract

Genworth has confirmed the exclusive contract with their second largest customer, which was due to expire in February 2017, will be terminated on 8th April 2017.

The LMI business underwritten under this contract represented 14% of gross written premium in 2016. The termination of this contract has not changed the forward guidance that GWP would be down 10 to 15 percent in 2017.

The company remains in discussions with the customer about managing default risk in the context of other insurance alternatives.

We think that as banks reduce the proportion of high-lvr loans they are writing, and insure more of the lower risk business within their captive internal insurers at lower net costs, the role of stand-alone LMI’s in the Australian market will need to evolve.