Mortgage Report Vol 23 Launched With JP Morgan

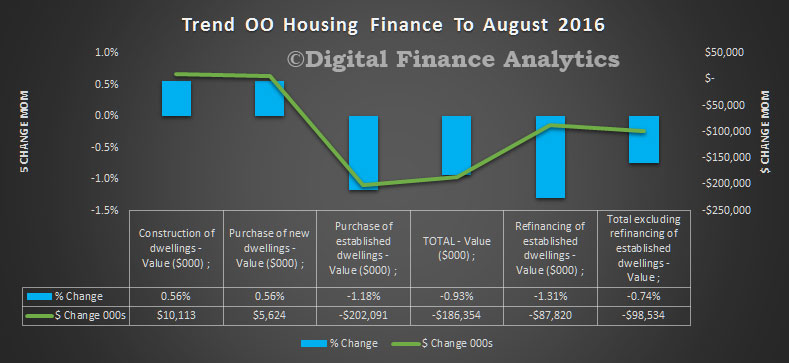
The latest edition (volume 23) of the mortgage industry report was released Oct 19. In this edition we look at mortgage discounting and refinance behaviour. This report takes input from the DFA household surveys, but is not directly available due to compliance requirements. However, the underlying DFA data is available via The Property Imperative, on request.

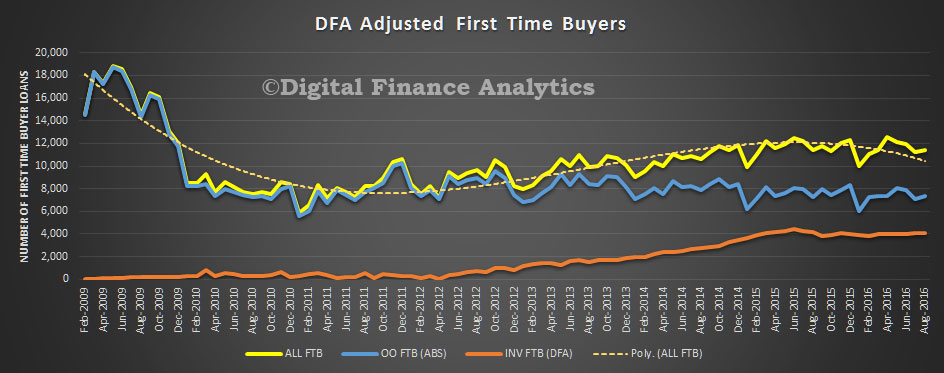
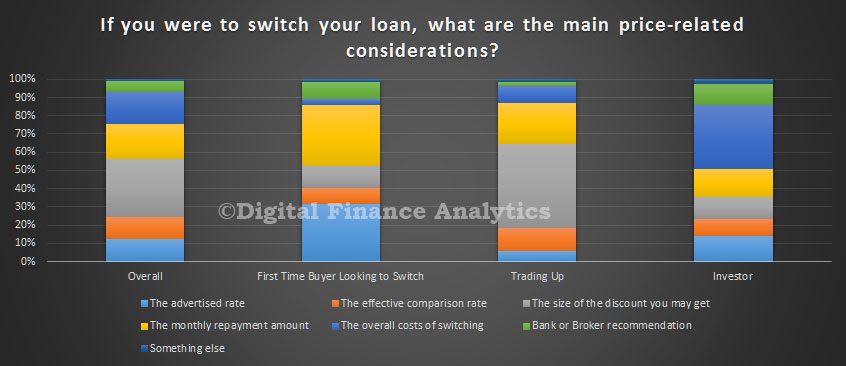
We looked further at refinancing behaviour. About a quarter of loans are churning each year. We asked specifically about the price drivers, and we found that more households are now aware of mortgage discounts, although first time buyer switchers were more concerned with the monthly mortgage repayment costs, whilst investors were more concerned with the overall costs of switching.

refinance-price-drivers
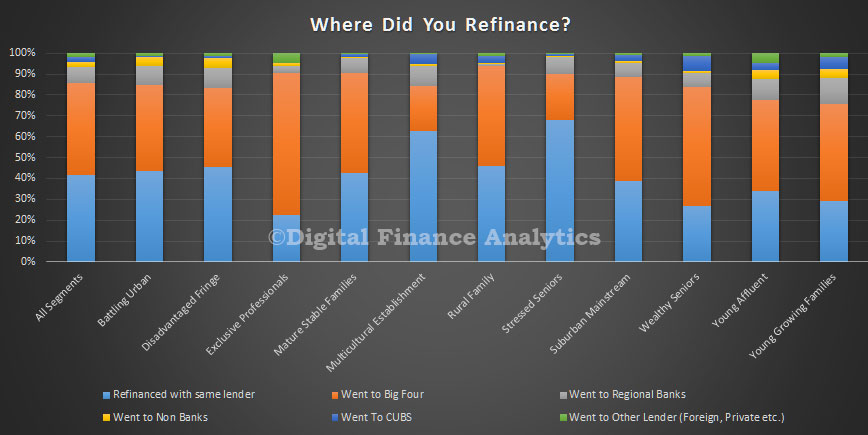
We found that most borrowers churned between the big four, though there were some variations.

refinance-lender-mapping
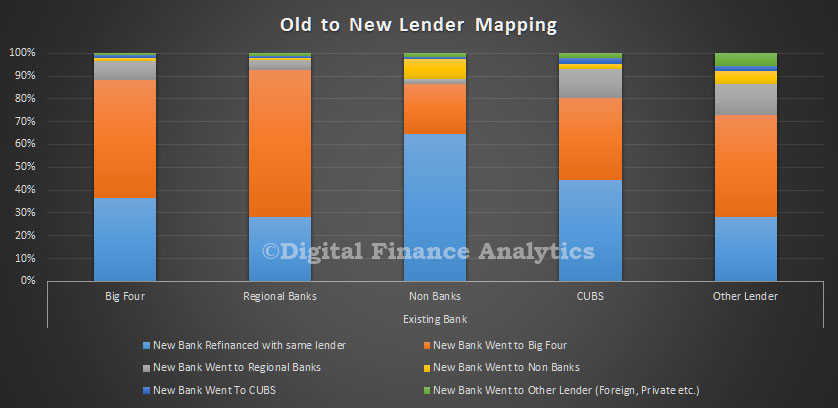
Across our household segments, we see some variations in refinance preferences, but the regionals, credit unions are other lenders are not picking up share. Indeed with more rational pricing behaviour now in edivence in the majors, and selective discounting, it looks like they will maintain their grasp on the market.

refinance-segment-lender-mapping
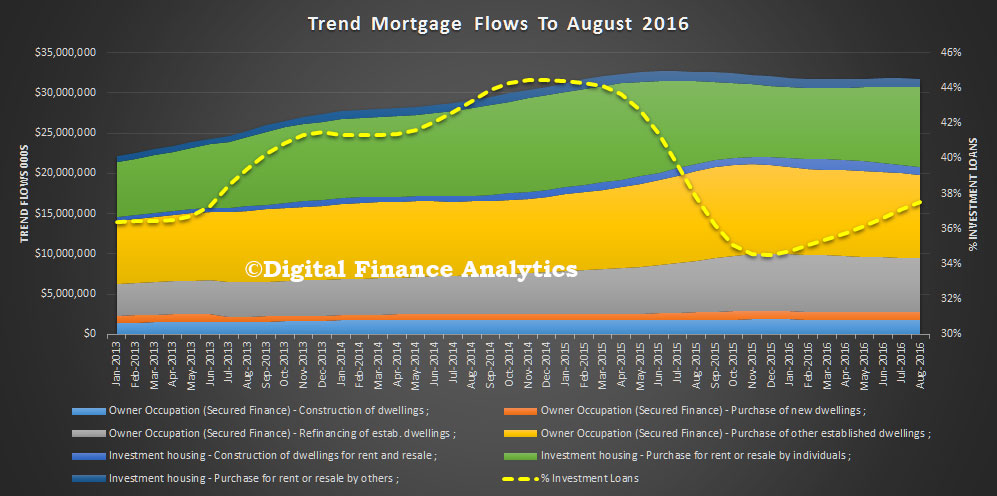
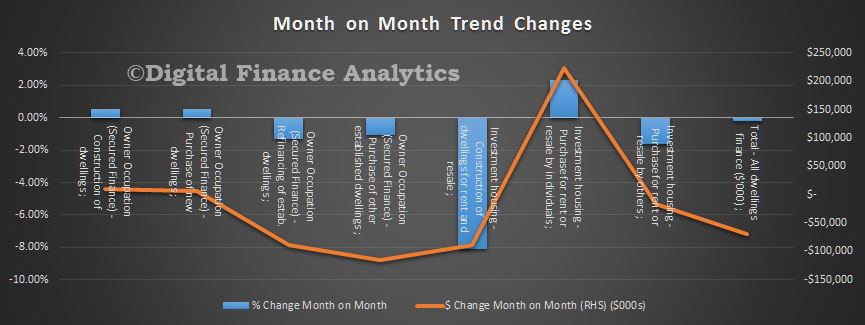
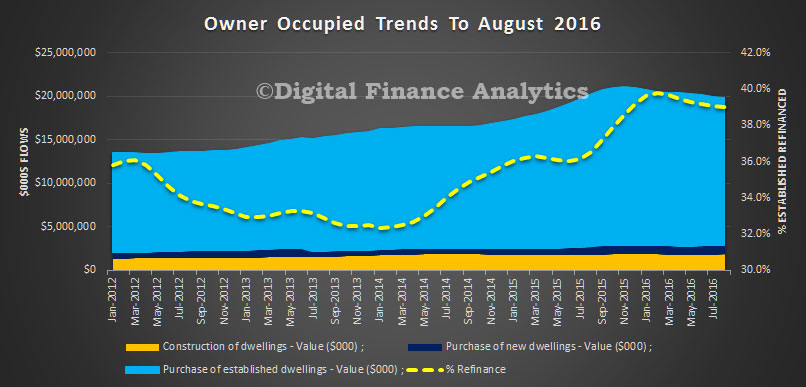
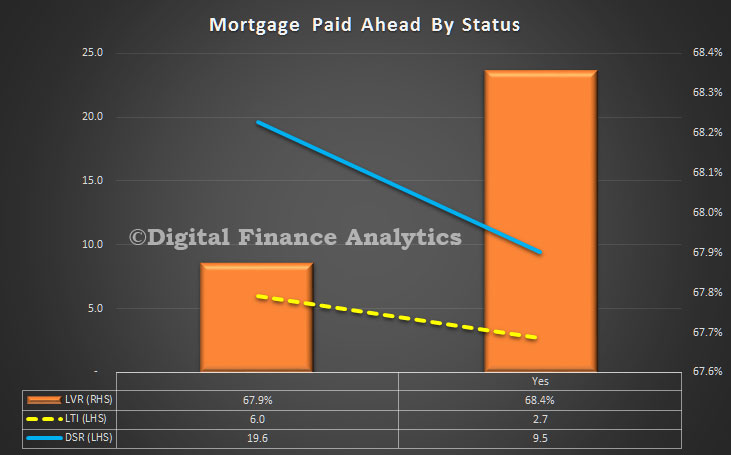
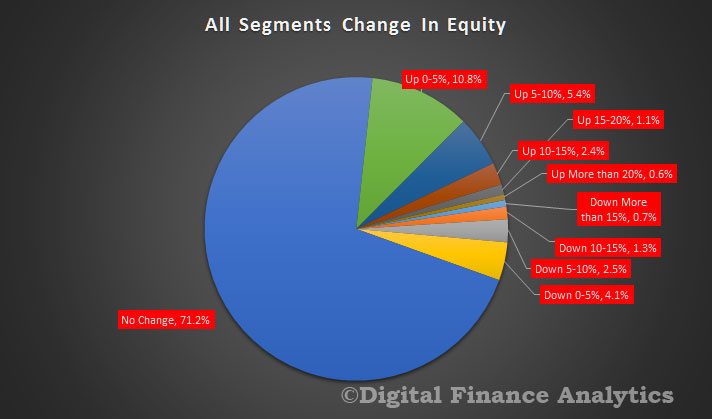
We also found that around 20% of those seeking to refinance are looking to extract equity from their existing property – to take advantage of rising home prices, compared with 8% to repaid capital.

refinance-equity-change
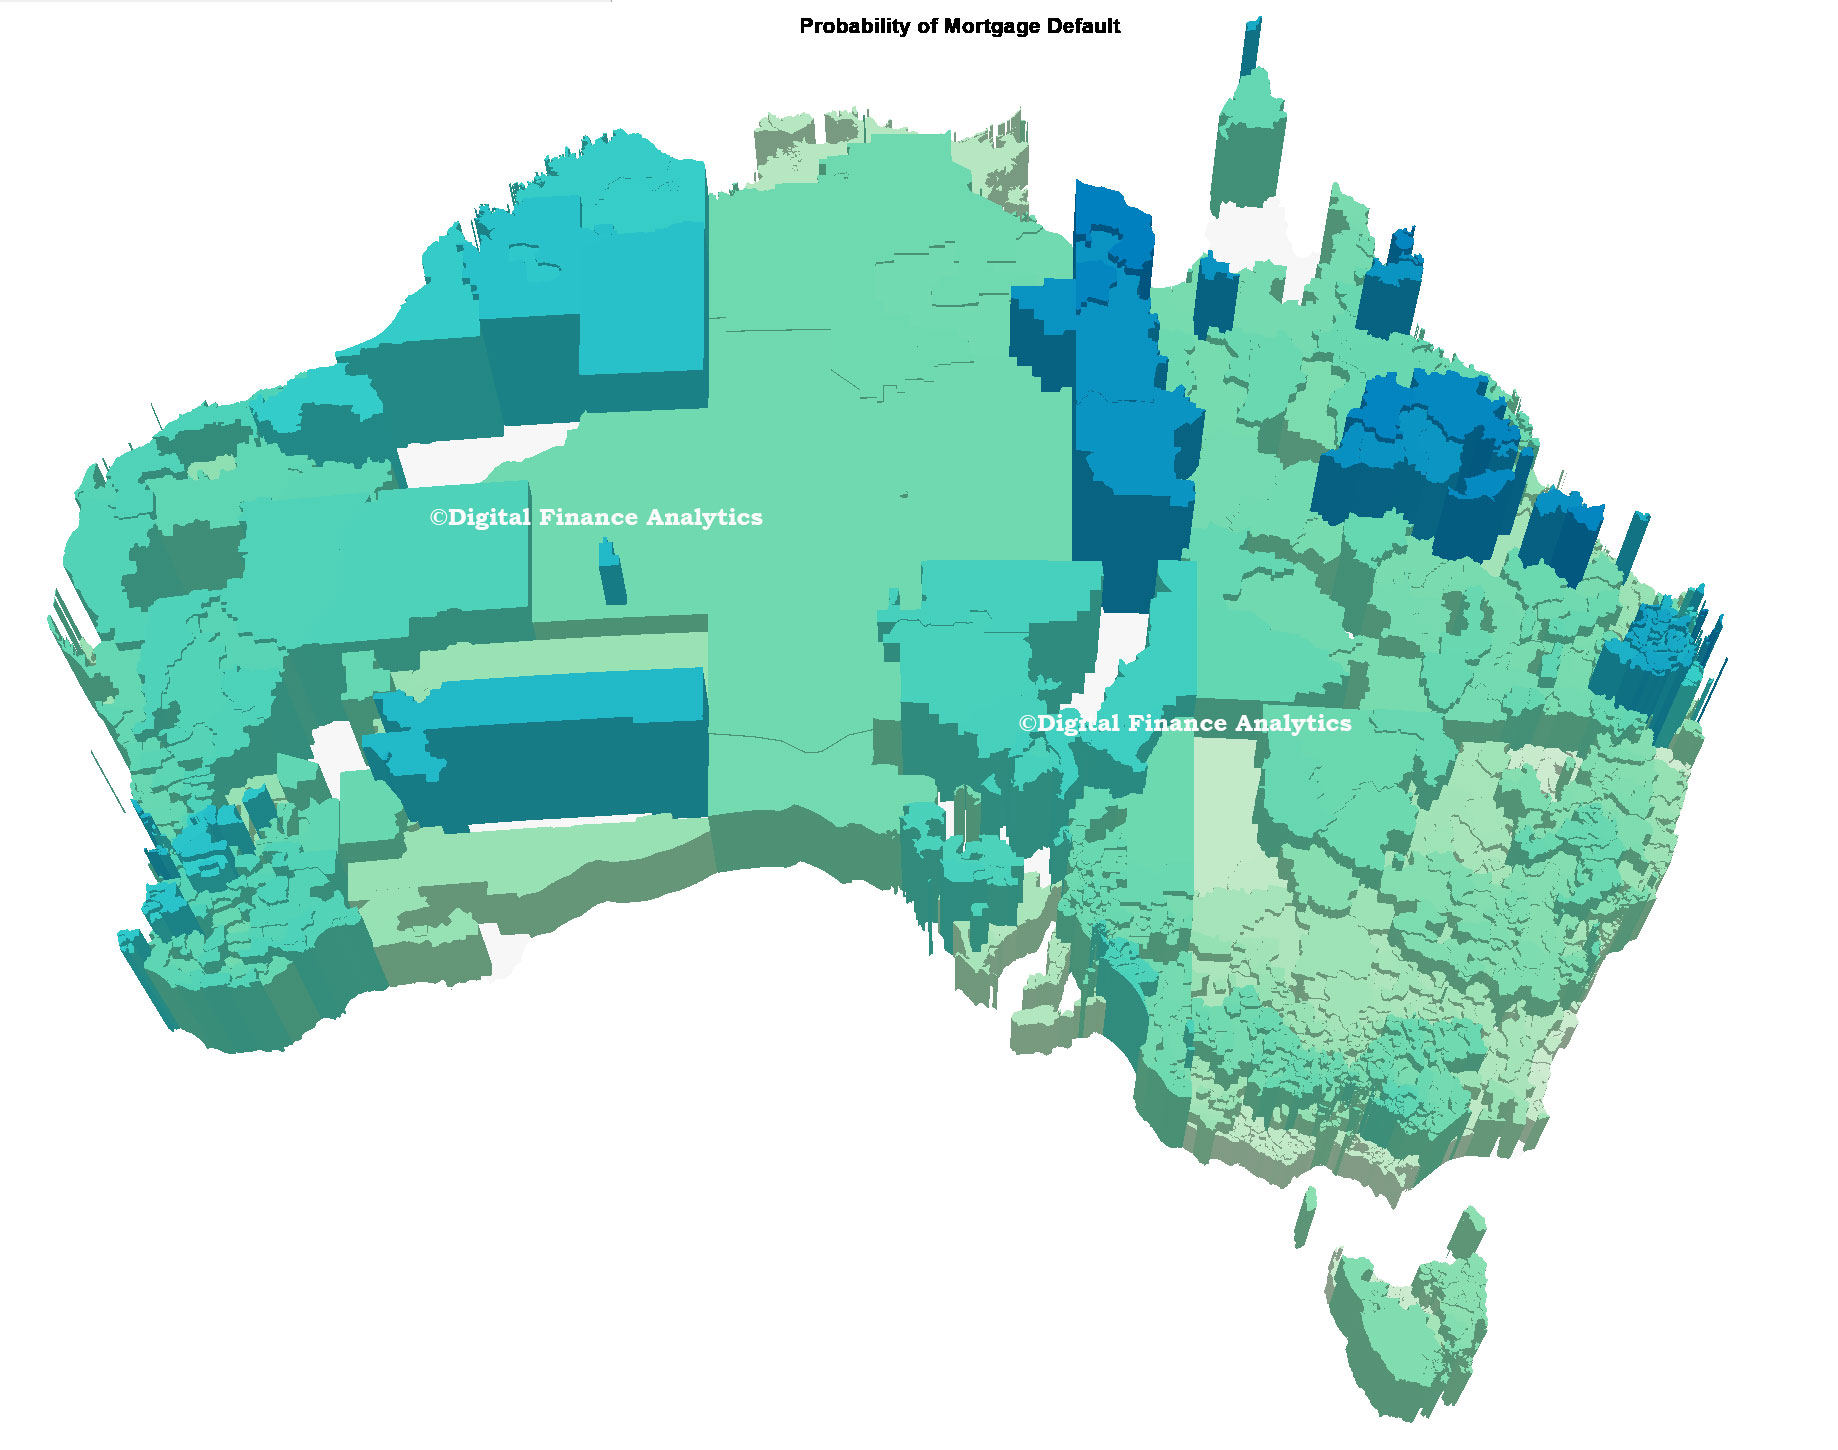
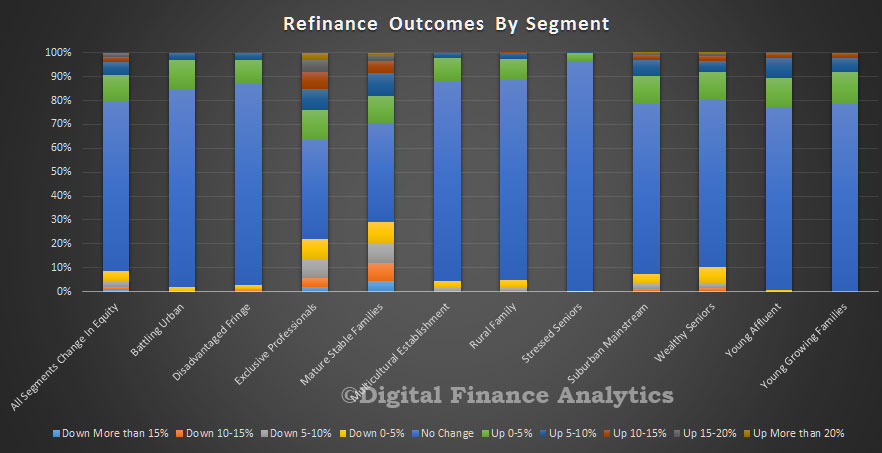
Again there are significant variations across the household segments.

refinance-segment-equityIn summary the JP Morgan report says:

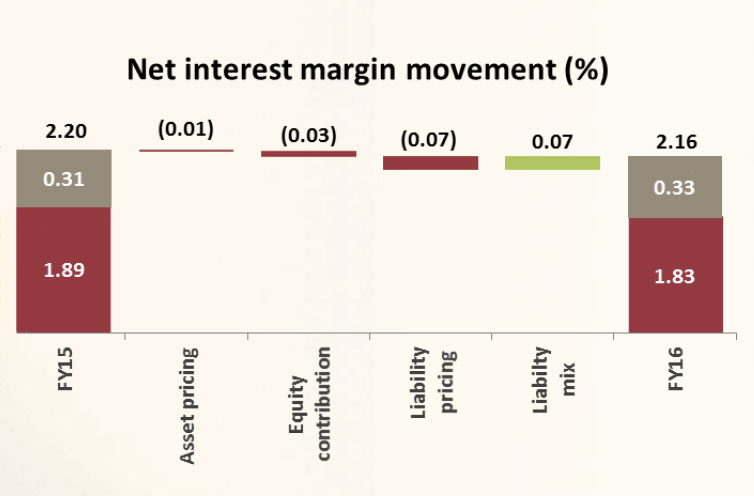
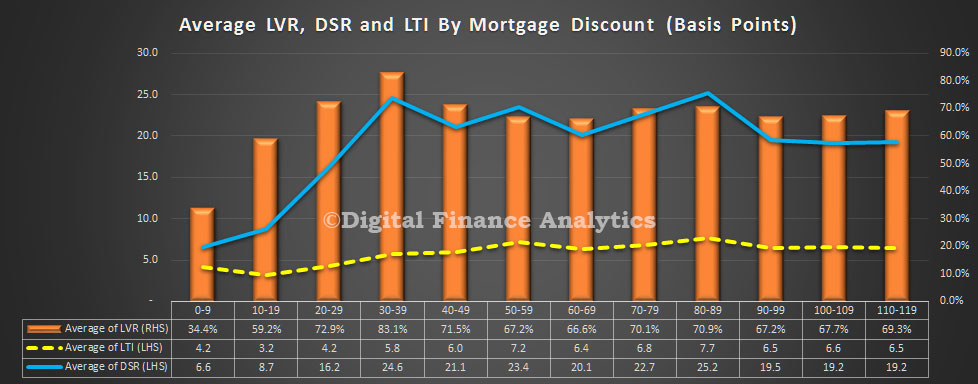
2016 has been characterized by unprecedented levels of discounting until recent weeks. Over the last 12 months, rather than preserving ROE (i.e. re-price to offset higher capital requirements), banks looked to preserve margin (but see the ROE dilute as a consequence of the higher capital allocation). Effectively, it is as though the industry saw the November 2015 re-pricing as a war-chest to go and buy market share through bigger front-book discounts, rather than remaining disciplined on price in order to preserve ROEs.

This volume of the Australian Mortgage Industry Report focuses on the recent evidence of more rational pricing, and the need for the major players in the mortgage industry to exhibit more pricing discipline. At the heart of the issue is the fact that incremental ROEs since the financial crisis (that is change in profit over change in capital) are around 12% – not much better than the cost of equity, and bordering on being insufficient to grow dividends.

Within this construct, we see mortgage ROEs having fallen from ~35%-40% down to ~25%, which leaves the remaining non-mortgage businesses delivering cost-of-equity style returns.

The implications for mortgage pricing are simple. Either margins need to be maintained, or dividends will come under pressure. With profitability across the non-mortgage portfolio not improving, mortgage ROEs can’t really ‘afford’ to go lower than they are today without having an impact on dividend sustainability. Effectively, we may have reached a ‘line in the sand’ on mortgage profitability.

jpm-oct-2016

First Australian “Tracker” Mortgage Launched

Auswide Bank (formerly Wide Bay Australia) has released a new ‘rate tracker’ style home loan, believed to be the first of its kind in the Australian market.

It is Australia’s 10th bank with a loan book of approximately $2.8 billion. Its most recent results (FY16) shows a statuary profit of $11.7m, down 11.8% on last year, and a net interest margin of 196 basis points, down 2 basis points on the prior year. Loan arrears rose from 0.96% to 0.99% in the last year. So like the other regionals, under pressure.

Given the fact that they will be funding their book mainly from deposits, the move may signal the start of a new front in the mortgage war. However, managing basis risk will be the big issue.

Bank-Cress

The RBA Rate Tracker home loan will track the movements of the Reserve Bank of Australia (RBA) cash rate. If the RBA shifts interest rates up or down, the interest rate attached to the home loan also moves by the same percentage.

The RBA Rate Tracker home loan has been launched with an attractive variable interest rate of 3.99%p.a. (Comparison Rate 4.01%p.a.) and provides both the customer and the bank with the certainty of a fixed margin over the RBA cash rate. The loan provides further certainty to borrowers as Auswide Bank will change the rate effective within two working days after an RBA cash rate change. The loan has a ‘floor’ – if the RBA cash rate falls to 0% or below in the future the customer will continue to pay the fixed margin.

The new loan is available on new owner-occupied home loans of $150,000 or more for purchase or refinance with an LVR of up to 80% and includes the ability to make additional payments and redraw.

There is a low upfront establishment fee of $300 and no ongoing monthly service fee; however a transaction account needs to be held by the customer with the bank.

Martin Barrett, Auswide Bank Managing Director said tracker mortgages are a popular loan product internationally particularly in Europe.

“The availability of tracker mortgages in Australia has been a topic at the current inquiry into the major banks having been highlighted by the parliamentary standing committee”.

Auswide Bank has an Australian Credit Licence and an Australian Financial Services Licence issued by ASIC and is an Authorised Deposit-taking Institution prudentially supervised by the Australian Prudential Regulation Authority. In 2013, the decision was made by Wide Bay Australia’s board of directors to convert to a bank. On April 1st 2015 Auswide Bank was launched.


The risks in Australia’s housing market shouldn’t be downplayed

From The Conversation.

The Reserve Bank of Australia (RBA) sees housing finance as a smaller danger than in the past, judging by its latest Financial Stability Review, but we aren’t back to happy days just yet. A number of economic indicators still show there’s cause for concern in the property market.

The review does acknowledge some problems in the apartment markets in Brisbane and Melbourne, but it sees major threats to the resilience of the Australian financial system overseas: examples are the rising debt levels in China, the low performance of European banks, the Brexit, and the impact of low milk prices on New Zealand farmers (with a possible feedback effect to Australian banks).

The review highlights Australian banks’ stronger capital buffers and compliance with toughened prudential standards from the Australian Prudential Regulation Authority (APRA). Because house price growth has moderated and mortgage borrowers are substantially ahead of their scheduled payments, the risk from mortgage lending is somewhat lower.

However, it’s surprising that the review doesn’t stress some aspects that are obvious.

What the RBA didn’t say

Although Australia hasn’t experienced the type of shock to the economy the United States did, due to the sub-prime mortgage crisis, there is substantial risk due to a large portion of mortgage loans being subject to interest-only periods of typically five years. Research for US home equity lines of credit finds the risk that people won’t be able to pay mortgage expenses increases substantially towards the end of flexible repayment terms, in particular during times of increasing lending standards.

Mortgage borrowers often have the expectation that they are able to refinance at the end of the interest-only term into a similar loan with a new interest-only period. However, this rollover is not possible in economic downturns when banks suddenly tighten their lending standards and and are likely to cut refinancing.

The RBA’s review shows that Australian banks have tightened their lending standards and have room for further tightening, but currently we do not see larger impacts on delinquencies. Current rates of people not being able to make their mortgage payments are low but may quickly change in an economic downturn. It’s also difficult to forecast whether this will change judging by medium- to long-term trends.

There might be other reasons why people might struggle to make their mortgage repayments. We have seen central banks following the European and US central banks in lowering interest rates and markets are expecting a reversal in the future. As most mortgage loans in Australia are at a floating rate this would imply that the largest relative payment increase will be to interest-only loans, should the RBA follow these leads.

In addition to this, Australia continues to enjoy low unemployment rates. This may change and lower the average income levels, putting more stress on people’s ability to pay mortgage loans.

Other risk factors at play in the property market

House prices continue to grow at annualised rates of approximately 10.2% and 9% in the largest cities Sydney and Melbourne. Housing price growth has slowed down, but prices are still increasing and new mortgages are underwritten based on house prices that are disengaged with national income levels. The growth rate continues to be above the historic averages and other developed economies that have experienced similar rate cuts.

Banks have relatively reduced interest only loans and high loan to valuation ratio (LVR) style loans. However, it is also clear that origins of high risk mortgages continue at relative high levels.

Australian Prudential Regulation, new mortgage loans for ADIs with greater than $1 bn of term loans

The fraction of interest-only loans has come down from 44% in December 2014 to 36% in March 2016. While this is a noticable decrease, more than a third of loans continue to be interest-only.

The RBA’s review argues that Australian mortgage borrowers are on average approximately two and a half years ahead of the scheduled payments. This argument does not take interest-only loans into account.

Prepayments are generally made into offset accounts which include a redraw facility and are generally used when new properties are used. In other words, these prepayments may be quickly depleted to increase leverage but also in situations when borrowers have difficulties making payments.

Dominance of housing loans on bank books

The largest problem of Australian banks remains the dominance of housing loans on bank books. Approximately 60% of total loans are for residential properties, and 36% of loans are business loans dominated by commercial real estate loans and loans to small and medium sized companies, which are often backed by the real estate of the business owner.

This over-concentration is the Achilles’ heel of the Australian banking system and hard to protect against. It’s a reflection of demand for bank loans in Australia and alternatives to bank lending available to large firms.

International financial markets may provide a solution, allowing banks to diversify and risk transfer via asset risk swaps. Unfortunately, these solutions have not been explored much in the past . The reluctance to do this is mostly based on the poor performance of overseas assets during the global financial crisis.

The RBA’s review further discusses the achievements under the Basel Committee on Banking Supervision to limit the systemic risk of financial institutions via increased regulation and higher capital buffers. The review further notes that no Australian bank is of global systemic importance.

However this is not a reason for complacency as the failure of one of the largest Australian banks would lead to a great shock to the Australian economy. A further concentration in the banking industry would make bank products more expensive than they would be in a competitive system.

Big four should offer rate tracker mortgages: ASIC

From Australian Broker.

Greg Medcraft, chairman of the Australian Securities and Investments Commission (ASIC), has thrown his support behind rate tracker mortgages, saying they should be introduced by the big four banks.

“These rate tracker mortgages are very popular overseas because the consumer knows there is a fixed margin earned by the bank over the life of the loan,” he said in an interview with the Australian Financial Review.

Investment-Pic3

“The problem in Australia at the moment is there is a double jeopardy with standard variable rate loans. You don’t know how your SVR will move and all the SVRs are not the same. I think the banks like the confusion in the market.”

Offering mortgages priced at a fixed margin above the RBA’s official cash rate would help eliminate this confusion, he said.

Medcraft’s comments – made prior to his appearance before the Standing Committee on Economics today – are at odds with those made by most of the heads of the major four banks made during last week’s parliamentary review.

The CEO of Westpac, Brian Hartzer, told the inquiry that tracker mortgages were “a recipe for a serious problem” for the banking industry.

“They’re fine when everything’s fine, but when things are not fine they become a real problem, and you can suddenly find that your cost of funds has spiked dramatically and yet you’re unable to reprice your loan book,” he said.

“Tracker mortgages are really quite fraught from a risk point of view and we saw this in the GFC in particular.”

While the CEO of CBA, Ian Narev, said there was no “specific objection” to these types of loans, the bank’s chief risk officer David Cohen said that tracker mortgages worked well when rates fell but not when they rose.

“The experience of customers and banks offshore has been that they haven’t worked so well when rates have risen again post GFC,” he said.

He pointed towards Lloyds Bank which offered tracker mortgages until 2014.

“It felt that a fixed rate, particularly in a rising interest rate environment, was actually a better deal for customers.”

NAB’s CEO Andrew Thorburn said that mortgages which tracked the cash rate would “raise a significant funding risk for us”.

“Our balance sheet, which is deep and wide, has got $200 billion of offshore funds which are not linked to the cash rate,” he told the inquiry. “So if we had too much business, and it was not priced correctly in the tracker portfolio, we are raising a significant risk for the bank.”

The only bank to be supportive of tracker mortgages was ANZ with CEO Shayne Elliot saying there was a “valid place” for the product in Australia.

“In fact, we have looked at it and we continue to look at it to see whether there would be a market proposition for us,” he said. “Our testing really comes down to ‘do we think that consumers would be attracted to it in sufficient volume to make it worthwhile?’”

Mortgage Lending Flows Slowed In August

The latest home finance data from the ABS to August 2016 shows that overall housing lending fell slightly, down 0.22% to $31.7bn, in trend terms. But you need segmented analysis to understand what is going on.

Lending for investment purposes rose by 1% to 11.9bn, 37.5% of all lending, up from 37.1% last month, whilst in owner occupied property land, total volumes fell from 55,301 to 54,600 (down 1.27%) and the total value of new loans was $19.8 billion, down from $20 billion (down 0.93%) the previous month.

abs-housing-aug-2016Looking at all trend home lending flows, investment lending borrowing for an existing property rose by individuals 2.3% to $9.8bn, and there were small rises in loans for OO construction and new dwellings.

abs-housing-aug-2016-mom

Owner occupied refinance still remains high, at 39% of existing OO loans, though the volumes are down a little this month to $6.6bn. This is more than 20% of all loan transactions (OO and INV), and up from 17% in 2013.

abs-housing-aug-2016-ooand-refLooking at the OO month on month movements, construction ($1.8bn) and purchase of new dwellings ($1bn) were both up, by 0.56%, showing that demand for, and lending for new property is still being met. However, the value of purchase of established dwellings fell 1.18% to $16.9 bn. Refinanced loans also fell, by 1.31% to $6.6 bn.

abs-housing-aug-2016-oo-deltaFirst time buyers are impacted by ABS revisions, but overall we see a lift in the number of FTB OO buyers, up 3.5% to 7,372. They also made a larger share of all buyers, at 13.4%, but still way below their peak in 2009.

We track FTB investors, who are not caught in the ABS statistics, and last month another estimated 4,061 when straight to the investment property sector, a rise of 3.4%. So overall the FTB sector in total was 11,434, up 3.5% on the previous month. You can read more about the FTB changes to the ABS data here.

The overall trend trajectory however is lower, despite record low interest rates.

ftb-aug-2016-allLoans for investment purchases, refinance, and loans for new property are still supporting the market, whilst momentum in the large existing market sector, refinance apart, is slowing.


Mortgage fraud ‘systemic’ in Australia, UBS survey shows

The ABC reports that mortgage fraud is “systemic” in Australia, with more than a quarter of recent home buyers admitting they misrepresented some information on their loan application.

The disturbing results come from a survey of 1,228 people who had taken out a mortgage over the past two years, conducted by investment bank UBS.

The key finding was that 28 per cent of people surveyed said their mortgage application was not totally factually accurate.

Of those who admitted misstating information, the bulk said their application was “mostly factual and accurate”.

However, one-in-20 mortgage applicants admitted that their loan application was only “partially factual and accurate”, while 2 per cent “would rather not say”.

Out of the people who misrepresented parts of their application, 14 per cent said they overstated household income, 13 per cent overstated asset values, 17 per cent understated their debts, more than a quarter understated living expenses, while over 40 per cent said “other” or would not say what they had lied about.

Around 12 per cent admitted to misstating information in multiple areas of their application.

“However, there was a correlation between borrowers who misrepresented their application and: those whose expenditure was broadly equal to their income; stated they are under financial stress; or have missed a debt payment.”

UBS added that, if anything, the survey was likely to understate the proportion of people who had fudged some part of their application.

“It is difficult to reject these findings, in our view,” argued the UBS analysts.

“If anything, we believe it is more likely these figures may understate the level of misrepresentation in mortgage applications as some respondents may not want to state they were less than completely accurate despite anonymity.”

Mortgage misrepresentations more prevalent with brokers

While the overall proportion of people who misstated information on their loan application was high, an even greater proportion who applied through a mortgage broker misled their lenders.

Almost a third of people who got their mortgage via a broker admitted they were not “completely factual and accurate” with their details. That compared to 22 per cent who applied directly through the lender.


The rate of applicants who admitted to being only “partially factual and accurate” was twice as high among mortgage broker customers as with direct bank applications.

While only 13 per cent of loan applicants who went through a bank and had misstated their details said their banker suggested doing so, the result was vastly different for mortgage brokers.

There was also evidence brokers were becoming more likely to advise clients to make misrepresentations.

“This was statistically significantly higher than the 24 per cent of respondents who had misrepresented an application on the broker’s suggestion in 2015,” UBS added.

The detailed study undertaken by UBS backs a report based on shadow shopping in western Sydney by Variant Perception’s Jonathan Tepper and covered in the Financial Review earlier this year, entitled The Aussie Big Short.

UBS said this should trigger alarm bells within the banks.

“We believe banks need to tighten underwriting standards via the broker channel, even at the expense of near term market share,” it warned.


Bendigo Buys High LVR Loans

Bendigo and Adelaide Bank has agreed to acquire a portfolio of approximately $1.35 billion of standard residential loans based in Western Australia, from the wholly owned Western Australian Government entity Keystart Housing Scheme Trust by equitable assignment. The portfolio is selected from the total loan book of approximately $4 billion.

Bendigo has had net interest margin pressure for some time, and this might be seen as a way to help address the hole. The question however is asset quality and net returns on the transaction over time.Ben-FY16NIM

The bank says they have selected customers in the portfolio have on average five years of repayment track record and no arrears. The portfolio is approximately $1.35 billion residential loans and 6,000 customers. The purchase price at a premium of 0.2% or approximately $2.7 million. The average loan size is approximately $225,000, all variable rate owner occupied loans, no interest only loans. The weighted average seasoning is 64 months and the weighted average LVR is 84%. None are covered by Lender’s Mortgage Insurance. Geographically, 67% are in greater Perth, 33% regional Western Australia. They have limited exposure to mining by geography and occupation, with 0.4% of loans domiciled in Pilbara/Kimberley. Keystart will continue to service the customers on behalf of the Bank. To fund the purchase they also announced an equity raising to be launched in October.

The banks said “The acquisition complements our existing business in Western Australia and improves our geographic diversification by increasing the proportion of our loan book in Western Australia from approximately 11 to 13 percent. We will also have potential to provide 6,000 Keystart customers with a range of complementary products and services”.

Keystart customers are typically first home buyers who do not have sufficient initial savings for a deposit. The Keystart loan is designed to be a transitionary product, with approximately 80 to 90% of Keystart customers refinancing to a mainstream lender over time. They are full documentation owner occupied loans. They have approved loans for approximately 60,000 households for more than 27 years. Their total loan book is approximately $4 billion with approximately 18,000 customers. They have approximately 18% of the first home buyer market in Western Australia, with a “strong and consistent record” of low arrears and loan losses.

Whilst this makes sense in terms of geographic expansion and book growth, the higher LVR nature of the book will require higher risk weights to be applied. A quick estimate suggests it will provide a small lift to earnings, but only if the defaults remain low. Given the rising level of arrears in WA and slowing house prices, this may hit the loan performance later.

Probability of Mortgage Default – Latest Estimates in 3D

As we finish our series on deep analysis of mortgages by LVR, DSR and LTI, we have incorporated the latest household survey data into our probability of mortgage default modelling by post code.  The national average is 1.3%, but it rises to more than 3% in some places.

We take the DSR, LTI and LVR data, and overlay the mortgage stress and state-level economic indicators to estimate the likely relative probability of mortgage default.  We also overlay assumptions on the RBA’s cash rate, expected mortgage rates, income growth and employment. This all gets mashed to derive a percentage estimate of default by post code.

We have mapped this into a 3D view, which clearly shows that the higher levels of default in coming months will emanate from QLD and WA, as the mining sector rotation continues. On the other hand, NSW and VIC are relatively benign as ultra-low interest rates continue to protect many households with large mortgages. The greater the height of the post code, the higher the risk of default.

prob-default-sept-2016One striking final conclusion. If you compare this picture with the DSR 3D view from yesterday, you will see that DSR and probability of default are only somewhat linked. There are a bunch of other factors which shape the likely loss outcomes.


Debt Servicing Ratio 3D Mapping Highlights Mortgage Hot Spots

Continuing our detailed analysis of mortgage LVR, DST and LTI across Australia, using data from our houshold surveys, today we feature a 3D map of relative Debt Service Ratios (DSR) by postcode. There are some interesting variations. The greater the height, the higher the DSR.

As we said in our earlier post, DSR is is the ratio between gross household income and the amount paid on the mortgage. More specifically, the DSR is defined as the ratio of interest payments plus amortisations to income. As such, the DSR provides a flow-to-flow comparison – the flow of debt service payments divided by the flow of income. We think the DSR is an important lens to look at households debt footprint, but the ratio is highly sensitive to interest rates because as interest rates fall, the ratio improves. Current DSR ratios are often seen as reasonable because of the current ultra low rates, but of course that tells us nothing about the impact of rising rates later. The average DSR is 16.8, but there is a very wide spread.

oz-dsr-sept-2016


All Lenders Are Not The Same

In the latest of our series on deep home loan segmentation, using DSR, LTI and LVR we compare the averages across a number of lender portfolios. The chart shows the average from a range of 20 or so lenders in our surveys, including banks, non-banks, credit unions and building societies. We have selected lenders to give an indication of the spread of the results, but have masked the individual brands. For some, the average LVR in the portfolio is sitting north of 80%, whilst others are below 60%. The highest DSR is averaging at 32, whilst the lowest in 7.8. The highest LTI is on average 7.3, compared with 2.6 for the lowest.

lender-dsr-dtiThese findings underscore that underwriting criteria do vary, risks in the portfolio will also vary, and the mix of business does change across the market.

Another view is the average loan value in the portfolio. Once again we found a surprising range of values, from just below $600k, down to $180k. Many factors influence the average of course, including lending policy, type of loan, time on book, how much households have paid ahead, and other factors.

lender-portfolioHere is a split of average balances by lender of loans paid ahead and those who are not.

lender-portfolio-paid-aheadWe see that households who are paying ahead generally have lower loan balances (reflecting differences in the LVR, LTI and DSR status). This chart provides more insight.

lender-portfolio-paid-ahead-compThose who have paid ahead have a lower LTI (2.7 compared with 6.0), lower DSR (9.5 compared with 19.6) but a slightly higher LVR. The portfolio averages are LTI 5.1, DSR 16.9 and LVR 68%.

Another interesting lens is the mortgage discounts being achieved by households, compared with LVR, LTI and DSR. It appears the best discounts are being made on LVR’s below 80%, but LTI and DSR have less bearing on the achieved rates. A low DSR or LTI does not necessarily translate into a bigger discount – something which lenders may want to reconsider, given the relative risks involved.

discount-dsr-dti