ING Direct Throttles Back Apartment Lending

From Australian Broker.

Non-major lender ING Direct has announced changes to its underwriting guidelines relating to apartments and unit dwellings. In a note sent to mortgage brokers on Friday, ING announced restricted LVRs on unit dwellings with an internal floor space of less than 60 square metres.

Where a proposed security property has an internal floor space of less than 60 square metres, excluding balconies and car spaces, and is less than 5 years old, the non-major will limit the maximum LVR on the loan to 70%.

N-SydneyIn addition, where a proposed security property has an internal floor space of greater than 50 square metres and less than 60 square metres, excluding balconies and car spaces, and is older than 5 years, ING will limit the maximum LVR on the loan to 80%.

According to data from CoreLogic, there are 92,102 new units set for completion over the next 12 months with that figure rising to 231,129 over the next 24 months. Sydney and Melbourne have the greatest increases in stock over the next two years, with 81,696 and 80,503 units to be completed respectively.

Home Loan Churn Up, But Not Away

Currently more than 26 percent of the home loan lending book is being churned each year, reflecting strong refinance demand, low rates and massive marketing campaigns. So it is interesting to look at the trend data, especially in the light of the New Zealand Reserve Bank data we discussed yesterday, which indicated 35 per cent of loans there are churning annually.

Data from the ABS enables us to analyse the proportion of the home loan book which, by value is churned each year. To do this we compare the loan stock data, with the loan flow data, by total value pools. Here are the result for the ADI’s.

Churn-TrendThe stock figure takes account of new loans written, refinanced and repaid. The flow data shows us the new loans written. So we see a rise in churn from 2012, moving from about 20 per cent to more than 26 per cent. We also see a slowing turn in recent months, suggesting perhaps that the refinance drive has peaked. That said, there are a number of marketing campaigns suggesting that borrowers should refinance now if their mortgage rate does not have a three in front of it! On average, households with a loan of more than a year old would do well to check their rate.

All things being equal, you could say that the average loan is under four years, though in the real world, there is diversity, with some loans turned over every one to two years, and others retained for a much longer term.

What is also striking though is that in the 2000’s churn moved up from around 13 per cent to reach a peak of 39 per cent prior to the 2007/8 GFC. This rise in churn can be mapped to the rise of mortgage brokers in Australia (whilst the correlation could be coincidence, we suspect there is a link) as many brokers were on commission structures without claw-backs, with upfront commissions more generous that tail commissions. Changes in regulation and commission structures made the churn harder to execute later.

Still a quarter of the book turning over annually is pretty amazing, considering all the activity (and fees etc.) which are generated. It also suggests to me that bank’s should be thinking much harder about retention strategies.

NZ Housing risks require a broad policy response

Growing imbalances in the housing market require policy action on a number of fronts, New Zealand Reserve Bank Deputy Governor Grant Spencer said today. In an excellent speech he draws important links between the elements driving house prices, and also underscores the limits of the banks range of options, especially considering the target inflation range of 1-3%.

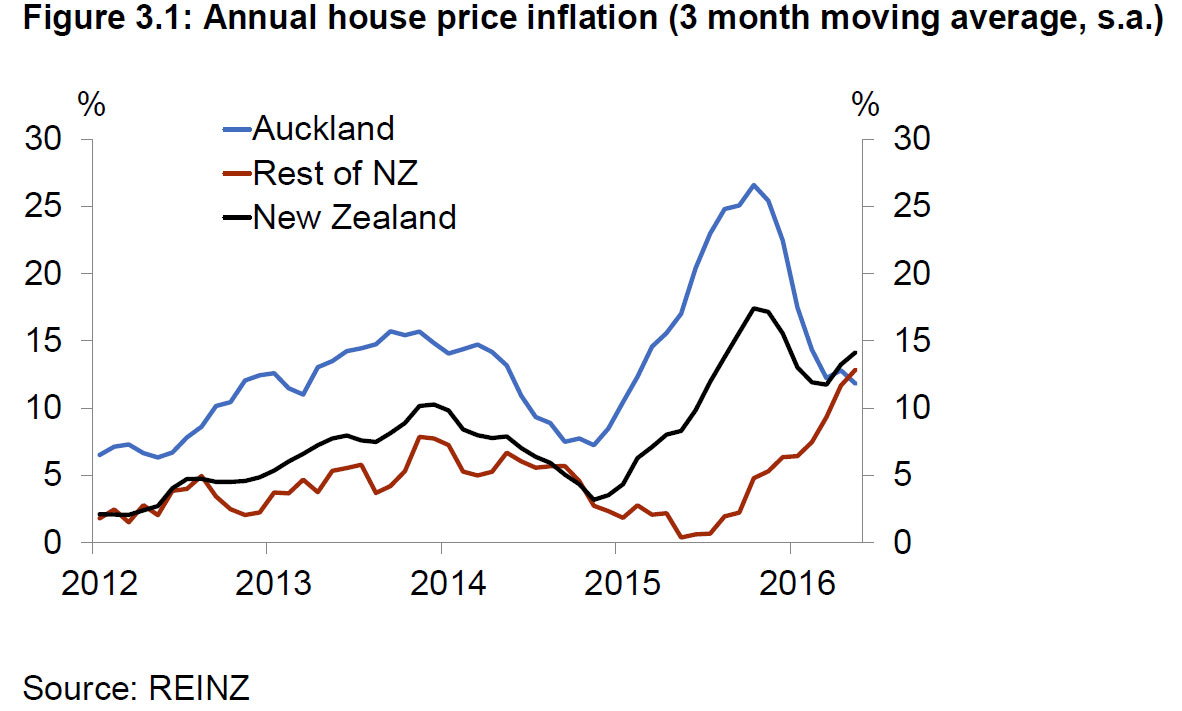
New Zealand is experiencing a housing market boom. House prices are increasing at 13 percent per annum nationally, and at 15-20 percent in Auckland and close-by regions. Evidence from housing cycles in several advanced economies suggests that the longer this continues, the more likely there will be a severe correction.

Speaking to the Wellington Branch of the New Zealand Institute of Valuers, Mr Spencer said that a range of factors had contributed to strong demand for housing, including record low interest rates, rising credit growth, and population increases.

While housing demand has been strong, the housing supply response has been constrained by rigid planning and consent processes, community preferences in respect of housing density, inefficiencies in the building industry, and infrastructure development constraints around financing and resource consents.

When the Bank had introduced LVR restrictions in 2013, they saw some markets slowing, but “House price pressures have re-emerged in Auckland following an easing in late 2015 and have also strengthened across other regions”.
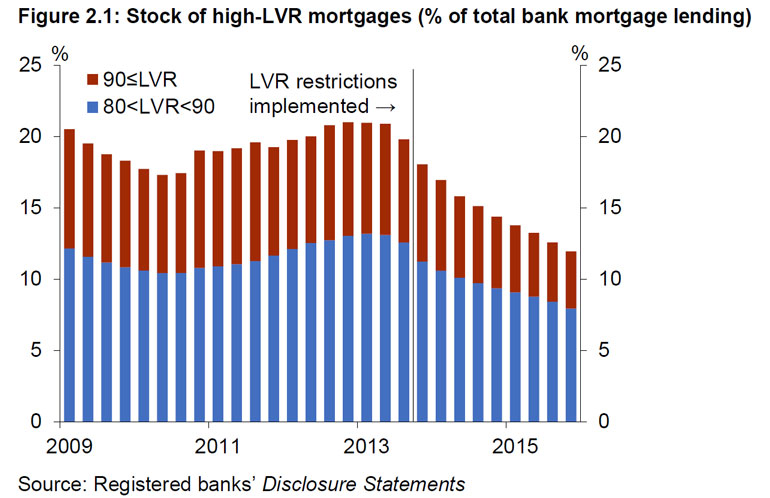
NZ-HousesNew Zealand house price inflation began to accelerate again from around March 2016 as demand pressures intensified in Auckland. In the meantime, other regions were contributing to higher national house price inflation from mid-2015, particularly those areas adjacent to Auckland. Most regional centres are now experiencing annual house price inflation in excess of 8 percent. Similarly, sales activity increased across the country in the first half of 2016. Reflecting the underlying housing shortage, new listings have remained flat. Listings as a proportion of sales are now 40 percent below the previous low seen at the height of the pre-GFC boom in 2007.
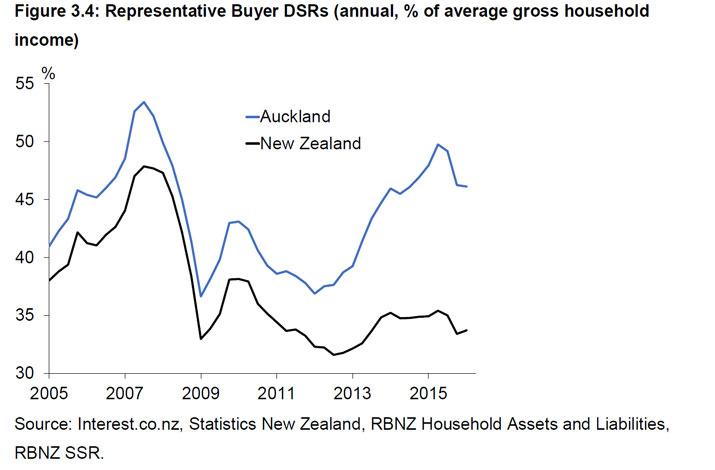
NZ-Housers-23He also highlighted an increase in investor purchases, and significant mortgage refinance, including increased interest-only and high debt-to-income lending. New mortgage commitments are also elevated, running at an annual rate of 35%. Debt servicing ratios are also elevated.
NZ-Houses-3Supply is not meeting demand he concluded. This is a recipe for potential disaster.

The longer the boom continues, the more likely we will see a severe correction that could pose real risks to the financial system and broader economy.

Mr Spencer said a broad range of initiatives is necessary to increase the long-term housing supply response, particularly in Auckland, and to help ensure housing demand is kept in line with supply capacity.

The Reserve Bank has no direct influence over supply, but can influence housing demand through the credit channel.  In this regard, we see the Reserve Bank as part of a team effort.

A dominant feature of the housing resurgence has been an increase in investor activity, which increases the risk inherent in the current housing cycle.

The Reserve Bank is considering tightening Loan-to-Value Ratios (LVRs) further to counter the growing influence of investor demand in Auckland and other regions, and to further bolster bank balance sheets against fallout from a housing market downturn.  Such a measure could potentially be introduced by the end of the year.

Limits on Debt-to-Income ratios (DTIs) might also have a role to play but would be a new instrument that would have to be agreed by the Minister of Finance under the Memorandum of Understanding on Macro-prudential policy.  Further investigation of this option will be undertaken.

A third option is a housing capital overlay. The Reserve Bank has already indicated that it will be conducting a full review of bank capital requirements over the coming year.

Consideration might be given to further reducing the tax advantage of investing in residential housing. Supply side issues also need attention. But much of this lays beyond the remit of the Central Bank.

He concluded that the causes of the imbalances are complex with a number of important drivers on both the demand and supply side. Addressing these imbalances will require policy action by a variety of agencies on a number of fronts. The underlying housing shortage needs to be urgently addressed, particularly in Auckland where population growth continues to outstrip housing construction. A step up in supply is required and finalisation of the Auckland Unitary Plan will be a key opportunity to facilitate such a step.

On the demand side, the key drivers are population growth and easy credit. The low cost of credit is making higher debt levels affordable, particularly for investors who can deduct interest costs from taxable income. Residential investors are accounting for an increasing share of house sales and new mortgage credit.

The Bank’s interest rate policy must have regard to financial stability concerns, but the global environment is likely to keep interest rates low for some time yet. Macro-prudential policy can assist in containing the growing risk to financial stability as the current housing market reaches new extremes. In light of the growing risk, the Reserve Bank is closely considering measures that could be progressed in the coming months.

Former AUSSIE mortgage broker false loan applications

ASIC says a former mortgage broker with AHL Investments Pty Ltd (trading as Aussie), has admitted through his solicitor to eighteen charges brought by ASIC. The charges related to the submission, by Mr Nair, of loan applications and supporting documents which he knew contained false information, to secure approvals for home loans from Westpac, National Australia Bank, and ANZ.

ASIC’s investigation found that between September 2012 and June 2014, Mr Nair submitted eighteen loan applications totalling $5,594,559 containing false borrower employment documents. Of the eighteen loan applications, twelve were approved and disbursed, totaling $3,721,684.

Mr Nair received commission on those twelve loans of $7,583.49. In addition Mr Nair received cash payments totalling $2,500 from two of the loan applicants upon approval of their loan applications. Mr Nair therefore received a financial benefit of $10,083.49 as a result of the approved loan applications.

The eighteen loan applications ranged in value from $10,000 to $490,875.

Mr Nair appeared before the Downing Centre Local Court and through his solicitor admitted to providing documents in support of loan applications that were false or misleading.

Mr Nair next appears  in court on 30 August 2016 for sentencing

The Commonwealth Director of Public Prosecutions (CDPP) is prosecuting the matter.

Background

Mr Nair was authorised to provide credit services as a credit representative to consumers from 1 July 2010 to 7 July 2014, when Aussie terminated his authorisation.

Mr Nair received his commission through Smee & Pree Nair Enterprises Pty Ltd (ACN 091 014 756) a company controlled and owned by Mr Nair.

Mr Nair was charged by ASIC under section 160D (and the former section 33(2)) of the National Consumer Credit Protection Act 2009 in relation to his conduct whilst he was engaging in credit activity on behalf of Aussie. Section 160D (formerly section 33(2)) makes it an offence for a person engaging in credit activities to give false or misleading information or documents to another person. He appeared in Court and pleaded guilty to the charges on 5 July 2016.

Mr Nair faces a maximum penalty of one year imprisonment or a fine of up to 60 penalty units (which in the case of sequence 1 equates to $6,600 and in the case of sequences 2 to 18 equates to $10,200), or both, for each charge.

ASIC targets misleading Chinese language home loan advertising

An ASIC review of advertising targeting Chinese speaking home buyers has prompted four mortgage broking firms to change their home loan advertising.

The mortgage broking firms which published the advertising are:

  • Ace Mortgage Market Pty Ltd (also known as 袁翹新會計師),located in Parramatta, NSW;
  • Aus Realty Group Pty Ltd (also known as 澳人信貸),located in Hurstville, NSW;
  • Apex Finance & Mortgage and its business owner (also known as 聯通信貸), located in Burwood, NSW; and
  • Trans Australia Mortgage Finance Pty Ltd (trading as Apple Home Loans, 全盛信), located in Burwood and Chatswood, NSW.

The range of concerns contained in the advertisements targeting Chinese speaking home buyers included:

  • representations in Chinese such as ‘lowest fixed rate’ and ‘no proof of income’ – which may be false and misleading statements, or indicate a breach of the responsible lending obligations,
  • heavy reliance  on disclaimers (such as ‘terms and conditions apply’) that did not explain qualifying terms and conditions in the same advertising. Also, promoters tended to advertise benefits in Chinese language, but stated the disclaimers and qualifications in English, when the advertising was aimed at non-English speaking consumers,
  • failure to disclose the required comparison rate when quoting an annual percentage interest rate,
  • failure to  disclose the required warning about the accuracy of the comparison rates, and
  • failure by their promoters to regularly review the advertisements  to ensure accuracy and compliance with the law.

The specific concerns identified in relation to each company are outlined further below.

ASIC Deputy Chair Peter Kell said, ‘The Australian Consumer Law applies to all advertising, including advertising in foreign languages. Consumers who are unable to understand written English are likely to be more reliant on advertising in their native language when in need of a financial product. Promoters should ensure that their advertising is up to date and complies with the law. If the majority of the advertising is in a foreign language, the warnings, disclaimers or qualifications should be prominently disclosed in the same advertising and explained in that same language.

‘ASIC will continue to monitor all forms of advertising, including advertising targeted at non-English speaking consumers’, Mr Kell said.

RBNZ Enhances Mortgage Reporting – 40% New Loans Interest Only

The New Zealand Reserve Bank has introduced new statistics on residential mortgage lending by payment type (i.e. interest-only and principal-and-interest). ‘Investor’ and ‘owner-occupiers’ are defined by the intended use of borrowed funds. A particular loan application may include a portion of both interest only and principal-and-interest payment terms. Figures in the new table represent the balance of new and existing lending for each payment type, not the number of loans.

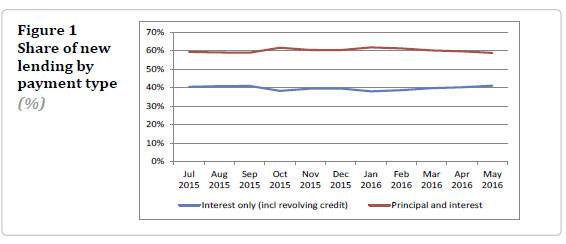
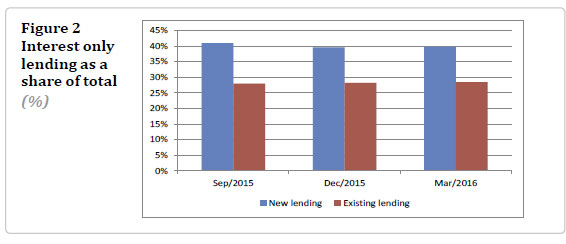
In May 2016, almost 60 percent of all new mortgage lending was on principal-and-interest payment terms, while 40 percent was on interest-only payment terms. These proportions have been fairly stable since July 2015 when the data was first available. RBNZ-Int1Interest-only loans tend to convert to principal-and-interest loans after a period of time. In March 2016, 40 percent of new lending was on interest-only payment terms. However on the banks’ loan books only 28 percent of all existing mortgages are on interest-only payment terms. These proportions have been fairly steady over time.

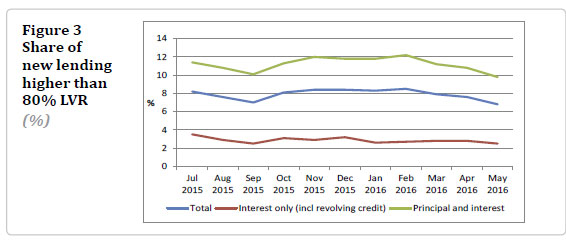
RBNZ-Int2Interest-only lending is less likely to be high loan-to-value ratio (LVR greater than 80 percent) compared to principal-and-interest lending. The proportion of high LVR new lending has
declined slightly for all payment types since data was first available in July 2015. The portion of high LVR lending for all existing mortgages is somewhat higher than for new lending (12.9 percent compared to 7.9 percent in March 2016) but this has also been declining over time. The lower ‘high-LVR’ portion on new lending is due to the LVR restrictions, which will gradually filter through to existing lending as new lending is added to the banks’ loan books.

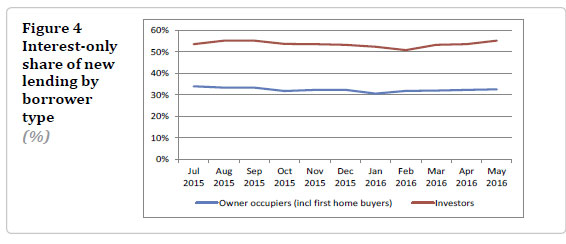
RBNZ-Int3In May 2016, about 55 percent of new lending for investor purposes was on interest-only terms compared to about 33 percent for owner-occupier purposes.These proportions have
been fairly steady over time. Only 1 percent of interest-only lending for investor purposes is above 80 percent LVR and this has been declining over time.

RBNZ-Int4

The Changing Face of the Non-Bank Sector

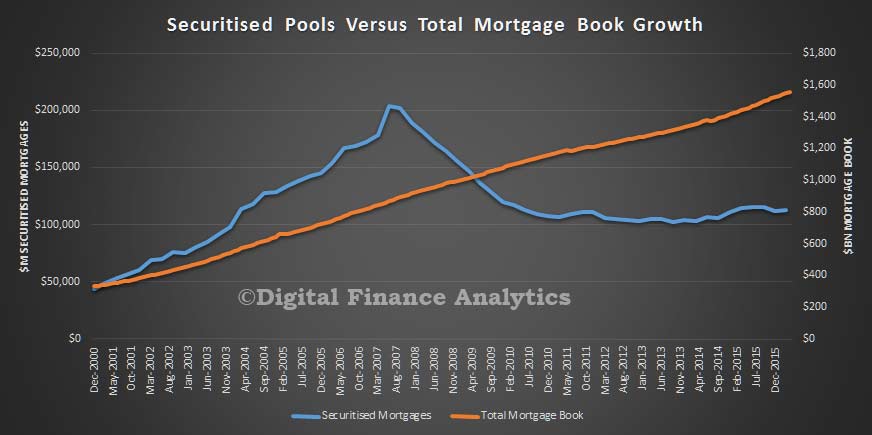
The prospective sale of Firstmac underscores the dilemma for Non-Banks operating in the current environment. Pre-GFC, most were able to work a very effective Residential Mortgage Backed Securitisation (RMBS) model where bundles of loans were packaged up and sold to investors, many of whom were offshore. Then the GFC hit. As a result the securisation markets froze and funding all but stopped. It has hardly recovered.

Mortgage-BookIn this chart we compared the assets of securitised pools with the total mortgage loan growth in Australia, and it starkly shows the changes post the GFC. We used data from RBA and ABS to generate the data. As a result, the share of mortgages written by banks have lifted from 70% to well above 90%. Banks also have looked at other funding routes, (for example Bendigo Bank have moved from 20% to 6% RMBS, and this has created a capital headwind, so they will most likely focus on senior funding), because costs of securitising is still higher than before the GFC, when the Non-Banks had a significant funding advantage. Banks also are now subject to tighter capital rules for securitised pools.

Here is the latest data on issuance from Macquarie.

In addition, most deals which are done are in Australia, as the global demand for securitised paper is still well down as shown by this chart. Most deals now done to institutional investors in Australia, in long term instruments. We also see a rise in direct placements.

Mortgage-Book-LiabSo, Non-Banks need alternative models to make their business work. Those who survive do so on the back of funding from investors, (which include some of the major banks, as well as retail super funds and sophisticated individuals). They also find it hard to compete in the current low interest rate environment making “meat and potato” loans, because the margins are compressed. As a result they will be looking for niche markets, such a low documentation loans, jumbo loans, investment loans, and credit impaired loans. Here they have an advantage as they are not under the APRA 10% speed limit for investment loans, and do not have to hold capital against these loans under the Basel III arrangements. They are merely answerable to ASIC.

So we expect Non-Banks to operate in niche markets, funding their business from investors. We also expect to see more sales and consolidation.

Home Lending Sags, Or Does It?

The latest data from the ABS on home lending for April 2016 indicates that overall lending flow fell in trend terms by 0.3%. But within that, owner occupied lending fell 0.5% while investment housing commitments rose 0.2%. In other words, we are seeing a rotation back towards the investment sector. Since then, several banks have relaxed their investment lending underwriting criteria, and have started to offer bigger discounts.  The picture is quite complex.

In seasonally adjusted terms, the total value of dwelling finance commitments excluding alterations and additions fell 1.8%. But we will stick to the trend data, which irons out some of the bumps.

Looking at the overall stock of loans, it rose again to $1.49 trillion, we see that investment loans comprise 35.6% of all loans, still high

ABS-Home-Lenidng-April-2016-Stock-Inc-INVLooking at the monthly flows, we see a fall in owner occupied new loans by value, and a small rise in investment loans. The momentum in the refinance sector has slowed a little, but rose as a proportion of all loans.

ABS-Home-Lenidng-April-2016-Trend-Flows-Inc-INVTurning to first time buyers, we a rise in the number of new owner occupied and investor loans, together the show around 10,000 new first time buyers entering the market. This is an original, not trend data set.

ABS-Home-Lenidng-April-2016--FTBThe largest volume of owner occupied loans was for the purchase of established dwellings, and to total value fell. The proportion of loans refinance rose again, to nearly 35% of all loan values.

ABS-Home-Lenidng-April-2016---OOLooking at owner occupied loans, the purchase of new dwellings has risen a bit, but is still 4% lower whilst other types of borrowing are relatively static.

ABS-Home-Lenidng-April-2016-PC-ChangeBy state owner occupied loans grew the strongest in ACT and VIC, whilst TAS showed the largest fall.

ABS-Home-Lenidng-April-2016---States

Finally, looking at lender type, we see that the non-banks grew the strongest (up 0.8%), building societies lost momentum (down 7%), and banks lent slightly less thin month (down 0.7%).

ABS-Home-Lenidng-April-2016---Lender-Type

Household Debt Ratio Grinds Higher And Mortgage Discounts Rise

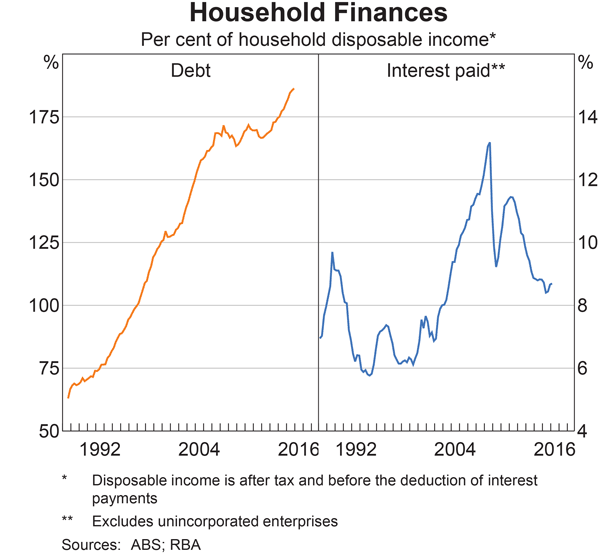
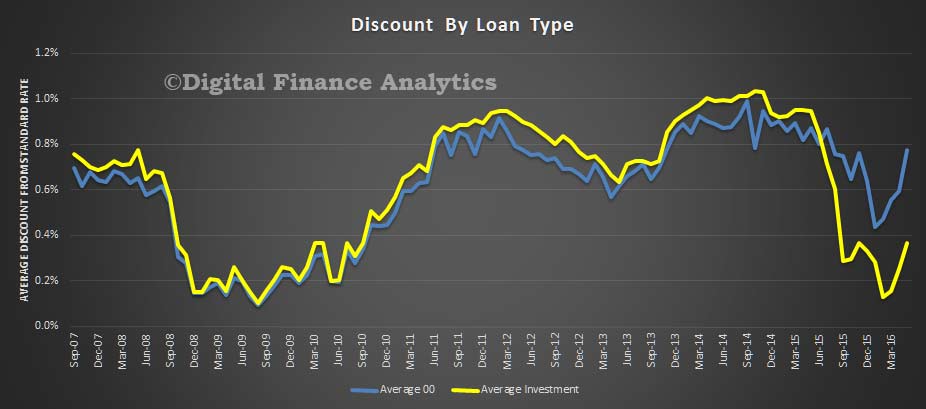
The latest RBA chart pack, just released, shows that household debt, as a percentage of disposable income continues to rise. Also from our analysis, banks are offering larger discounts again.

RBA data shows interest payments are below their peak, but are also rising (though the May cash rate cut will have an impact down the track as mortgage rate cuts come home).  However, given static incomes (which are for many falling in real terms), this debt burden is a structural, and long term weight on households and the economy, and is dangerous.  However low the interest rate falls, households will still have to pay off the principle amount eventually.

household-financesWe are also seeing some relaxing of lending standards now, as banks chase investor loans well below 10% growth rates, and continue to offer cut price loans for refinance purposes.  Average discounts on both investment loan have doubled.

Discounts-May-2016

Brokers Are The Winners In The Home Loan Wars

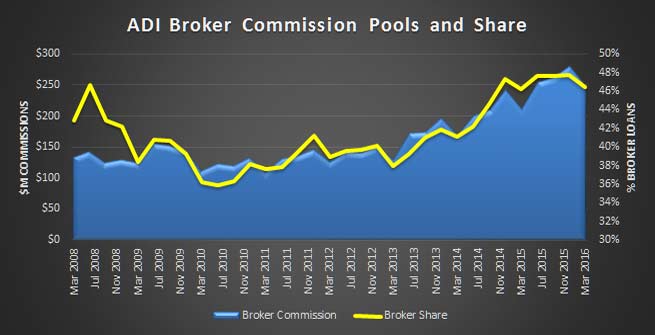
The latest Quarterly ADI Property Exposure stats from APRA paints an interesting picture of lending for residential property.  Total stock of loans across the 150 entities tracked was $1.4 trillion. In the last quarter, $81.7 billion of loans were approved, down by 1.2% a year ago but the average loan balance rose by 5% to $252,000 and the number of loans rose 4% compared with a year ago. Brokers received around $247m in upfront commissions in the quarter from ADIs and generated about 46% of loans by value. The current ASIC review of broker remuneration is therefore highly relevant.

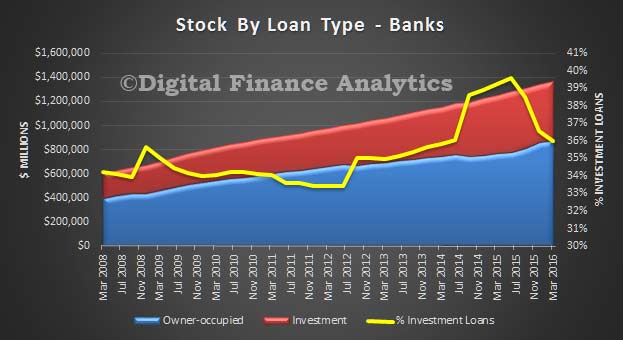
APRA-QP-March-2016-Broker-ComLooking at the banks, we see the mix of investment loans sitting at 36%, down from its high of 39% in 2015. The recent switches between owner occupied and investment loans – around $40 billion, shows in the results.

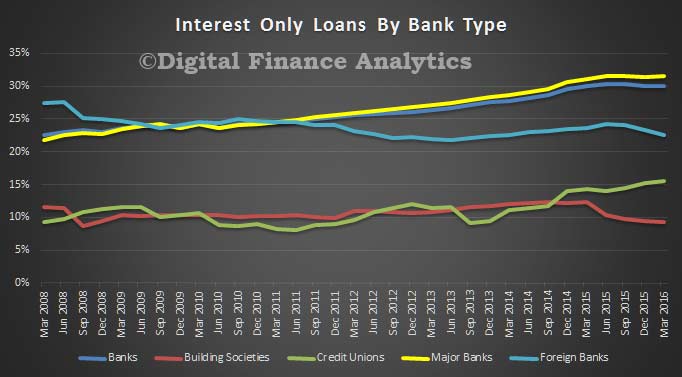
APRA-QP-March-2016-STOCKThe proportion of interest only loans, which at a portfolio level, is sitting at 30% is still close to the record of 30.3%. Interest only loans are taken by investors wanting to maximise their tax benefits, and owner occupied borrowers trying to reduce monthly repayments. Regulators have recently been concerned about the status of these loans, and now new loans have to have a repayment plan, even if interest only. What though of interest only loans written before the tighter standards?

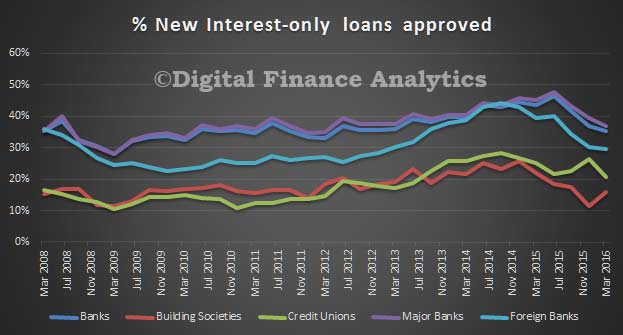
APRA-QP-March-2016-STOCK-IOIt is important to highlight that though the proportion of new loans being written on an interest only basis is around 35%, (from a peak of 43% in 2015), the major banks are still writing a larger share than portfolio, so expect to see continued growth in the interest only sector.

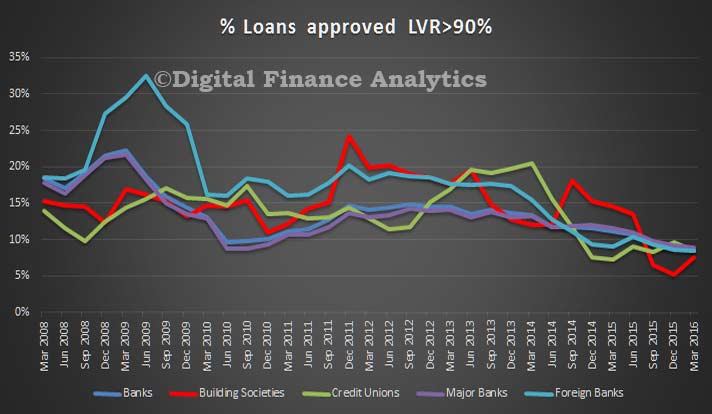
APRA-QP-March-2016-New-IOWe see the regulator’s hand when we look at the new loans, and those over 90% loan to value (LVR). Around 10% of loans are written above this threshold, whereas in 2008 banks lent more than 20% above this level. Also worth noting that credit unions and building societies had a spurt of higher LVR lending in 2013/15, as they completed for business.

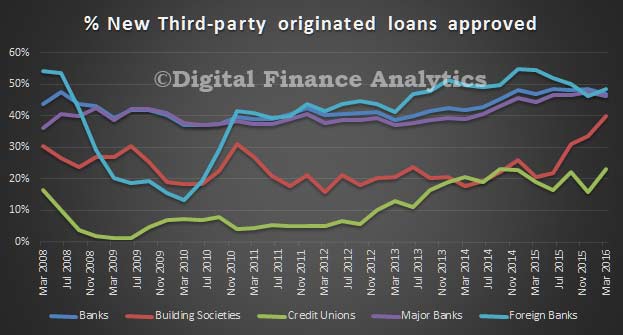
APRA-QP-March-2016-NEW-LVR-HiWe see a rise in the proportion of loans originated by brokers. Around 50% of new loans come though this channel. We also see a rise in the proportion of building societies using brokers, and credit unions are also on the train along with foreign banks. Brokers have become a significant influence in the market and lenders have to work with them (at the expense of loans via branch channels). This changes the competitive landscape, and the economics of loan origination.

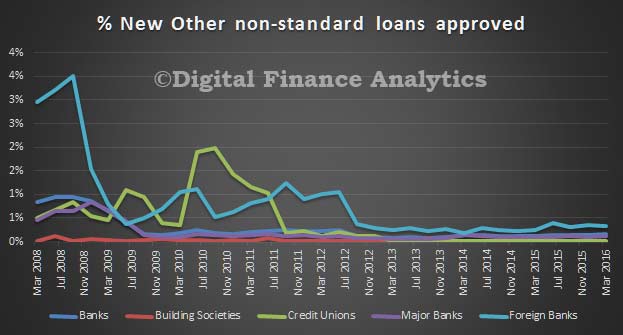
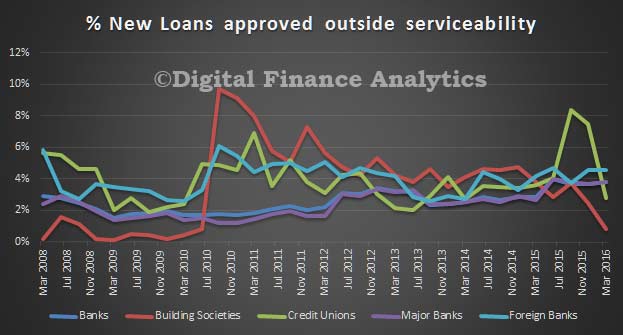
APRA-QP-March-2016-NEW-BrokerFinally, we see a fall in non-standard loans, though around 4% of new loans are still being written outside standard terms.

APRA-QP-March-2016-NEW-NonST APRA-QP-March-2016---New-Servicability