We see no room for complacency – APRA

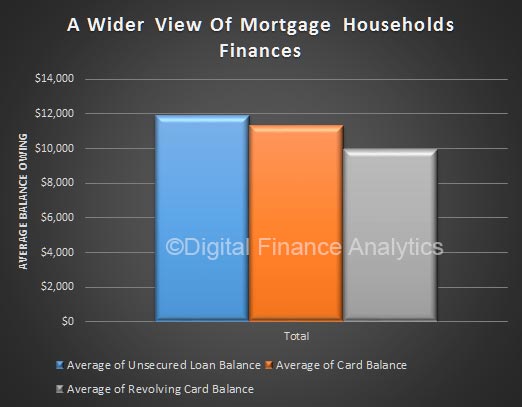
Wayne Byres opening remarks to the Senate Economics Legislation Committee in Canberra includes comments on household debt and the mortgage industry. Further evidence this is now on the supervisory agenda following recent RBA comments.  Some might say, better late than never!

I will just start with a short statement of a few key issues currently on APRA’s plate.

Before I do, however, it’s important to note that Australia continues to benefit from a financial system that is fundamentally sound. That is not to say there are not challenges and problems to be addressed. However, as I’ve said elsewhere, to the extent we’re grappling with current issues and policy questions, they don’t reflect an impaired system that needs urgent remedial attention, but rather a desire to make the system stronger and more resilient while it is in good shape to do so.

The main policy item we have on our agenda in 2017 is the first recommendation of the Financial System Inquiry (FSI): that we should set capital standards so that the capital ratios of our deposit-takers are ‘unquestionably strong.’ We had held off taking action on this until the work by the Basel Committee on the international bank capital regime had been completed. But delays to the work in Basel mean we don’t think we should wait any longer.

Our goal in implementing the FSI’s recommendation is to enhance the capital framework for deposit-takers to achieve not only greater resilience, but also increased flexibility and transparency. And in doing all this, we will also be working to enable affected institutions to adjust to any policy changes in an orderly manner. If we achieve our goals, we will not only deliver improved safety and stability within the financial system, we will also aid other important considerations such as competition and efficiency.

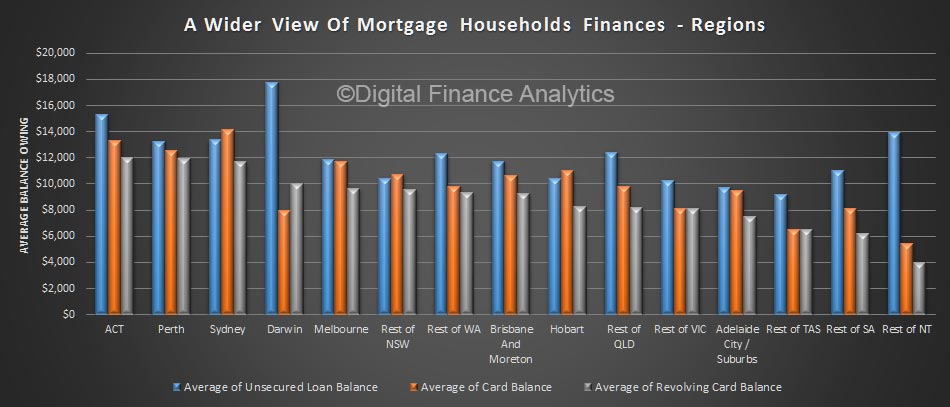
We have many supervisory challenges at present, but there is no doubt that monitoring conditions in the Australian housing market remains high on our priority list. We have lifted our supervisory intensity in a number of ways, including reinforcing stronger lending standards and seeking in particular to moderate the rapid growth in lending to investors. These efforts have had the desired impact: we can be more confident in the conservatism of mortgage lending decisions today relative to a few years ago, and lending to investors was running at double digit rates of growth but has since come back into single figures.

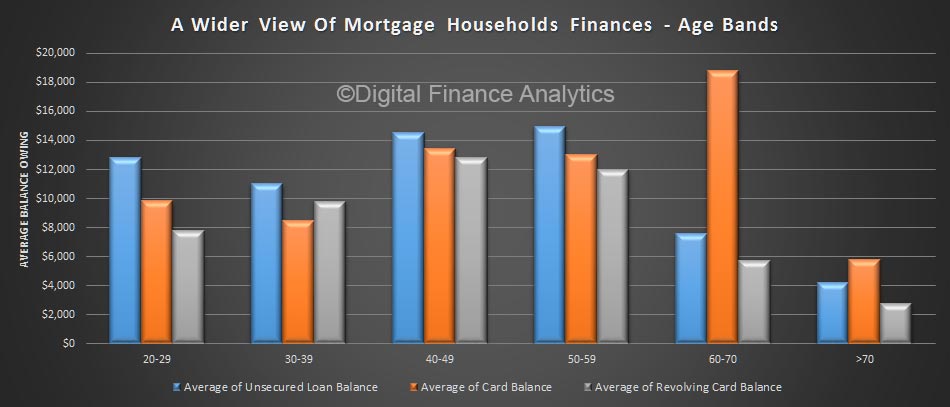
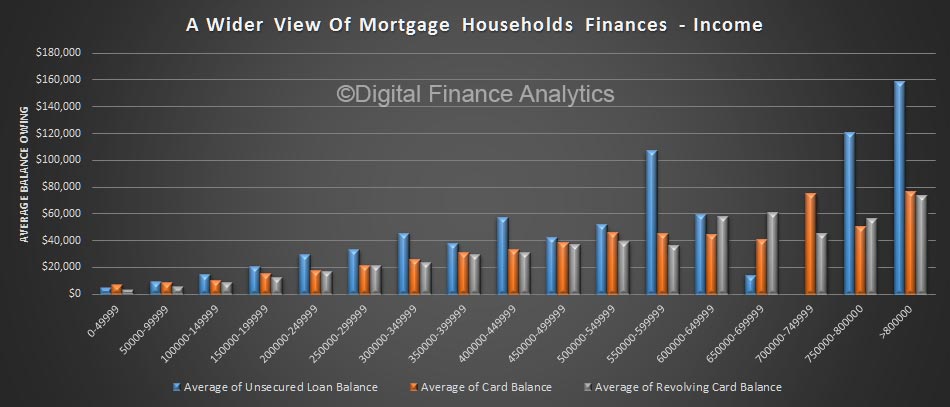
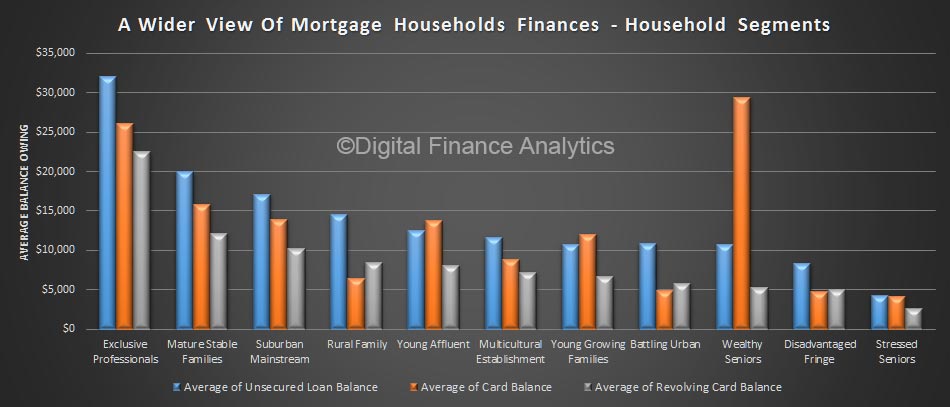
However, strong competitive pressures are producing higher rates of lending growth again. This is occurring at a time when household debt levels are already high and household income growth is subdued. The cost of housing finance is also more likely to rise than fall. We therefore see no room for complacency, and mortgage lending will inevitably remain a very important issue for us for the foreseeable future.

The final issue I wanted to mention is our work on superannuation governance. This is an area where we remain keen to lift the bar. There are some excellent examples of good practice governance in the superannuation sector, but equally there are examples where we think more can be done to make sure members’ interests are paramount. Late last year, we finalised some changes to our prudential requirements to strengthen governance frameworks. The changes we implemented were relatively uncontroversial at the time, and have largely been included within the principles for sound governance that have subsequently been generated by the industry itself.

This Is Why Mortgaged Household Are Debt Exposed

When we published our sensitivity analysis on mortgaged households, which shows that more than 20% were on the edge financially speaking even at current low rates, a number of people asked why this was so, given the assumed affordability buffers and other underwriting safeguards.

Well, apart from the obvious issues of static incomes, rising costs of living, and potentially higher interest rates ahead, many mortgaged households also have other debts to repay. So today we run through some of our survey results looking at these other household debts. And it is not pretty.

To start, here is the average balances for mortgaged households, looking at their use of unsecured credit (e.g. personal loans, store cards etc) and credit cards. In the case of credit cards, we show two balances, first the current outstanding balance, and second the average revolving (hard core) debt outstanding.  Households with debts, on average and on top of the mortgage have $12,000 in unsecured loans, $11,000 in card debt, of which $10,000 is revolving.   These can cost as much to service each month as the mortgage repayment!

We can slice and dice the households, using some of our custom SQL views. For example, here are the average balances by household age bands.  Households between 40 and 59 have the larger loan and revolving balances, though interestingly, those 60-70 have the largest card balances.

As incomes rise, debt levels also rise, so some of the debt is owned by households with more ability to repay. However, remember the larger number of households are in the first three bands, where debt is still rife.

We can examine this debt by our master household segments. Once again, more affluent households have larger debts, but young growing families have on average close to $20,000 in debt, including some on revolving cards (where interest is charged at a high rate).

We can examine the data across our regions. Urban centres, including ACT, Greater Sydney and Melbourne have the highest debt levels. Many of these households also hold the largest mortgages.

Finally, it is interesting to note that from a digital behaviour standpoint, those younger households who are online most of the time and prefer to use digital channels (Natives) borrow more than Luddites (those who prefer not to go online, but the larger debts are held by households who have migrated online. These Migrants are progressively using online channels more than ever.  You can read more about our channel use inour report  The Quiet Revolution.

So, to sum up. Many households have large mortgages AND other debts, including credit cards and personal loans. This entire portfolio of debt must be considered when looking at their sensitivity to rising rates, and when comparing static incomes with rising debt repayments. Just looking at the mortgage gives only part of the full picture.

Much of this debt would not exist when the bank made their mortgage underwriting decision. That point in time view however does not necessarily still hold true. Should ongoing affordability testing be required by the regulators?

Analysis of Mortgage Risk Under Basel

The Bank of England just published a staff working paper “Specialisation in mortgage risk under Basel II“.  Lenders using the less sophisticated risk models (generally smaller banks) are found to have a higher concentration of higher-risk mortgages than those using the advanced models.

They looked at the two models which were introduced under Basel II, lenders’ internal models (IRB) and the less risk-sensitive standardised approach (SA) by using a dataset covering 7 million UK mortgages from 2005-15. The switch to Basel II gave lenders using IRB models a comparative advantage in capital requirements (compared to lenders using the SA approach), particularly at low loan-to-value (LTV) ratios, and this was reflected in prices and quantities. They concluded:

First, mortgage risk is concentrated in lenders using the SA approach, which is typically used by smaller lenders, suggesting a potential higher failure rate than among IRB banks.

Second, macroprudential tools may affect the strength of the specialisation mechanism. This should be accounted for in calibrating such tools.

Third, they validate the view from competition authorities who have identified the cost of adopting IRB as a potential barrier to entry and expansion. IRB provides a competitive advantage in low LTV ratio mortgages.

Finally, the effect, is not specific to the mortgage market and this needs  further research.

IRB risk weights increase with the LTV ratio, the main indicator for credit risk used by UK mortgage lenders. In contrast, SA risk weights are fixed at 35% for LTV ratios up to 80%, and are then 75% on incremental balances above the 80%

LTV threshold. IRB risk weights tend to be lower than SA risk weights across most LTV ratios, but the gap is larger for lower LTV ratios. In 2015, the gap between the average IRB risk weight and the SA risk weight was about 30 percentage points for LTV ratios below 50%, compared to less than 15 percentage points for LTV ratios above 80%. The scale of variation in risk weights between IRB lenders is smaller than the gap between the IRB average and SA risk weights, at least at lower LTV ratios.

IRB lenders gain a comparative advantage in capital requirements compared to SA lenders, particularly at low loan-to-value (LTV) ratios. This comparative advantage is reflected in prices and quantities.

We expect all lenders to price lower for lower LTV mortgages. But under Basel II versus I, IRB lenders did so by 31 basis points (bp) more, and increased the relative share of low-LTV lending in their portfolios by 11 percentage points (pp) more, than SA lenders. Such specialisation leads to systemic concentration of high risk (high LTV) mortgages in lenders who tend to have less sophisticated risk management.

With an average 30 percentage point gap between IRB and SA risk weights for LTV ratios below 50%, this corresponds to an economically significant price advantage of 30bp. From the perspective of a typical borrower at this LTV level, with a 50% LTV mortgage against a $200,000 property, repayable over a remaining 15 year term, 30bp translates to around $170 per year or 0.7% of median household disposable income. From the lender’s perspective, a 30bp disadvantage translates to several places in `best buy’ tables, and thus likely material loss of market share.

If instead of risk weights we consider directly the variation in capital requirements, which is driven by both risk weights and lender-specific capital ratio requirements, a 1pp reduction in capital requirements causes a 6bp decrease in interest rates. These latter results can also be interpreted as `pass-through’ rates from lender-specific changes in risk weights or capital requirements to prices, subject to limits on external validity due to the Lucas critique.

Finally, we find that the pass-through from capital requirements to prices is significant only when lenders have low capital buffers (the surplus of capital resources over all regulatory requirements). Lenders with a buffer below 6pp of risk-weighted assets increase prices by 1.7bp basis point for a 1pp increase in risk weights.

Note: Staff Working Papers describe research in progress by the author(s) and are published to elicit comments and to further debate. Any views expressed are solely those of the author(s) and so cannot be taken to represent those of the Bank of England or to state Bank of England policy. This paper should therefore not be reported as representing the views of the Bank of England or members of the Monetary Policy Committee, Financial Policy Committee or Prudential Regulation Authority Board.