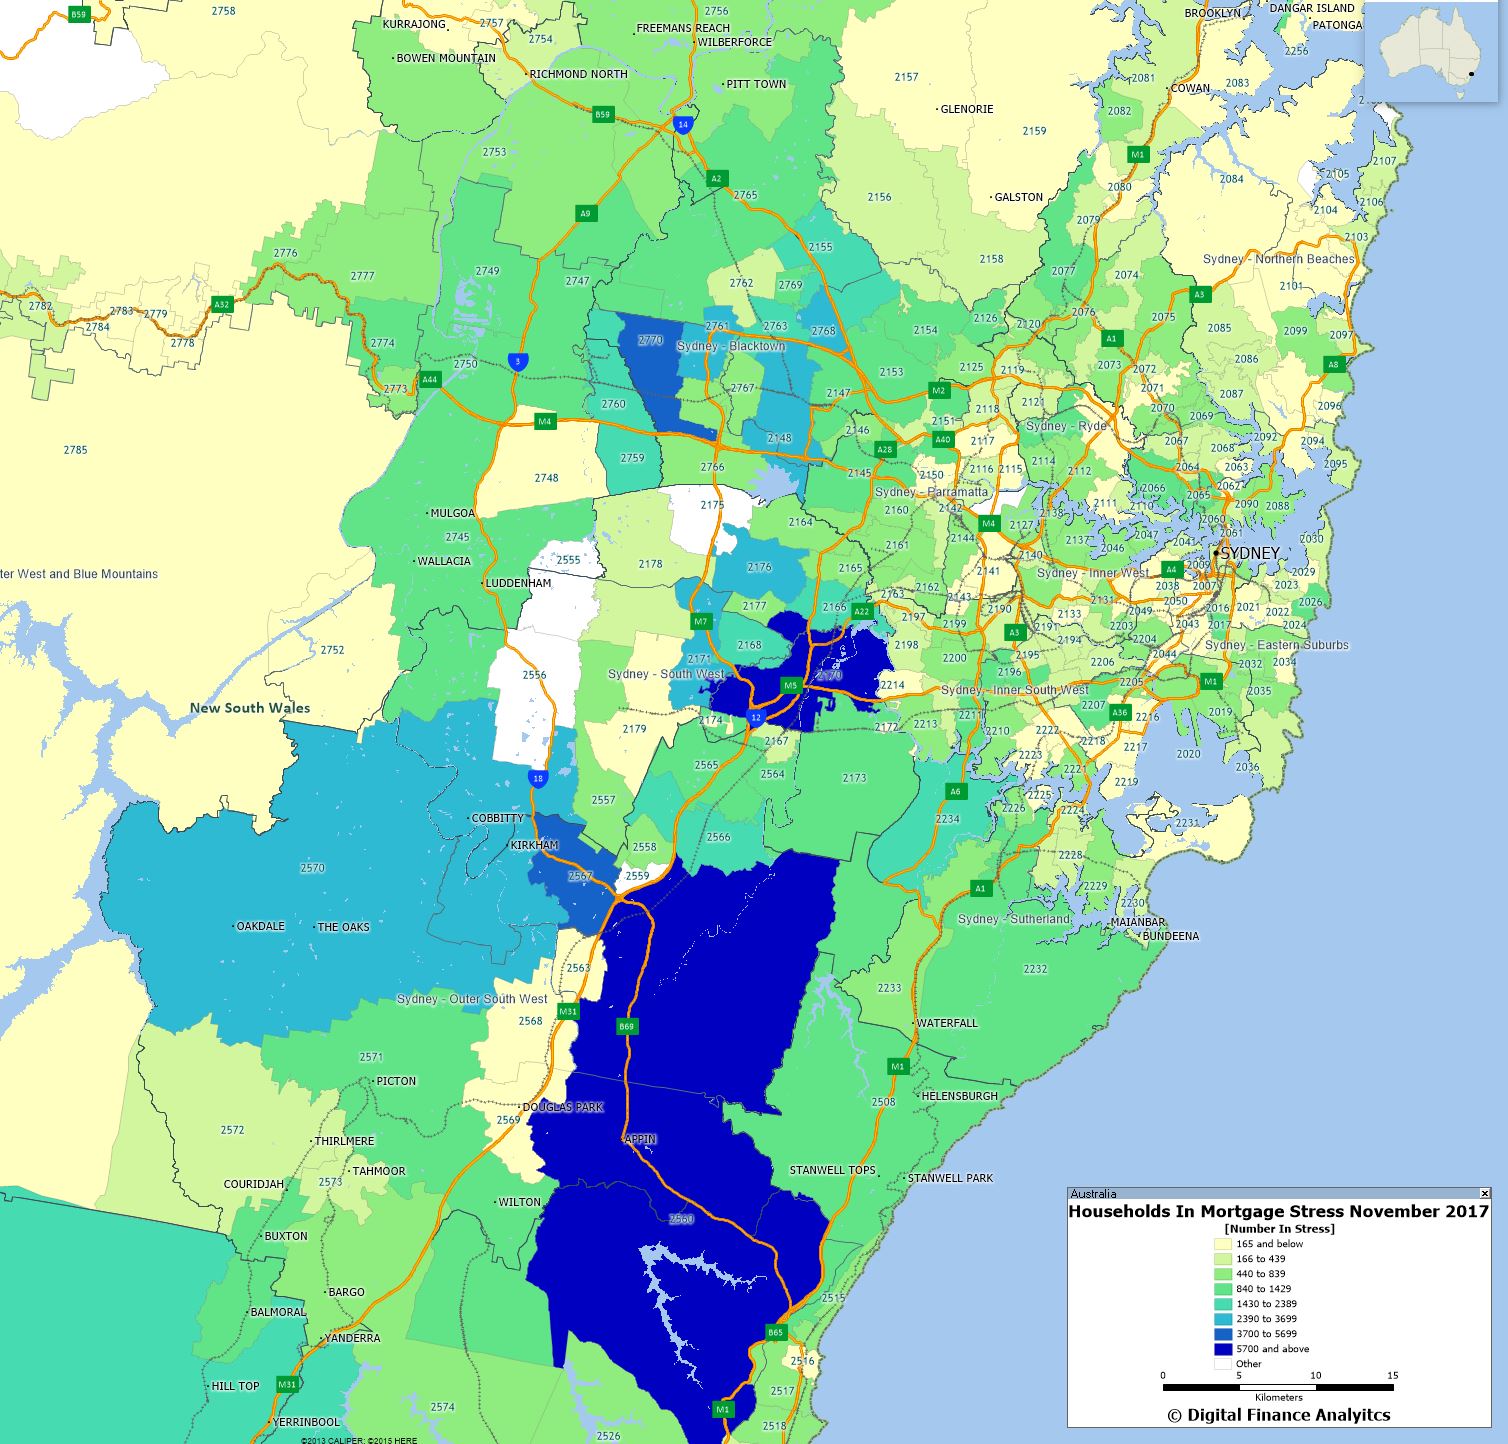
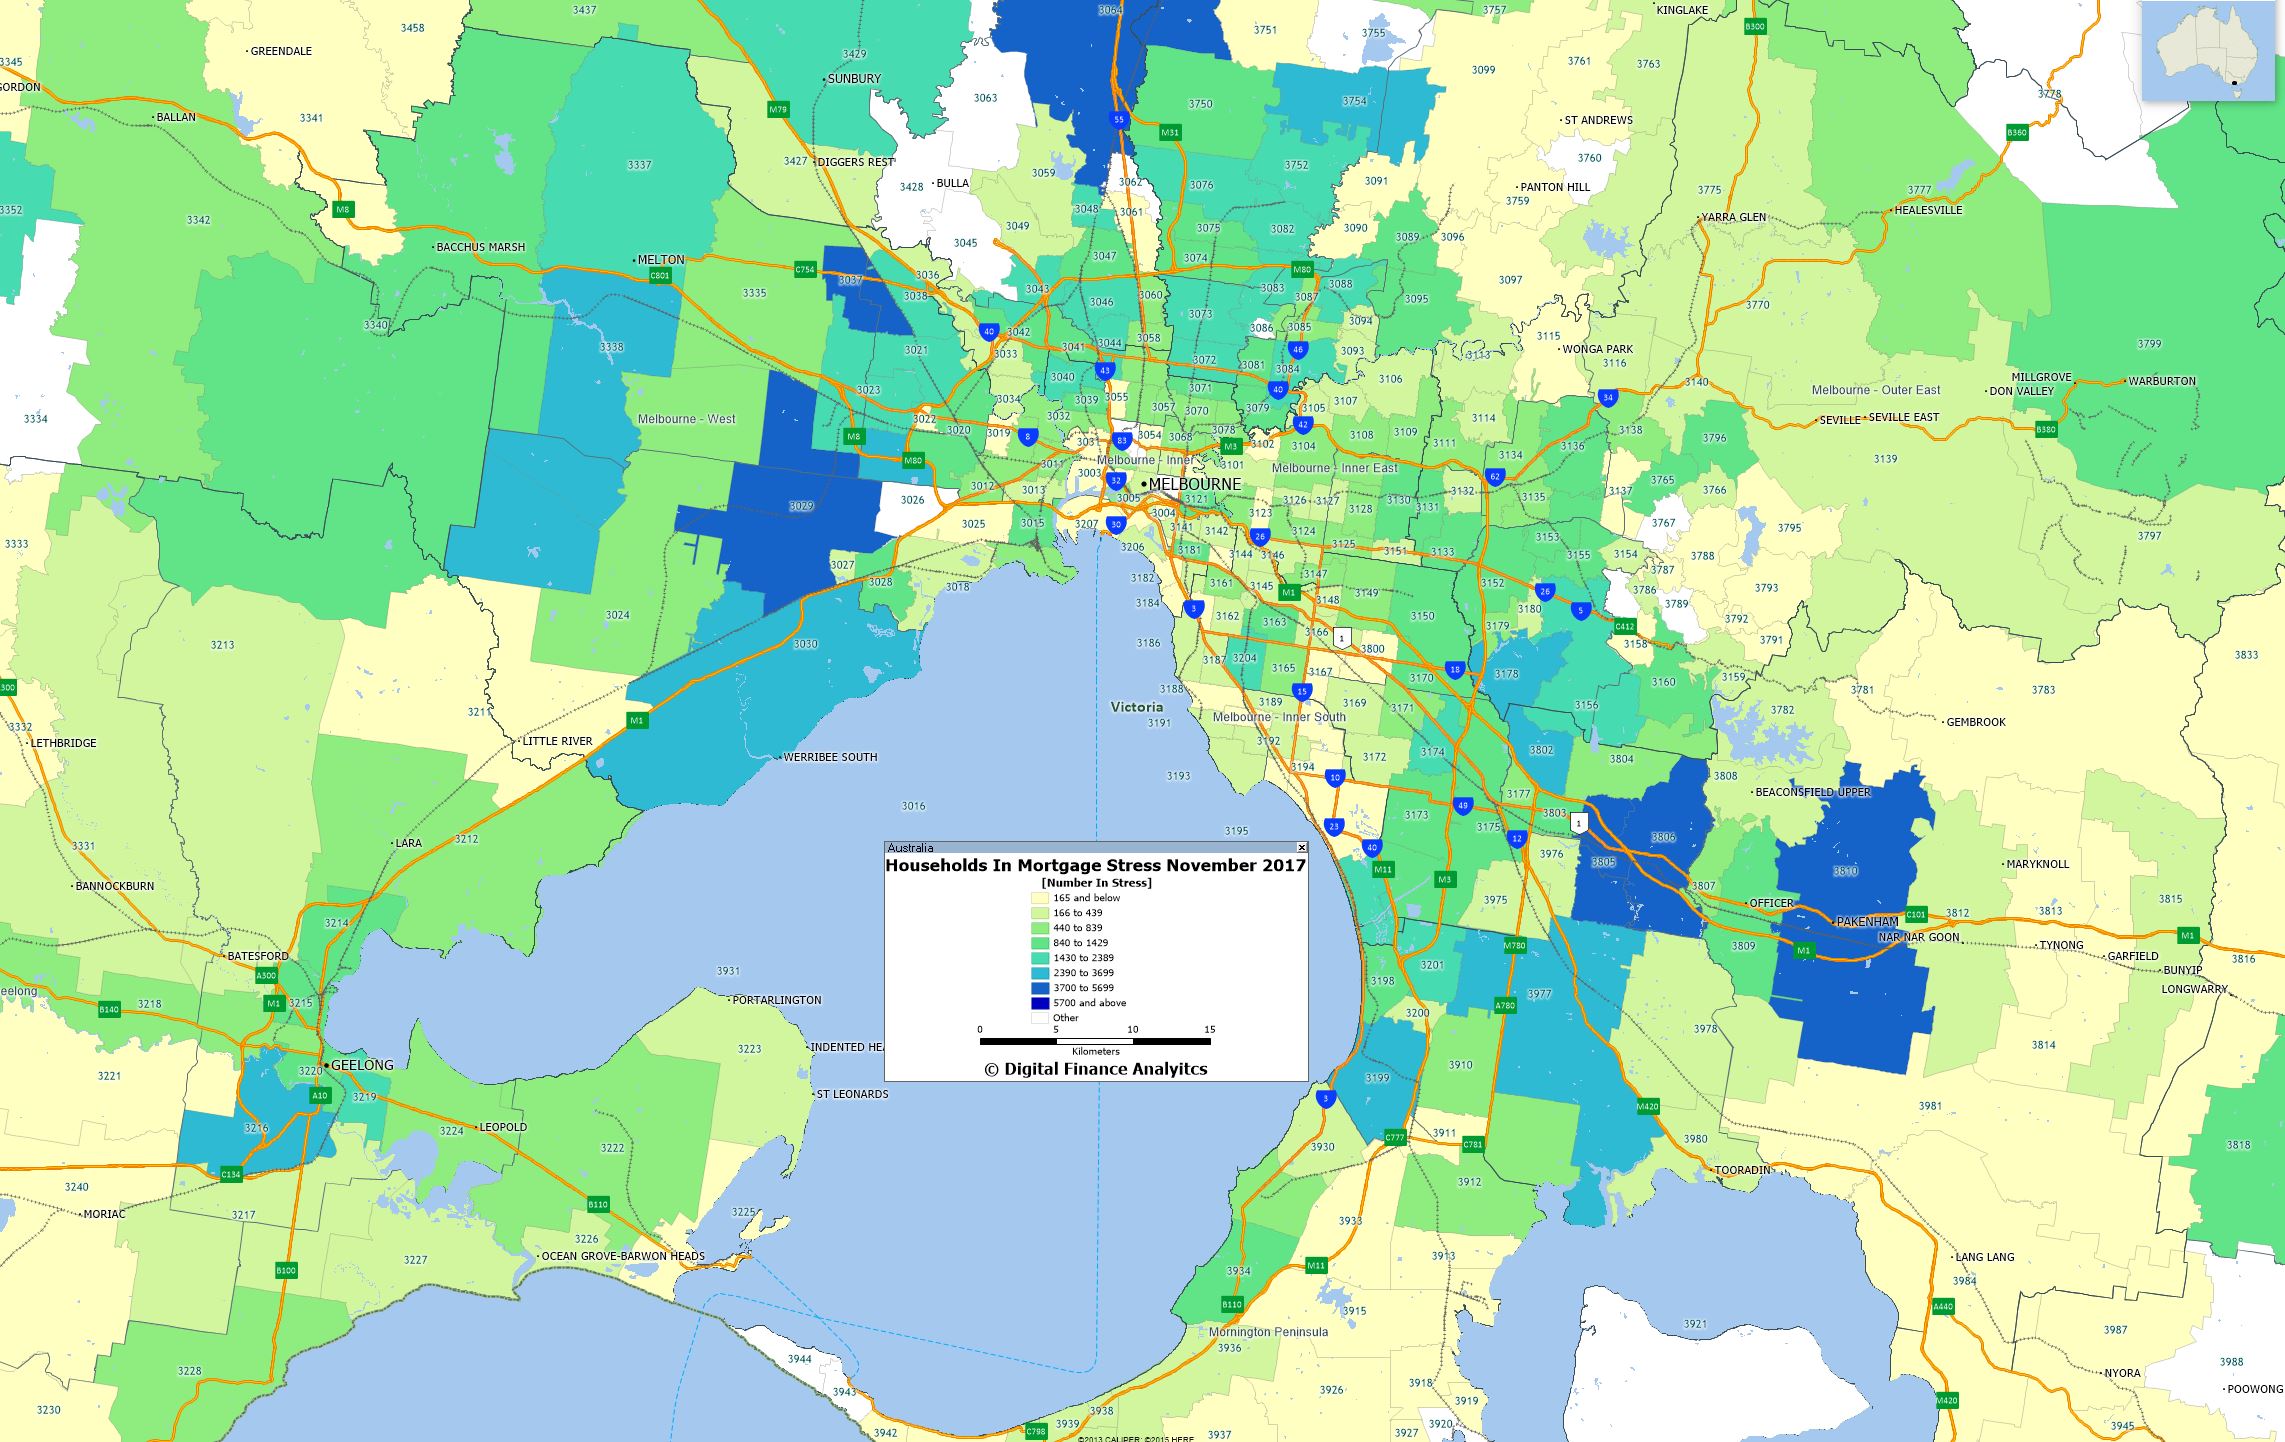
Continuing our series on mortgage stress, we feature the results for Melbourne and VIC today. In fact more than half the post codes nationally in the top 10 are in VIC, so risks are rising fast here (and prices are still rising too!).
In November another 3,000 households in VIC slipped into stress, reaching a new high of 253,000. 13,000 of these risk default in the next 12 months.
 Next, here is the overall listing of the top 10 most stressed post codes across VIC as at the end of November 2017. We also show the relative default risk ranking across the country. Cranbourne has the 2nd highest default ranking nationally this month.
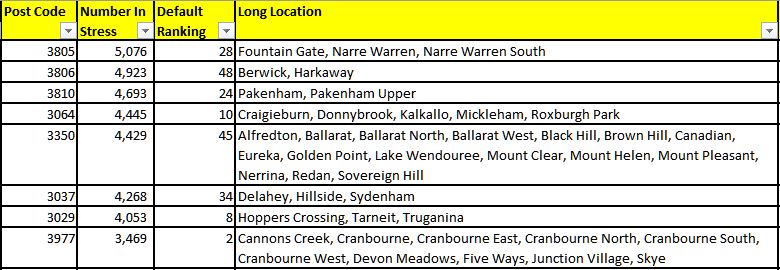 The most stressed post code in the state is 3805, which includes Narre Warren and Fountain Gate. This area is around 38 kilometers south east of Melbourne. Here 5,076 households are in mortgage stress. The average home price is $545,000 compared with $366,000 in 2010. There are more than 15,000 families in the area, and the average age is 34 years. The average household income is just over $7,000 a month, which is higher than the national average. 54% of homes are mortgaged and the average monthly repayment is $1,700 slightly below the national average of $1,755.
Next is 3806, Berwick and Harkaway which is around 40 kilometers south east of Melbourne, with 4,923 households in mortgage stress. The average home price is $625,000 compared with $451,000 in 2010. There are around 13,000 families in the area, with an average age of 36. More than 47% of households here have a mortgage and the average repayment is $1,850 compared with the average income of $7,600.
Next is 3810, Packenham, with 4,693 households now in mortgage stress and in the same position as last month. It is around 54 kms south east of Melbourne. The average home price is around $435,000 compared with $290,000 in 2010. According to the latest census the average age is 32 years and there are more than 12,600 families in the district. The average monthly household income is $5,900, below the average in the state as well as nationally. 46% of homes have a mortgage, compared with the VIC average of 35%. The average monthly mortgage repayment is $1,700.
Then comes 3064 Craigieburn, Mickleham and Roxburgh Park. It is about 24 kms North from Melbourne. Around 4,445 households in the area are in mortgage stress. There are about 19,300 households in the area and the average age is 30. The average home prices in 2010 was $335,500 and is now worth $489,400. The average income is around $6,400, which is slightly above the Victorian and Australian averages. 88% of properties in the area are separate houses, and most have three or more bedrooms. More than 56% of homes here are mortgaged and the average repayment each month is $1,733, which is close to the average in Victoria, but lower than the Australian average.
Next is post code 3350, which includes Ballarat and the surrounding area, It’s about 100 kilometres from Melbourne and is down one place from last month. In this region there are 4,429 households in mortgage stress. The average property value is $335,000, compared with $281,000 in 2010. There are more than 14,500 families in the area and the average age is 37, line ball with the average across the state. The average monthly income is $5,300, well below the national and state averages. Around 33% of households have a mortgage and the average repayment is $1,408 a month.
Finally is post code 3037, which includes areas around Delahey, Hillside and Sydenham; around 20 kms north west of Melbourne. Here around 4,268 households are in mortgage stress. Of the 13,000 households in the district, more than half have a mortgage and the average age is 33. The average home price is around $530,000, up from $365,000 in 2010. The average monthly income is around $7,200 and the average mortgage repayment is $1,730.
We continue to see mortgage stress still strongly associated with fast growing suburbs, where households have bought property relatively recently, often on the urban fringe. The ranges of incomes and property prices vary, but note that it is not necessarily those on the lowest incomes who are most stretched. Banks have been more willing to lend to these perceived lower risk households but the leverage effect of larger mortgages has a significant impact and the risks are underestimated.
Next time we will look at Brisbane.