Property investors could force RBA’s hand

From InvestorDaily.

A resurgence in residential property investor lending could see the Reserve Bank lift the cash rate earlier than expected, according to a market analyst.

The latest ABS figures show that the value of investor housing finance increased by 4.9 per cent over November.

Investor lending is now up 21 per cent year-on-year, which is the fastest growth rate since the first half of 2015, which saw the implementation of APRA’s macroprudential regulations.

“I have a feeling that this is probably a bit of a wake-up call for the RBA,” Digital Finance Analytics (DFA) principal Martin North said.

“I think they will lift rates sooner rather than later because I think it has gotten out of hand. All indicators suggest that rates will rise.”

Mr North added that there are considerable proportions of households that are exposed to even small rate rises.

“Some of these are the more affluent households. They have such large mortgages and flat income growth,” he said. “The market could be up for a bit of a transformation in 2017.”

HSBC Australia chief economist Paul Bloxham believes most of the revival in investor activity is being driven in Sydney and Melbourne, where house prices posted strong gains in 2016.

“It has a number of implications, the first of which is, this is likely to make the RBA somewhat uncomfortable. This firms up our already held view that the RBA is unlikely to cut interest rates any further,” said Mr Bloxham.

“Our central case is that the RBA is on hold through 2017 and that they start to lift interest rates in 2018.”

Home Lending On The Rise

The latest housing finance data from the ABS underscores the renewed momentum in home mortgage lending, especially in the investment sector, and there was also a rise in first time buyers accessing the market.

  • The trend estimate for the total value of dwelling finance commitments excluding alterations and additions rose 0.6%. Investment housing commitments rose 1.7%, while owner occupied housing commitments was flat.  In seasonally adjusted terms, the total value of dwelling finance commitments excluding alterations and additions rose 2.2%.
  • In trend terms, the number of commitments for owner occupied housing finance fell 0.1% in November 2016 whilst the number of commitments for the purchase of new dwellings rose 0.7%, the number of commitments for the construction of dwellings rose 0.2%, and the number of commitments for the purchase of established dwellings fell 0.2%.
  • In original terms, the number of first home buyer commitments rose by 13.4% to 8,281 in November from 7,302 in October; the number of non-first home buyer commitments also rose. The number of first home buyers as a percentage of total owner occupier commitments rose from 13.7% to 13.8%.

Total commitments in trend terms was $32.7 billion, of which $19.8 billion was owner occupied loans, and $12.9 billion for investment purposes. 39.5% of new lending was for investment purposes, and we see the proportion of investment loans continuing to rise, it is already too high.

Looking at the month on month movements, the seasonally adjusted changes highlight the rise in the investment funding for new construction, with a 40% rise on last month. Owner occupied refinancing fell.

The more reliable trend analysis shows the monthly movements, with a strong surge in investment loans by individuals, and a stronger fall in owner occupied refinancing.

Looking at total loan stock (in  original terms) around 35% of all loans outstanding are for investment purposes, and the slide we saw late 2015 appears to be easing.

Turning to the first time buyer, original data, the number of first time owner occupied buyers rose compared with last month, and the overall mix also increased.

Combining the first time buyer property investor data from our surveys, we see a spike in overall first time buyer activity.

Last month, around 1,100 more first time buyers entered the owner occupied market than the prior month (12%), and around 150 more in the investment sector.  We also saw a rise in the fixed rate loans, as borrowers try to lock in lower rates ahead of expected rises.

So overall, still strong momentum in the housing sector, and powered largely by an overheated investment sector.


Investors Betting On The Property Market

As we look across our latest household research, today we home in on property investors. We showed yesterday there is strong demand from both portfolio investors (those with multiple investment properties) and from solo investors (those with one or two properties). These segments are being motivated by the tax efficiency of the investment (36%), ongoing expectation of property capital growth (25%, compared with 28% a year ago), attractive overall returns compared with deposit accounts (18%) and low financing interest rates (14%). Overall, these drivers have been consistent through the last property boom cycle.

survey-sep-2016-invDrilling into solo investors, we see the same focus on tax efficiency (30%) and the lure of higher returns compared with bank deposits (35%). Indeed, as cash rates have fallen, we have see more switching from cash to property, one of the trends supporting the market.

survey-sep-2016-solo-invThere are a number of barriers to investors, apart from the obvious one of having already bought a property (43%), around 16% of investors are having difficulty getting the funding they need (16% compared with 4% a year ago) as lenders tighten their underwriting standards and income ratios. Fear of changes to regulation have receded from 21% a year back to 11% now. So essentially the main brake on property transactions is tighter standards. Property supply does not appear to be a problem.

survey-sep-2016-inv-barriersWe see a continued rise in SMSF investors adding property to their portfolio, with around 4% of funds holding residential property.  Once again tax efficiency (31%) and appreciating capital values (25%) are the main drivers, supported by low financing rates (15%).

survey-sep-2016-super-invThe proportion of property in a SMSF varies, with 20-40% being the most popular option.

survey-sep-2016-smsf-distFinally, it is worth noting that SMSF trustees are getting their investment property advice mainly from internet sites or forums (21%) or mortgage brokers (24%, compared with 21% a year ago). They also rely on their own knowledge (16%), Accountants (15%) or real estate agents (11%).  Mortgage brokers appear to be more in favour now as a source of guidance.

survey-sep-2016-trustee-adviceSo, in summary the investment sector is still strong, driven by the market fundamentals of expected capital growth and tax benefits, supported by ultra-low interest rates. Tightening underwriting standards make it harder for some to get the finance they require. However, we conclude the property investment boom is still largely intact.

It is worth also reiterating our earlier observation that many prospective investors are being drawn to the eastern states, irrespective of where they live. These “honey pots” are drawing in the bulk of transactions.

The Ongoing Allure of Investment Property

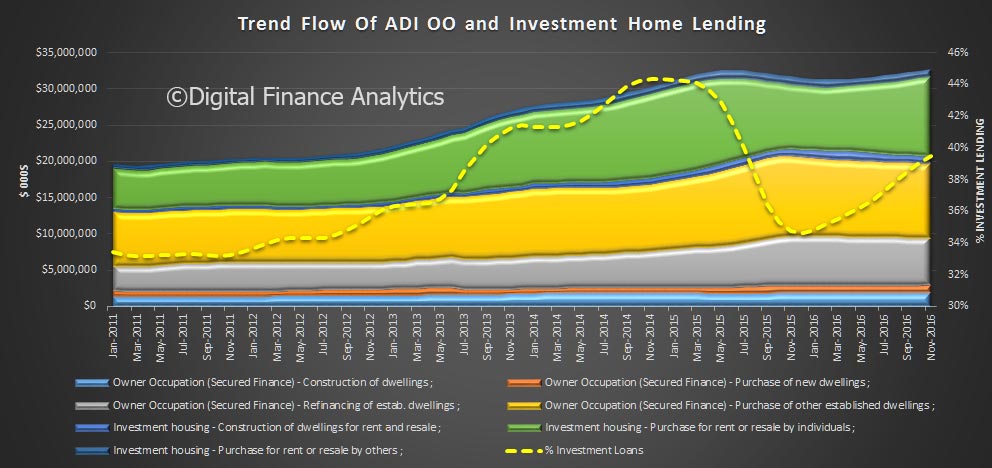
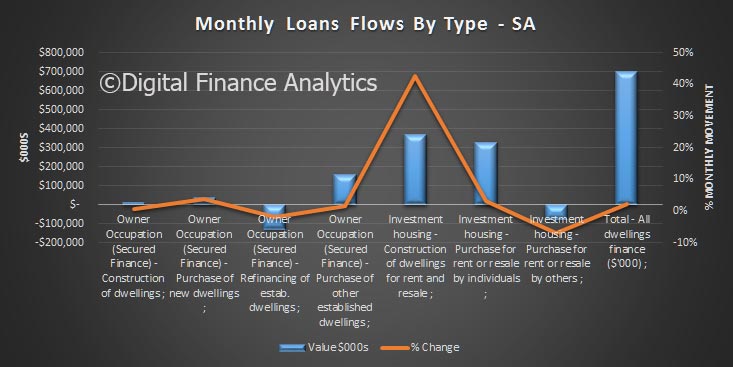
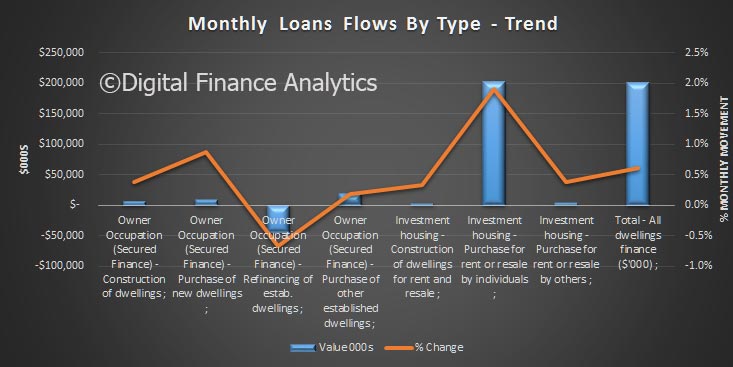
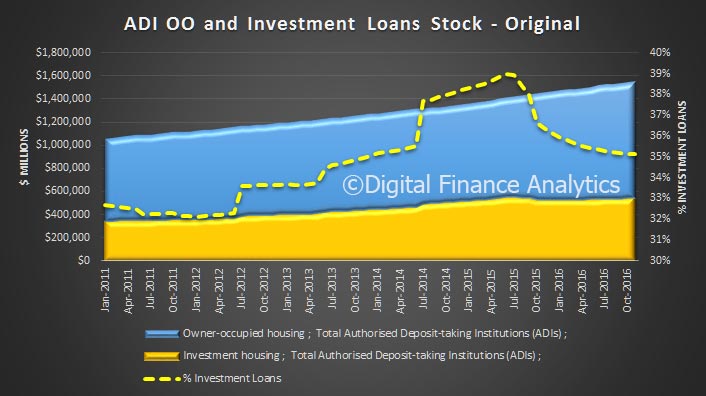
We continue the results from the latest Digital Finance Analytics household surveys, by looking at property investors, who now make up around 35% of all residential property borrowers. This is much higher than in any other similar economy (e.g. UK 17%). The appetite for investment property is still strong, and despite some tightening of lending criteria and slowing capital growth momentum, investors still wish to transact. Bank lending to investors in June 2016 rose by 0.1% or $0.6 billion.

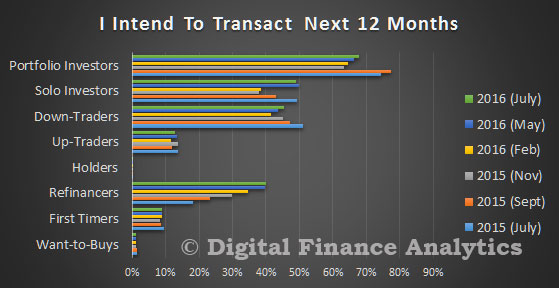
As a reminder, we showed that investors (either those with one or two properties – solo investors, or those with a portfolio of properties – portfolio investors) were the most likely to purchase, even compared with those seeking to refinance.

DFA-Survey-Jul-2016---Transact
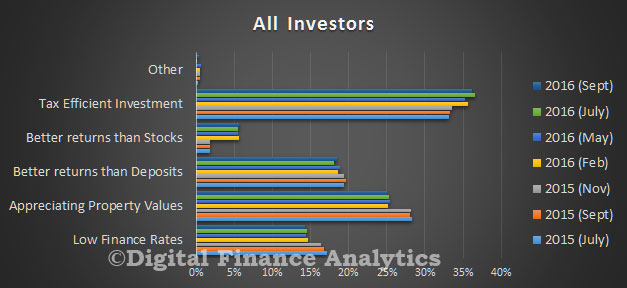
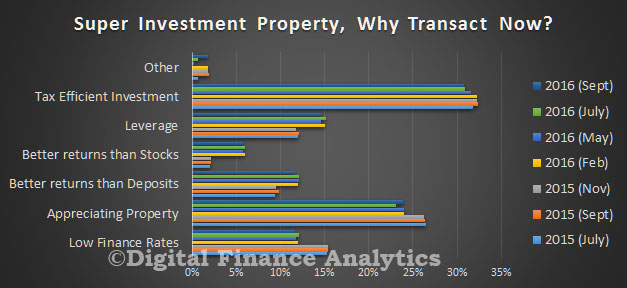
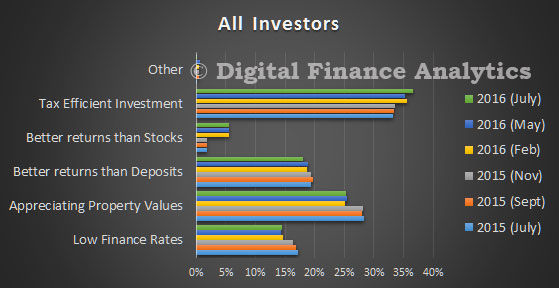
The driver to transact relate firstly to the tax effectiveness of the investment (37%) and capital gains from appreciating property values (25%). Low finance rates are helping, and investment property is perceived as offering better returns than bank deposits or stocks. We know that many in the eastern states will not make positive pre-tax returns, but taking tax breaks into account, they are still ahead, and will remain so unless there is a significant fall in home prices.

DFA-Survey-Jul-2016---All-Inv
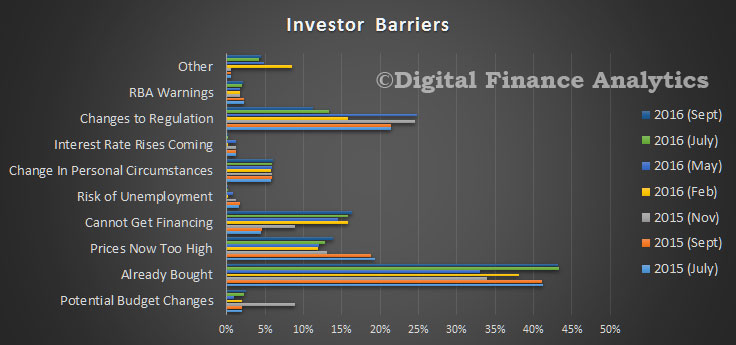
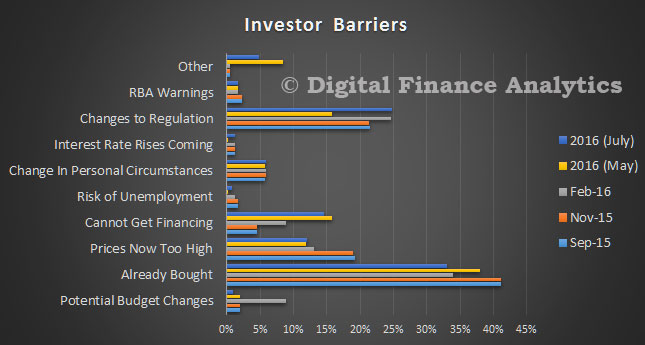
There are some barriers which investors have to negotiate, the most obvious is they have already bought (40%), potential changes to regulation (25%), and inability to get financing (15%). Risks relating to budget changes have dissipated, and some are concerned about static or falling rents (bundled in the other category at around 5%).

DFA-Survey-Jul-2016---Inv-Barriers
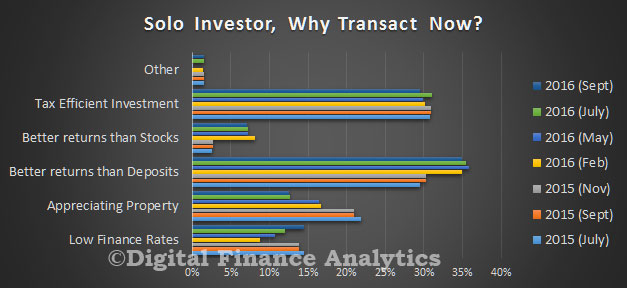
Solo investors have similar drivers with a focus on tax efficiency and potential capital gains, supported by low finance rates. We note that they have lower expectations of future gains than other investors (portfolio and those investing via SMSF).

DFA-Survey-Jul-2016---Solo-Inv
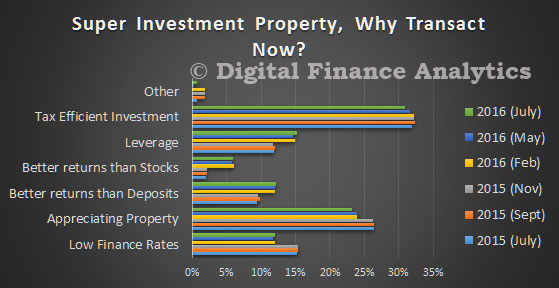
Looking in detail at SMSF property investment, tax effectiveness, leverage and potential capital gains all drive the decisions. We did note some concerns about changes to superannuation regulation, especially around the caps, but this has not deterred prospective purchasers.

DFA-Survey-Jul-2016---Super-Inv
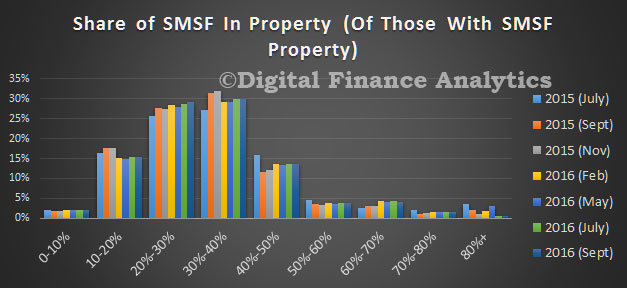
There are about four percent of SMSF’s holding residential property, and typically it comprises just a proportion of the total fund. A further three percent are actively considering adding in property to their SMSF.

DFA-Survey-Jul-2016---SMSF-Share
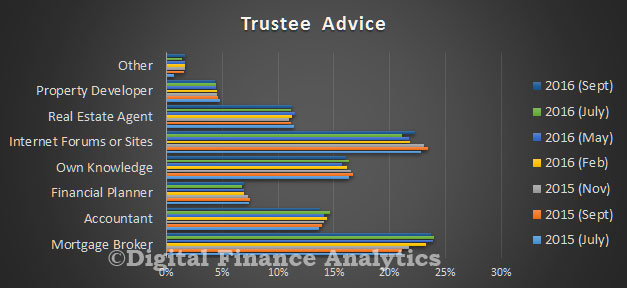
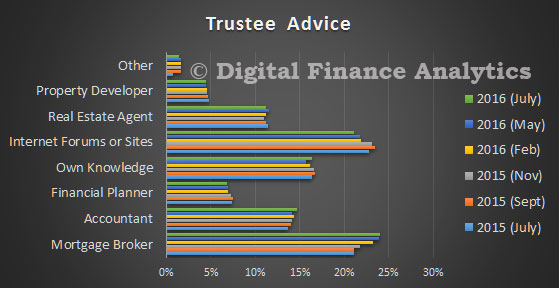
It is also worth noting that mortgage brokers are becoming more influential in providing advice to trustees seeking SMSF advice, alongside accountants. Internet forums and web sites still play a significant role in providing advice to trustees. 17% say they know enough, and rely on their own knowledge and experience.

DFA-Survey-Jul-2016---Trustee-Advice Finally, we highlight the “honeypot effect”, where interstate investors prefer to buy in the more buoyant states of NSW and VIC, than in their home states. We discussed this in detail in a previous post.  And of course some first time buyers are going direct to the investment sector.

So, investors will continue to sustain the market, and should the RBA cut rates again tomorrow, we should expect additional momentum, thanks to lower funding costs and paltry returns from bank deposits. Property investors are making logical decisions, given past performance, but at some point the tide just has to turn. But at the moment, returns from property simply outperforms other investment classes, and are perceived to be “as safe as houses”.

Next time we will round out the survey results by looking at some of the other property active segments.

Total returns show why housing investment remains so popular

From CoreLogic RP Data. Despite the recent slowdown, housing finance data highlights that investor activity in the housing market is starting to rise again and when you look at total returns from housing it’s no surprise.

The CoreLogic RP Data Accumulation Index which has been published since June 2009 highlights the total returns from residential property.  The total returns include both the increase in values as well as gross rental returns.

The first chart shows the annual change in the total returns (accumulation) index over time.  While combined capital city home values recorded longer and deeper falls during 2011-12, total returns were negative for only a short period of time thanks to the uplift from rental yields.  More recently you can see that the annual change in total returns across the combined capital cities has remained quite strong.

Combined capital city annual changes in total returns for houses and units

2016-06-06--img1

Over the 12 months to May 2016, combined capital city home values have increased by 10.0% while total returns have been recorded at a higher 13.9%.  Looking at the individual capital cities, all cities except for Perth have recorded positive total returns over the past year.  Sydney and Melbourne which have been the most active investment markets have seen the highest total returns at 16.9% and 17.5% respectively over the past twelve months.  It should be noted that gross rental returns in both of these cities are now at record lows highlighting that the majority of these returns have come via an increase in home values.

Annual change in capital city total returns, 12 months to May 2016

2016-06-06--img2

The third chart highlights the total returns over the past five years across all capital cities.  Again, Sydney in particular, has seen far superior total returns compared to all other capital cities.  Melbourne has also experienced relatively strong total returns over the past five years.  Again this highlights why these two cities in particular have remained so popular with investors.  In all other capital cities returns from residential property have been positive.  In many of these cities the total returns have been driven more so by the rental returns rather than the capital growth which has been the key driver in Sydney and Melbourne.

5 year total change in total returns, to May 2016

2016-06-06--img3

Despite the recent rebound in value growth, the mature capital growth cycle and record low rental returns in Sydney and Melbourne, total returns are unlikely to be as strong in these cities over the coming years.  A more balanced investment approach which focusses on moderate capital growth and relatively strong rental returns is likely to be a superior housing investment profile over the coming years.  This data also highlights why housing investment has been so popular.  In a low interest rate and subsequently low return environment housing has, over recent years, offered attractive returns.  Whether this continues to be the case remains to be seen.