QBE’s Cyclical Deterioration In LMI

QBE Insurance reported their full year 2017 results today and  reported a statutory 2017 net loss after tax of $1,249 million, which compares with a net profit after tax of $844 million in the prior year.

This is a diverse and complex group, which is now seeking a path to rationalisation.  They declared their Asia Pacific result “unacceptable” and said the strategy was to “narrow the focus and simplify back to core” with a focus on the reduction in poor performing segments.
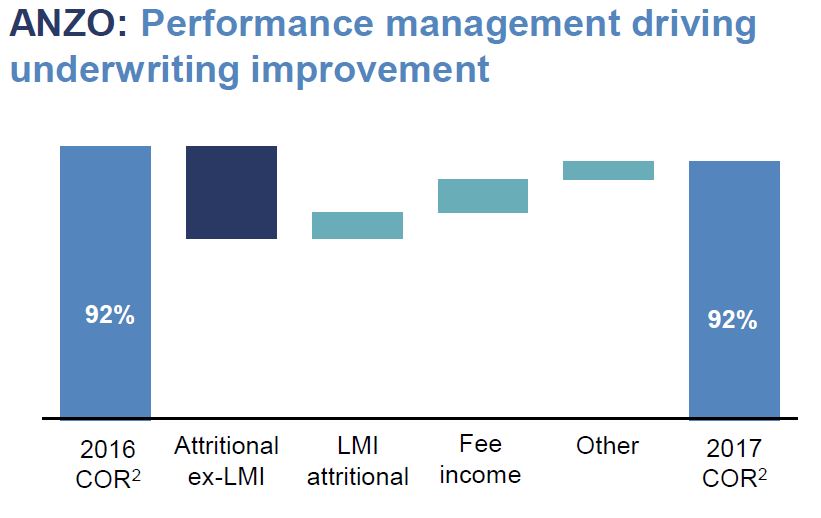
This begs the question. What is the status of their Lenders Mortgage Insurance (LMI) business? They reported a higher combined operating ratio consistent with a cyclical slowdown in the Australian mortgage insurance industry, higher claims and a lower cure rate. Very little detail was included in the results, but this aligns with similar experience at Genworth who reported a 26% drop in profit, the listed monoline and provides greater insight into the mortgage sector.

Both LMI’s are experiencing similar stresses, with lower premium income, and higher claims. And this before the property market really slows, or interest rates rise!  Begs the question, how secure are the external LMI’s?

QBE LMI reported a combined operating ratio of 50.7%, up from 34.9% in the prior year, largely reflecting an increase in the net claims ratio to 33.0% from 21.2% previously. The net claims ratio deteriorated due to a moderate increase in arrears rates, primarily related to properties located in mining towns in Western Australia and Queensland, coupled with an increase in the propensity for claims in arrears to generate claims (a reduced “cure” rate) and an increase in average claims severity. The commission ratio increased to 4.5% from 1.8% in the prior year, reflecting a lower exchange commission following the non-renewal of our external quota share reinsurance treaty. Note that QBE LMI (is required to) has their own reinsurance protection.

Notwithstanding reduced LMI earnings, Australian & New Zealand Operations’ combined operating ratio improved to 92.0%  from 92.4%  in the prior period, underpinned by a 1.8% improvement in the attritional claims ratio or 2.5% excluding LMI.

The overall results for the group includes the significant non-cash impairment of goodwill ($700 million) and write down of the deferred tax asset following the reduction in the US corporate tax rate ($230 million) in our North American Operations.

Overall, the results reflect the record cost of catastrophes in the second half of 2017 together with deterioration emerging markets businesses and two significant non-cash items. Notwithstanding comprehensive reinsurance protections, the net cost of catastrophes for QBE (after reinsurance) was $1,227 million in 2017 compared with $439 million in 2016.

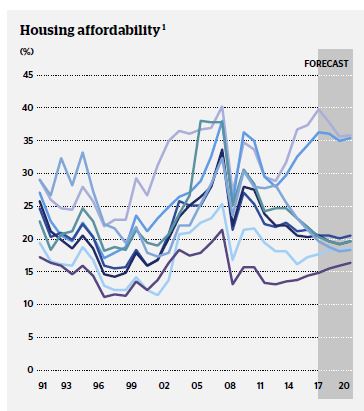
QBE Housing Outlook Forecasts Slowing Price Growth

The annual report produced by BIS Oxford Economics for QBE Lenders’ Mortgage Insurance says that the outlook for house and unit prices is likely to become more subdued over the next year or two. Many markets are now building too much stock, particularly units, after new dwelling starts peaked at a record 233,600 dwellings in 2015/16.

Restrictions on bank lending to investors are expected to be an increasingly prominent feature of the outlook for the market over 2017/18. This will most likely reduce investor purchaser activity and slow price growth. Owner occupier demand is also expected to weaken, as the emerging downturn in new dwelling commencements translates into lower building activity over 2017/18 and 2018/19 and negatively affects the economy.

Low affordability in Sydney and Melbourne should begin to impact on the potential for purchasers to take on a larger mortgages.

Demand and supply

Population growth has been strong. Net overseas migration inflows rose from 178,600 in 2014/15, to an estimated 215,000 in 2016/17. Slowing economic growth is expected to cause net overseas migration to ease to 175,000 by 2019/20. While lower than recent cycles, this figure is up compared to the long-term, 20-year trend of 171,100 per annum and is higher than most years through the 1990s and early 2000s. This will continue to fuel underlying demand for dwellings. New dwelling commencements rose to record levels in 2014/15 and 2015/16, and are still well above underlying demand. Only New South Wales, Victoria and Tasmania are expected to be in dwelling deficiency over the next three years. However, the excess stock in markets is more likely to be for units, which have accounted for the larger share of the upturn in new dwelling supply.

Lending environment

Low interest rates have helped drive up prices and investors have been a key source of demand. Successive initiatives by the financial regulators to dampen speculative investment has resulted in banks lowering loan-to-value ratios to investors, as well as charging higher interest rates to investors and for interest only lending. The latest restrictions on interest only loans are expected to cause a slowdown in investor lending over 2017/18. This is likely to have a negative effect on dwelling prices, with price falls expected in some cities.

Median prices

Median house price growth in Sydney and Melbourne is expected to weaken in 2017/18 due to lower investor activity in the market. This is expected to have a greater affect in Sydney, given its greater recent influence from investors. The emerging momentum in house price growth in Canberra and Hobart is forecast to continue in 2017/18. Modest house price rises are expected in Brisbane and Adelaide; with these markets being dampened by weak local economic conditions. The downturns
in Perth and Darwin are forecast to bottom out in 2017/18 although any recovery is likely to be drawn out. Unit price growth is forecast to underperform house price growth. A disproportionately higher number of units being built in most markets will result in an excess supply in units. Restrictions on investor lending will also have a negative effect, given units are more favoured by investors.

Affordability

While the demand and supply balance is important in determining pressure on prices and whether rents rise or fall, there is an upper limit on how much of a household’s income can be spent on mortgage repayments. As it becomes more difficult to service a mortgage on a property, further price growth becomes less possible unless incomes rise or interest rates reduce by a sufficient enough margin to make purchasing more affordable.

Affordability has deteriorated considerably in Sydney and Melbourne since 2012/13 due to strong house price growth. The ratio of mortgage repayments on a median priced house to average household disposable income is 39.7% in Sydney and 36.2% in Melbourne at June 2017. This is close to each city’s previous highs, indicating limited scope for continuing solid price growth.

Affordability has also become more difficult in Adelaide, Hobart and Canberra over the past 12 months, again due to rising prices.

Nevertheless, affordability is at levels similar to that seen in the early 2000s. In contrast, price reductions in Perth and Darwin have made purchasing a dwelling more affordable. Brisbane has remained at around the mid‑point of its historical range.Low affordability in Sydney and Melbourne should begin to impact on the potential for purchasers to take on a larger mortgage and bid up prices too much further. Moreover, it makes these markets vulnerable to rises in interest rates, as the most recent purchasers may have stretched themselves to buy their dwelling.

Notably, the better affordability in other cities is having a limited impact on prices. Weaker economic conditions and little growth in household incomes has made buyers more reluctant to overcommit on a loan. The better relative affordability should mitigate some of the downward pressure on prices in oversupplied markets and in resource‑sector exposed markets such as Perth, Darwin and to a lesser extent Brisbane.


QBE Lifts LMI Fees

From Australian Broker.

QBE has announced an increase in the cost of lenders’ mortgage insurance (LMI) for property investors with the surcharge (or pricing loader) rising from 7% to 12%, reports the Australian Financial Review.

LMI for owner-occupiers will remain as is with the 8% first home buyer discount being extended to mortgages up to $1.2 million.

This is the first increase in three years, a QBE spokesperson said.

“Our experience shows first home buyers perform better than our average portfolio and we are pleased to continue to provide an 8% discount. The premium loading for investors has been increased to 12%, reflecting increased risk compared to lending to owner-occupiers.”

The minimum fee for QBE’s new and existing LMI products will also increase to $950.

Despite these changes, the firm will remain competitive, the spokesperson said.

A spokesperson from Genworth told AFR the firm had increased rates by 5% in the first half of 2016. The firm provides LMI for National Australia Bank, Commonwealth Bank of Australia and over 100 smaller lenders.

QBE Under Pressure In 1H16 Results

QBE’s 2016 interim profit was $265 million, down 46% from $488 million in the same period last year, reflecting an adverse discount rate adjustment of $283 million compared with a benefit of $45 million in the prior period. The combined ratio increased to 99.0% from 95.3% in the prior period, again due to the decline in risk-free rates. The shares were marked down after the results.

http://930e888ea91284a71b0e-62c980cafddf9881bf167fdfb702406c.r96.cf1.rackcdn.com/data/tvc_d2bc4bfde301b8a87edf0eadb6c069aa.png

Revenue was flat at $7.89 billion, up just 1%, as insurances prices came under pressure. QBE has a $150 million cost-cutting target for the second half of the year (equating to a 1% improvement in the expense ratio).
They are impacted by the fall in global risk-free rates – to the point that around 77% of global sovereign bond yields are now below 1% while around 40% are negative.

Excluding the impact of discount rate movements, the interim result was underpinned by a combined operating ratio of 94.0%, in line with FY16 guidance of 94%–95%, albeit with a greater contribution from positive prior accident year claims development than originally envisaged.

The Australian & New Zealand Operations, was supported by strong returns in long tail portfolios and lenders’ mortgage insurance (LMI) business. However, the result included a significant deterioration in the attritional claims ratio as a result of increased NSW CTP claims frequency, coupled with premium pricing pressure, higher than normal claims inflation and increased claims frequency in short tail portfolios.

They say that a swift and decisive response is required and will encompass a combination of price increases, tightened terms and conditions and improved risk selection. They anticipate that the actions taken will benefit  attritional claims ratio in 2017.