The RBA released their latest Bulletin today and it contained an interesting section on Housing Accessibility For First Time Buyers. They suggest that in many centers, new buyers are able to access the market, at the current low interest rates. But the barriers are significantly higher in Melbourne, Sydney and Perth.
They also highlight that FHBs (generally being the most financially constrained buyers) are not always able to increase their loan size in response to lower interest rates because of lenders’ policies. Indeed, the average FHB loan size has been little changed over recent years while the gap between repeat buyers and FHBs’ average loan sizes has widened.
The article starts with an analysis of housing price-to-income ratios.
In Australia, the housing price-to-income ratio has increased since the early 1990s, and has increased particularly rapidly over the past five years to reach its highest level on record. At face value, this suggests that housing affordability is at a record low. However, this masks significant differences across states. The recent trend increase in the housing price-to-income ratio is largely due to increases in the ratios in New South Wales and Victoria (Graph 2). The housing price-to-income ratios have increased by less in other states in recent years and suggest that housing affordability in those states is at a similar level to the mid 2000s.
This housing affordability measure accounts for changes in average housing prices and household income. However, it ignores the effect of changes in interest rates on borrowing costs and other financial factors that may affect a household’s purchasing capacity and therefore their ability to purchase a home.
If interest rates fall, households can afford to repay a larger mortgage, all other things being equal. This would be reflected in a lower mortgage debt-servicing ratio, and would imply greater affordability. There is no role for changes to the deposit burden in the mortgage debt-servicing ratio, as the LVR is considered to be fixed. Looking at the trends over time, the aggregate mortgage debt-servicing ratio has risen over the
past year or so and is currently above the average of the inflation-targeting period but below historical peaks
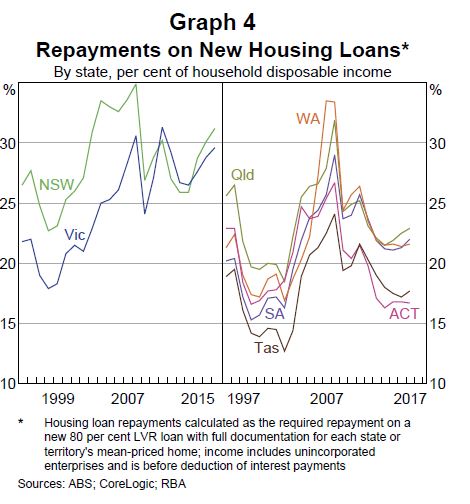
There are significant state variations.
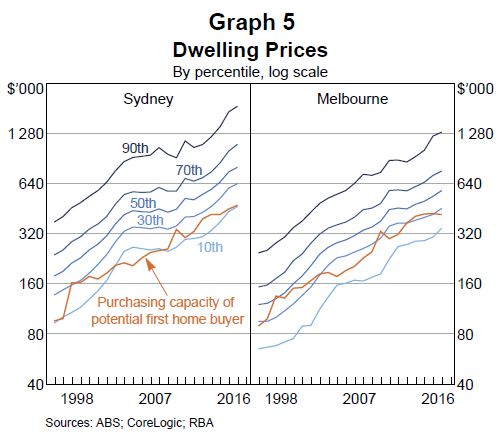
A shortcoming of the conventional estimates of housing affordability is that, by focussing on the average home price and average household income, they measure affordability for the average household. But the typical FHB is not the same as the average household – they tend to be younger and less wealthy. Also, if most FHBs buy homes that are cheaper than the average, then measures that focus on the average home will provide a poor guide to the ability of FHBs to purchase their first home (i.e. housing accessibility). To address these shortcomings, we construct a housing accessibility index that specifically focuses on the purchasing capacity of potential FHBs
This measure combines information from household surveys with data on all housing sale transactions in Australia. It shows housing accessibility is around the long-run average in aggregate in Australia, with the median potential FHB being able to afford around one-third of all homes sold in 2016, although this share is significantly lower in Sydney, Melbourne and Perth. Moreover, the quality of homes that potential FHBs can afford has fallen over time, as measured by location and the number of bedrooms. This measure also shows accessibility is lower in capital cities, particularly in areas close to the CBD.
The cost of renting is also an important component of housing affordability and the number of households renting has trended up over the past few decades. In aggregate, rents have grown broadly in line with household incomes, although rent-to-income ratios suggest housing costs for lower-income households have increased over the past decade.
At its meeting today, the Board decided to leave the cash rate unchanged at 1.50 per cent.
Conditions in the global economy have improved over 2017. Labour markets have tightened and further above-trend growth is expected in a number of advanced economies, although uncertainties remain. Growth in the Chinese economy continues to be supported by increased spending on infrastructure and property construction, although financial conditions have tightened somewhat as the authorities address the medium-term risks from high debt levels. Australia’s terms of trade are expected to decline in the period ahead but remain at relatively high levels.
Wage growth remains low in most countries, as does core inflation. In a number of economies there has been some withdrawal of monetary stimulus, although financial conditions remain quite expansionary. Equity markets have been strong, credit spreads have narrowed over the course of the year and volatility in financial markets is low. Long-term bond yields remain low, notwithstanding the improvement in the global economy.
Recent data suggest that the Australian economy grew at around its trend rate over the year to the September quarter. The central forecast is for GDP growth to average around 3 per cent over the next few years. Business conditions are positive and capacity utilisation has increased. The outlook for non-mining business investment has improved further, with the forward-looking indicators being more positive than they have been for some time. Increased public infrastructure investment is also supporting the economy. One continuing source of uncertainty is the outlook for household consumption. Household incomes are growing slowly and debt levels are high.
Employment growth has been strong over 2017 and the unemployment rate has declined. Employment has been rising in all states and has been accompanied by a rise in labour force participation. The various forward-looking indicators continue to point to solid growth in employment over the period ahead. There are reports that some employers are finding it more difficult to hire workers with the necessary skills. However, wage growth remains low. This is likely to continue for a while yet, although the stronger conditions in the labour market should see some lift in wage growth over time.
Inflation remains low, with both CPI and underlying inflation running a little below 2 per cent. The Bank’s central forecast remains for inflation to pick up gradually as the economy strengthens.
The Australian dollar remains within the range that it has been in over the past two years. An appreciating exchange rate would be expected to result in a slower pick-up in economic activity and inflation than currently forecast.
Growth in housing debt has been outpacing the slow growth in household income for some time. To address the medium-term risks associated with high and rising household indebtedness, APRA has introduced a number of supervisory measures. Credit standards have been tightened in a way that has reduced the risk profile of borrowers. Nationwide measures of housing prices are little changed over the past six months, with conditions having eased in Sydney. In the eastern capital cities, a considerable additional supply of apartments is scheduled to come on stream over the next couple of years. Rent increases remain low in most cities.
The low level of interest rates is continuing to support the Australian economy. Taking account of the available information, the Board judged that holding the stance of monetary policy unchanged at this meeting would be consistent with sustainable growth in the economy and achieving the inflation target over time.
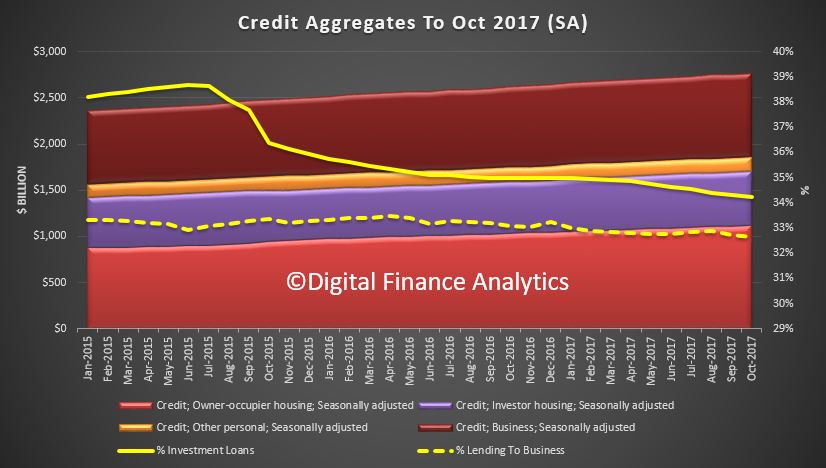
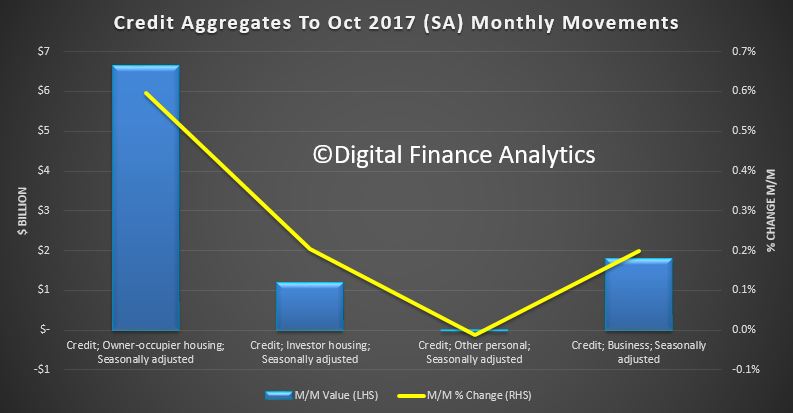
The latest data from the RBA, to end October 2017 , shows that lending for housing rose 0.5% in the month, and 6.5% for the past year (three times inflation!). Lending to business rose 0.3% to 4% over the past year and personal credit was flat, and fell 0.9% over the past year. Another $1.2 billion of housing loans were reclassified in the month, making $60 billion in total, this is more than 10% of the total investment loan book! The proportion of investor loans fell slightly again, down to 34.2% of portfolio
Total mortgage lending is now above $1,7 trillion, with owner occupied loans up 0.6% or $6.6 billion to $1.12 trillion, and investor loans up 0.2% or $1.2 billion to $584 billion. Comparing this with the APRA data, out today, we see continued relative growth in the non-bank sector.
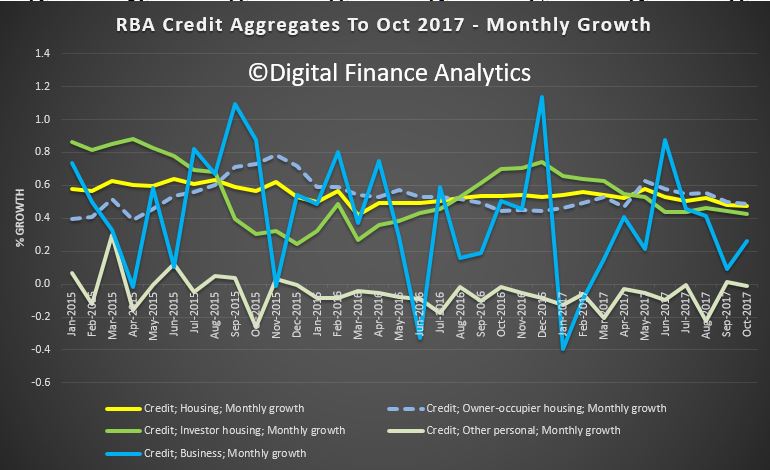
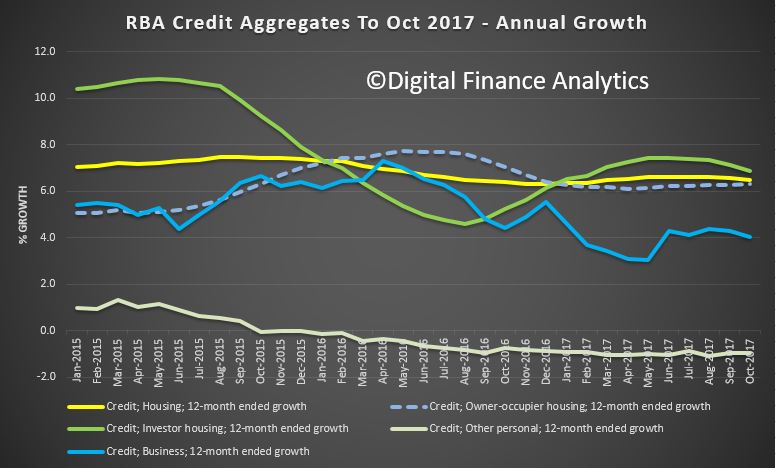
Here is the monthly growth plots, which even seasonally adjusted are noisy. The smoother annual plots shows a slowing trend across the mortgage sector, but with investor sector still growth at 6.9%, ahead of the owner occupied sector at 6.5%, or business at 4%. Further evidence the settings are wrong.
There is simply no excuse to allow home lending to be running at more than three times inflation or wage growth at the current dizzy price and leverage levels. Still too much focus on home lending and not enough on productive growth enabling business lending. This is something which the Royal Commission is unlikely to touch, as it is a policy, not a behaviourial issue.
The RBA says:
Following the introduction of an interest rate differential between housing loans to investors and owner-occupiers in mid-2015, a number of borrowers have changed the purpose of their existing loan; the net value of switching of loan purpose from investor to owner-occupier is estimated to have been $60 billion over the period of July 2015 to October 2017, of which $1.2 billion occurred in October 2017. These changes are reflected in the level of owner-occupier and investor credit outstanding. However, growth rates for these series have been adjusted to remove the effect of loan purpose changes.
RBA Governor Philip Lowe spoke at the Australian Business Economists Annual Dinner. Essentially, the conundrum of low inflation and wage growth, despite better employment means the cash rate will stay lower for longer, though the next move is likely up. High household debt is less about risks to the banking system and more about medium term financial stability, especially as rates rise. Household spending will remain muted. GDP is forecast to be higher because the fall in mining investment has ended, even if other business investment is still low.
This is a better read than the bland RBA minutes which also came out today!
Here is the speech:
There are three sets of questions that have occupied much of our time over the past year.
The first is how the final stages of the transition to lower levels of mining investment would play out.
The second is the degree to which an improving labour market would translate into a pick-up in wage growth and inflation.
And the third is the nature of risks stemming from high and rising levels of household debt and how to deal with those risks.
I will talk about each of these three issues and then conclude with how they have influenced the Reserve Bank Board’s decisions on monetary policy over the past year or so.
The End of the Transition
For a number of years we have been describing the economy as being in transition: a transition from very high levels of mining investment to something more normal.
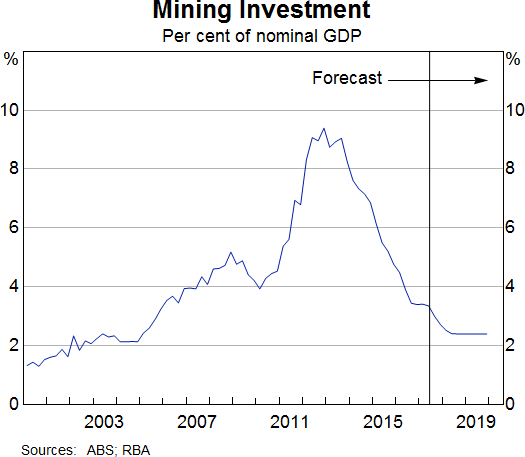
It is now time, though, to move to a new narrative. The wind-down of mining investment is now all but complete, with work soon to be finished on some of the large liquefied natural gas projects. Mining investment, as a share of GDP, is now back to something more normal (Graph 1). This means that, as I talked about in a recent speech, it’s time to open a new chapter in Australia’s economic history.
Graph 1
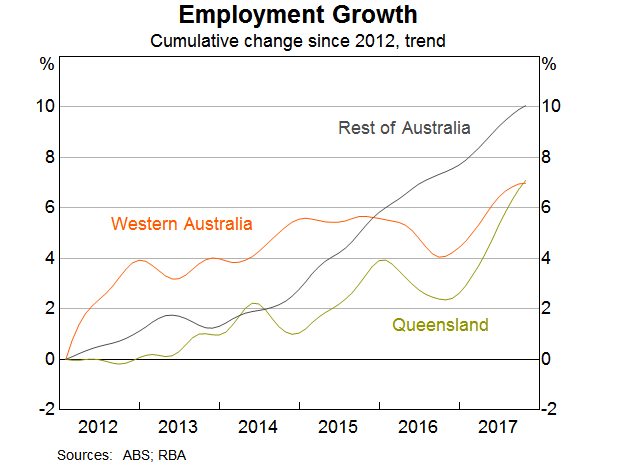
Over recent times, our judgement has been that this transition to lower levels of mining investment was masking an underlying improvement in the Australian economy. The decline in mining investment generated substantial negative spillovers to the rest of the economy. These spillovers were most evident in Queensland and Western Australia, where, for a while, growth in employment, investment and income were all quite weak.
The good news is that these negative spillovers from lower levels of mining investment are now fading. This was first evident in Queensland, where the labour market began to improve in 2015 (Graph 2). It is now evident too in Western Australia, where conditions in the labour market have improved noticeably since late last year. Elsewhere, there has been steady growth in employment for a number of years.
Graph 2
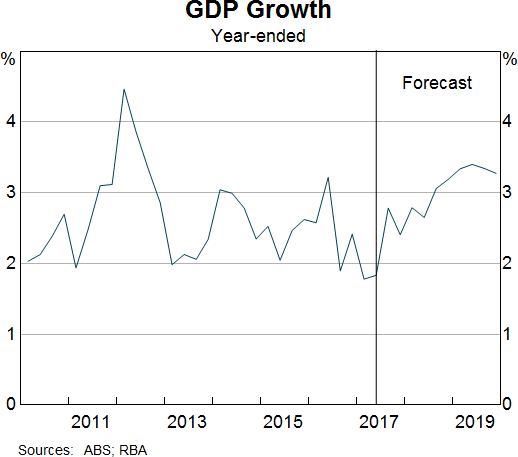
The fading of the negative spillovers is one reason why growth in the Australian economy is expected to strengthen over the period ahead. Another is the higher volume of resource exports as a result of all the mining investment. We expect GDP growth to pick up to average a bit above 3 per cent over 2018 and 2019 (Graph 3). If these forecasts are realised, it would represent a better outcome than has been achieved for some years now.
Graph 3
This more positive outlook is being supported by an improving world economy, low interest rates, strong population growth and increased public spending on infrastructure. All these things are helping.
Encouragingly, the outlook for business investment has brightened. For a number of years, we were repeatedly disappointed that non-mining business investment was not picking up. Part of the explanation was the negative spillover effects that I just spoke about, although, as my colleague Guy Debelle spoke about last week, there were other factors at work as well. Now, though, a gentle upswing in business investment does seem to be taking place and the forward indicators suggest that this will continue. It’s too early to say that animal spirits have returned with gusto. But more firms are reporting that economic conditions have improved and more are now prepared to take a risk and invest in new assets. This is good news for the economy.
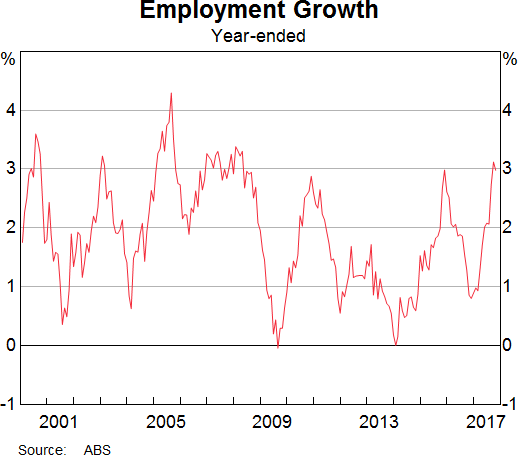
The improvement in the business environment is also reflected in strong employment growth. Over the past year, the number of people with jobs has increased by around 3 per cent, the fastest rate of increase for some time (Graph 4). This pick-up in jobs is evident across the country and has been strongest in the household services and construction industries. It is also leading to a pick-up in labour force participation, especially for women.
Graph 4
Business is feeling better than it has for some time and it is lifting capital spending and creating more jobs.
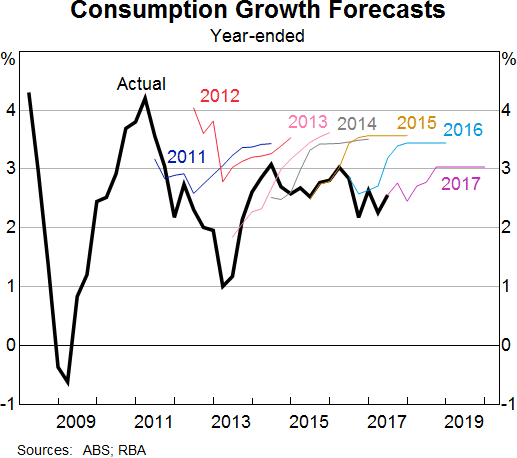
At the same time, though, growth in consumer spending remains fairly soft. Indeed, for a number of years consumption growth has been weaker than we had originally forecast. This is evident in this chart, which shows our forecasts for consumption growth at various points in time as well as the actual outcomes (black line) (Graph 5). The picture is pretty clear. For some years, consumption growth has been weaker than forecast and it has not exceeded 3 per cent for quite a few years.
Graph 5
The most likely explanation for the ongoing subdued consumption outcomes is the combination of weak growth in real household income and the high level of household debt. Given the persistence of these factors, our latest forecasts have incorporated a flatter profile for consumption growth than has been the case in previous forecasts.
An important issue shaping the future is how these cross-cutting themes are resolved: businesses feel better than they have for some time, but consumers feel weighed down by weak income growth and high debt levels.
Our central scenario is that the increased willingness of business to invest and employ people will lead to a gradual increase in growth of consumer spending. As employment increases, so too will household income. Some increase in wage growth will also support household income. Given these factors, the central forecast is for consumption growth to pick up to around the 3 per cent mark. This would be above the average growth of consumption for the current decade, but below the average for the period prior to the financial crisis.
Labour Market, Wages and Inflation
I would like to turn to the second question that has occupied us over much of the past year: the degree to which an improving labour market will translate into a pick-up in wage growth and inflation.
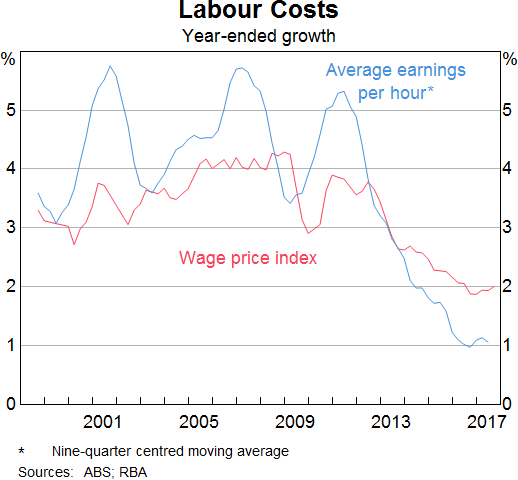
A distinguishing feature of Australia’s recent economic performance has been the slow growth in wages. The Wage Price Index has increased by just 2 per cent over the past year. Whereas in earlier years, Australians had got used to average wage increases of around the 3½–4 per cent mark, 2–2½ per cent is now the norm (Graph 6). Growth in average hourly earnings has been weaker still: in trend terms it is running at the lowest rate since at least the 1960s. Not only are wage increases low, but some people had been moving out of high-paying jobs associated with the mining sector into lower-paying jobs. We have heard from our liaison program that there has been downward pressure on non-wage payments, including allowances, and an increase in the proportion of new employees hired on lower salaries than their predecessors.
Graph 6
As I noted earlier, subdued growth in wages is also occurring in a number of other countries. Understanding this is a major priority. Low growth in wages means low inflation, which means low interest rates, which means high asset valuations. So a lot depends on understanding the reasons for slow growth in nominal and real wages. The answer is likely to be found in a combination of cyclical and structural factors.
In Australia, we are still some way short of our estimates of full employment of around 5 per cent, so it is not surprising that wage growth is below average.
But structural factors are likely to be at work as well. Foremost among these are perceptions of increased competition.
Many workers feel there is more competition out there, sometimes from workers overseas and sometimes because of advances in technology. In the past, the pressure of competition from globalisation and from technology was felt most acutely in the manufacturing industry. Now, these same forces of competition are being felt in an increasingly wide range of service industries. This shift, together with changes in the nature of work and bargaining arrangements, mean that many workers feel like they have less bargaining power than they once did.
But this is not the full story. It is likely that there is also something happening on the firms’ side as well. In other advanced economies where unemployment rates are below conventional estimates of full employment, the normal tendency for firms to pay higher wages in tight labour markets appears to be muted. Businesses are not bidding up wages in the way they might once have. This is partly because business, too, feels the pressure of increased competition.
One response to this competitive pressure is to have a laser-like focus on containing costs. Over recent times there has been a mindset in many businesses, including some here in Australia, that the key to higher profits is to reduce costs. Paying higher wages can sit at odds with that mindset.
Given these various effects, it is plausible that, at least for a while, the economy is less inflation prone than it once was. Both workers and firms feel more competition, and it is plausible that the wage- and price-setting processes are adjusting in response.
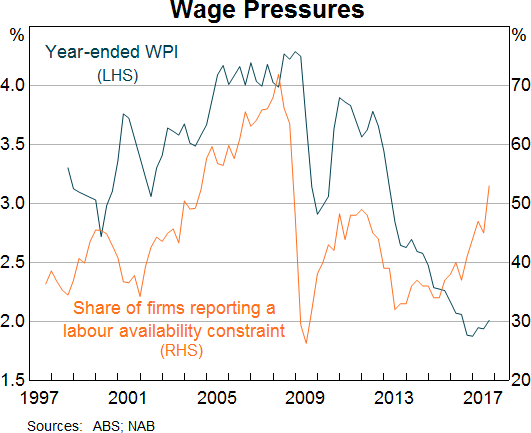
This, of course, does not mean that the normal forces of supply and demand have been abandoned. Tighter labour markets should still push up wages and prices, even if it takes a little longer than we are used to. We are starting to see some hints of this in the Australian labour market. Business surveys report that firms are having more difficulty finding suitable labour than they have for some time (Graph 7). In the past, when firms found it difficult to find suitable labour, higher growth in wages resulted. Consistent with this, we are hearing reports through our liaison program that in some pockets the stronger demand for workers is starting to push wages up a bit. We expect that as employment growth continues, these reports will become more common.
Graph 7
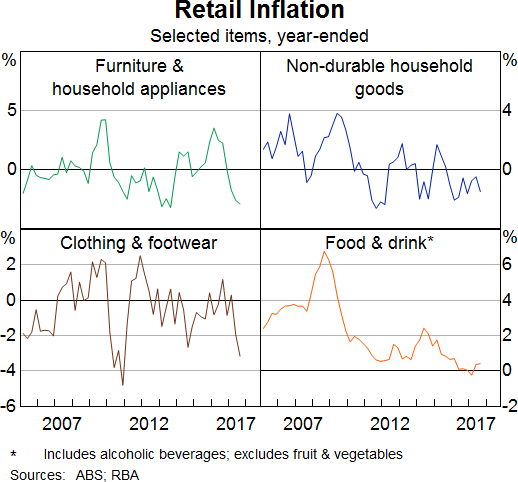
Another factor that has a significant bearing on the outlook for inflation is the increased competition in the retail industry. I spoke a few moments ago about how, globally, increased competition is affecting pricing dynamics. Australian retailing provides a very good example of this. Competition from new entrants is putting pressure on margins and is forcing existing retailers to find ways to lower their cost structures. Technology is helping them to do this, including by automating processes and streamlining logistics. The result is lower prices.
For some years now, the rate of increase in food prices has been unusually low. A large part of the story here is increased competition. The same story is playing out in other parts of retailing. Over recent times, the prices of many consumer goods – including clothing, furniture and household appliances – have been falling (Graph 8). Increased competition and changes in technology are driving down the prices of many of the things we buy. This is making for a tough environment for many in the retail industry, but for consumers, lower prices are good news.
Graph 8
A question we are grappling with here is how much further this process has to run. It is difficult to know the answer, but our sense is that the impact of greater competition on consumer prices still has some way to go as both retailers and wholesalers adjust their business models. So this is likely to be a constraining factor on inflation for a while yet.
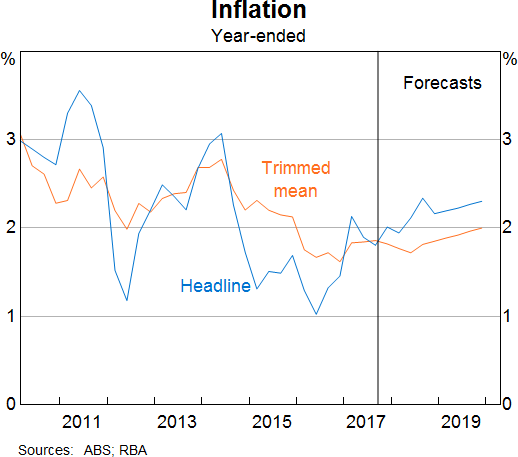
Putting all this together, we expect inflation to pick up, but to do so only gradually (Graph 9). By the end of our two-year forecast period, inflation is expected to reach about 2 per cent in underlying terms, and a little higher in headline terms because of planned increases in tobacco excise. Underpinning this expected lift in inflation is a gradual increase in wage growth in response to the tighter labour market.
Graph 9
High and Rising Household Debt
The third question we have focused on over recent times is the implications of the high and rising level of household debt.
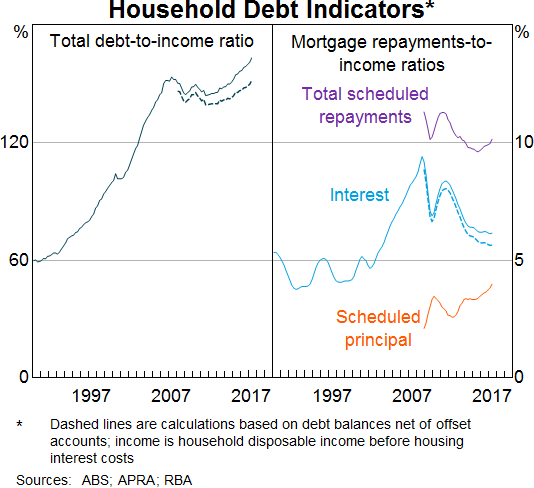
The growth in household debt has been outpacing the very low growth in household incomes for a few years now. As a result, the household debt-to-income ratio has risen, although if account is taken of the increased balances held in offset accounts the rise is less pronounced (Graph 10). The low level of interest rates means that even though debt levels are higher, the share of household income devoted to paying mortgage interest is lower than it has been for some time. Perhaps reflecting this, as well as the recent decline in the unemployment rate, aggregate indicators of household financial stress remain quite low.
The central issue here is how the high levels of debt affect the stability of the economy over the medium term. Our concern has not been the stability of the banking system; the banks are strong and they are well capitalised. Rather, the concern has been that as the household sector takes on ever-more debt relative to its income, the risk of medium-term problems increases. This is especially so when this debt is taken on in an unusually low-interest rate environment.
Graph 10
It is difficult to be precise about exactly how much this risk has increased, but our judgement has been that, should earlier trends have continued, the risk of future problems would have continued to increase. A scenario we have focused on is the possibility of a future shock that causes households to abruptly reassess their past borrowing decisions. In this scenario, consumption might be wound back sharply to put balance sheets on a sounder footing. If this occurred, it could turn an otherwise manageable shock into something more serious.
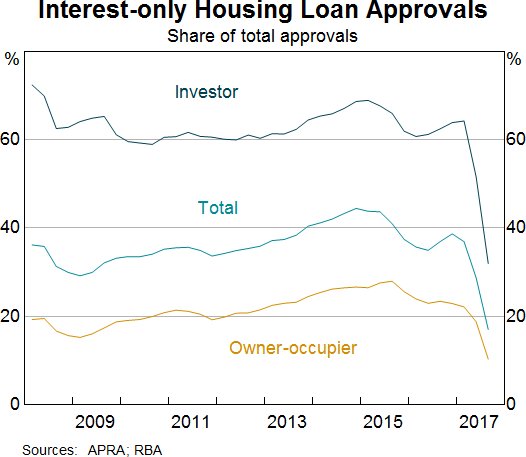
One way of guarding against this risk is for lenders to maintain strong lending standards. The various steps taken by the Australian Prudential Regulation Authority (APRA) – with the strong support of the Council of Financial Regulators – have worked in this direction. Growth in lending to investors has slowed, fewer loans are being made with very high loan-to-valuation ratios, debt-servicing tests have been tightened and fewer interest-only loans are being made. The latest data suggest that the banks have more than succeeded in reducing interest-only lending to below the 30 per cent benchmark (Graph 11). These are all positive developments but it is an area we, together with the Council of Financial Regulators, continue to watch closely.
Graph 11
Recently, we have also seen some cooling in the Sydney property market. This reflects a combination of factors, including increased supply of new dwellings, some tightening of credit conditions, higher interest rates on loans to investors and some reduction in offshore demand. The increasing unaffordability of prices for many people has also probably played a role. In Melbourne, where the population is growing very strongly, housing prices are still increasing faster than incomes, although the rate of increase has slowed. Elsewhere, housing prices have been little changed over recent months. Conditions are subdued in Brisbane, where the supply of apartments has increased significantly, and remain weak in Perth, owing to slowing population growth following the unwinding of the mining investment boom.
It is important to be clear that the RBA does not have a target for housing prices. But a return to more sustainable growth in housing prices does reduce the medium-term risks. These risks have not gone away, but the fact that they are not building at the rate they have been is a positive development.
Monetary Policy
I would like to conclude with what all this has meant for monetary policy over the past year or so.
As you are aware, the Reserve Bank Board has kept the cash rate unchanged at 1.5 per cent since August last year.
In the early part of that period, a central issue was balancing the need to support the economy in the final days of the transition to lower levels of mining investment against the risks stemming from rising household debt. Lower interest rates might have provided a bit more support, but would have done so partly by encouraging people to borrow yet more money, thus adding to the risks. The Board’s judgement was this would not have been consistent with its broad mandate for economic stability. Accordingly, with the economy expected to pick up and the unemployment rate to come down gradually as the mining investment transition came to an end, the Board judged it appropriate to hold the cash rate at 1.5 per cent. We were prepared to be patient in the interests of medium-term economic stability.
As the year progressed, we became somewhat more confident that the expected pick-up in growth would materialise. The strengthening in the global economy has helped here. So too has the lift in employment and the better outlook for investment. This improvement meant that the case for lower interest rates weakened over the year.
Also, as the year progressed, one issue the Board paid increasing attention to was the persistently weak growth in wages and household incomes and the implications for consumption. A related issue is the effect of increased competition on the wage and price dynamics in the economy. As I said earlier, we are still trying to understand this. It does, though, look increasingly likely that these factors will mean that inflation remains subdued for some time yet. We still expect headline inflation to move above 2 per cent on a sustained basis, but it is taking a bit longer to get there than we had earlier expected.
So, in summary, over the past year or so there has been progress in moving the economy closer to full employment and in having inflation return to the 2 to 3 per cent range. Both of these are positive developments and suggest a more familiar normal is still in sight. Progress on these fronts has been made while also containing the build-up of risks in household balance sheets.
We still, though, remain short of full employment, and inflation is expected to pick up only gradually and remain below average for some time yet. This means that a continuation of accommodative monetary policy is appropriate. If the economy continues to improve as expected, it is more likely that the next move in interest rates will be up, rather than down. But the continuing spare capacity in the economy and the subdued outlook for inflation mean that there is not a strong case for a near-term adjustment in monetary policy. We will, of course, continue to keep that judgement under review.
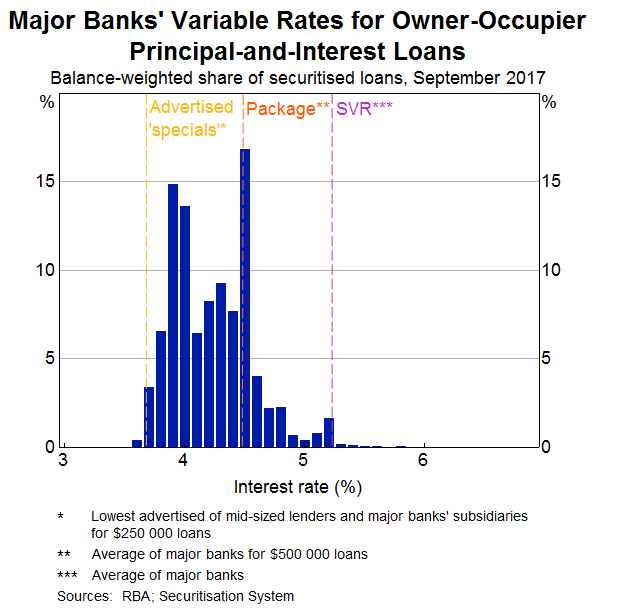
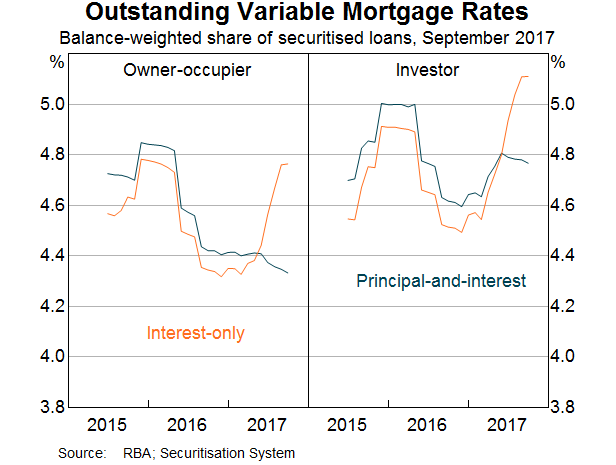
Two insights. First the LVR distribution (skewed because of the securitisation rules). But her claim “on average, securitised loans appear to be no riskier than the broader population of mortgages, at least on these metrics” is unproven. Second there is an interesting distribution of mortgage rates, between interest-only and principal and interest loans, the latter being significantly higher. There is now a greater proportion of principal-and-interest loans with an interest rate below 4 per cent, due to the lower rates applied to owner-occupier loans, and there has reportedly been increased competition for these types of loans.
Absolutely no discussion on the critical Loan to Income ratios, which should be available in the data!
The dataset includes two types of residential mortgage-backed securities (RMBS): ‘marketed securities’, which have been sold to external investors, and ‘self-securitised’ deals. Self-securitisations are retained by the bank that created them and are used solely to access central bank liquidity. The Reserve Bank accepts self-securitised assets for this purpose for a number of reasons, most notably a shortage of securities considered to have sufficient credit quality and liquidity. However, the Reserve Bank accepts as eligible collateral only the highest credit quality asset-backed securities, that is those with a AAA, or equivalent, rating.
The insights I will talk about today come from the loan-level data underlying these securities. Loans underlying securitisations are not necessarily representative of the entire mortgage market across all its dimensions. In particular, the choice of mortgages in the collateral pool may be influenced by the way credit ratings agencies assign ratings, investors’ preferences and also by the Reserve Bank’s repo-eligibility framework. However, self-securitisations, which represent the bulk of the dataset, cover a significant share of all mortgages in Australia. For this reason, we could expect the mortgages underlying self-securitisations to be more representative of banks’ balance sheets than those of marketed RMBS.
Data are currently received each month (with a one-month lag) on 1.6 million individual mortgages, with a total value of around $400 billion. This accounts for about one-quarter of the total value of housing loans outstanding in Australia. Around 100 data fields are collected for each mortgage, covering a broad range of variables including loan characteristics, borrower characteristics and details on the collateral underpinning the mortgage.
The Securitisation Dataset allows us, along with other investors in asset-backed securities, to undertake a rich analysis of the securities they hold and more accurately assess their risk and pricing than would be possible without this information. In our case, it allows us to undertake our own risk assessment and not be dependent on rating agencies. But the loan-level data also enable us to gain valuable insights into mortgages that are not readily available from other sources. Today I want to share with you some of these insights.
Mortgage Characteristics
So, what do the data tell us about the loans underlying securitisations and so about the risks faced by investors in these securities?
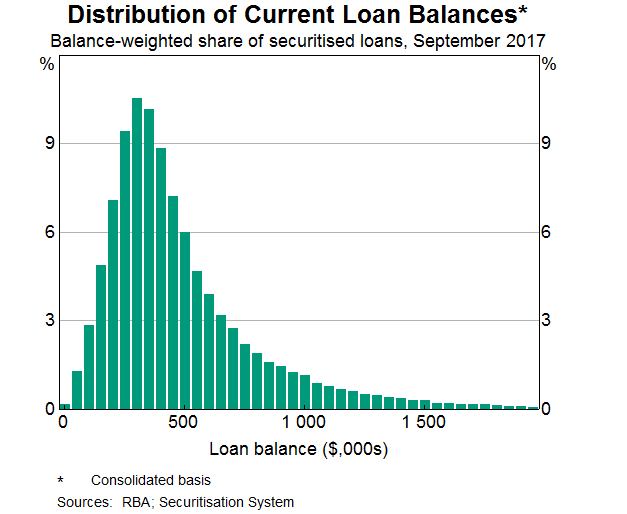
Let’s look at the current size of outstanding mortgages. The average loan size in the dataset is $300,000 (ignoring any funds held in offset balances). Mortgages underlying securitisations appear to be, on average, smaller than the population of all mortgages. This graph shows the distribution of loan sizes (using a histogram) (Graph 1). Each loan is weighted by its balance, such that larger loans are given a larger weight. Weighting the distribution provides a more accurate reflection of potential exposures from a risk perspective. As you can see, there is a wide range in the size of mortgages; by value, 7 per cent of loans have a balance greater than $1,000,000.
Graph 1
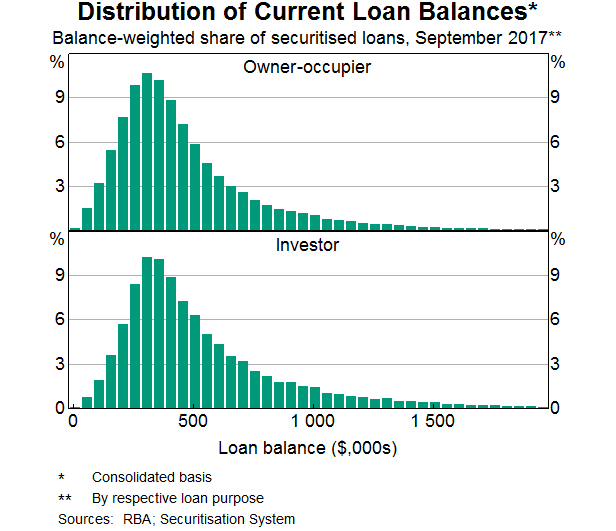
Let’s look at owner-occupier and investor loans separately (Graph 2). The distribution of loan size is similar for the two groups but there is a greater proportion of large investor loans. This could reflect the tax incentives for investors to take on and sustain more leverage than owner-occupiers, maximising the amount of funds borrowed and limiting repayments. But it also reflects that investors appear to have a higher ability to pay off larger loans. For each mortgage in the Securitisation Dataset we also have information on the borrower, including their income. We find that borrowers with investor loans typically have higher incomes than those with owner-occupier loans and so have a greater borrowing capacity.
Graph 2
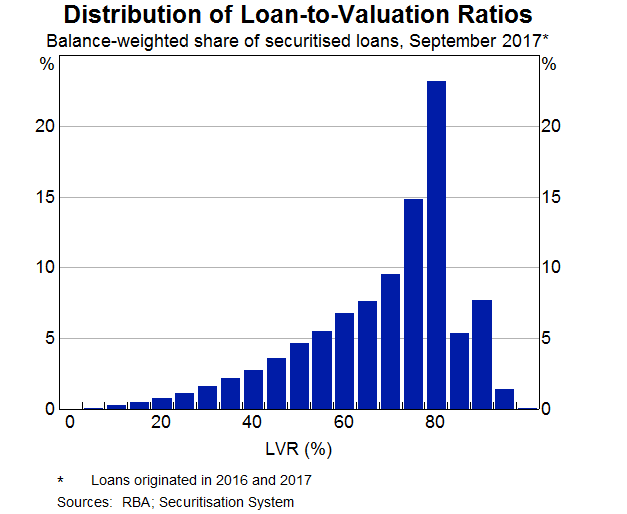
The loan-to-valuation ratio (LVR) is an important indicator of the riskiness of a loan. Here we show the distribution for LVRs based on the current loan balance and the most recent available property valuation for mortgages issued over the past two years (Graph 3). You can see a concentration of loans with LVRs between 70 to 80 per cent – around one-third of loans are in that group – but only a small share of loans have LVRs higher than that. This reflects a few factors. Banks limit loans with LVRs (at origination) above 80 per cent, and these high-LVR borrowers are typically required to pay for lenders’ mortgage insurance. Also, credit rating agencies apply large penalty factors in their credit risk assessments of high-LVR loans in a collateral pool. So it’s not surprising that there are relatively fewer high-LVR loans in the Securitisation Dataset compared with the broader population of loans.
Graph 3
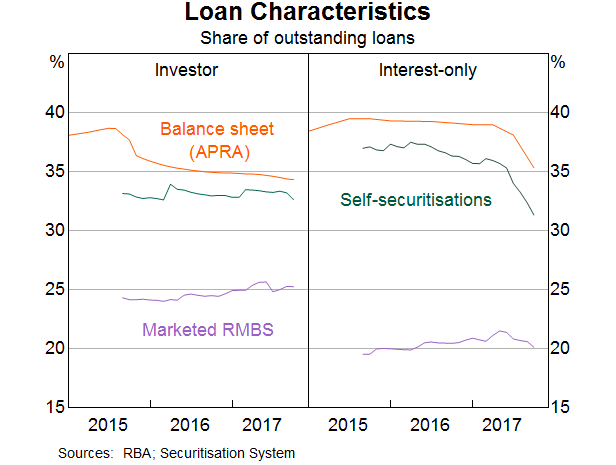
Let’s turn to investor and interest-only loans; these have received some attention from regulators in recent years. This has included measures by the Australian Prudential Regulation Authority (APRA) to tighten lending standards on these types of loans. The next graph shows the share of investor and interest-only loans in the Securitisation Dataset and a measure from APRA that covers the broader housing loan market (Graph 4). The first thing to note is that marketed securities have a lower share of investor and interest-only loans than the general population captured by the APRA data. For self-securitisations, these shares are more closely aligned to the composition of the banks’ total mortgage portfolio. The second point of interest is the very recent large decline in interest-only loan shares in self-securitisations, which is consistent with changes in the broader stock of outstanding mortgages; these declines have occurred alongside measures by APRA to limit new interest-only lending.
Graph 4
To summarise so far, we have looked at a number of characteristics of securitised mortgages that can be associated with the riskiness of these loans, in particular LVRs and whether they are investor or interest-only loans. Two things stand out: there is a wide distribution of these characteristics across different loans and, on average, securitised loans appear to be no riskier than the broader population of mortgages, at least on these metrics.
Mortgage Interest Rates
Variation in interest rates across loans is an important way for lenders to account for the different risks of mortgages. More creditworthy borrowers or lower-risk mortgages are typically offered lower interest rates, while borrowers with higher-risk mortgages would expect to pay higher interest rates. Interest rates on mortgages may also be influenced by other factors such as competition between lenders, bank funding costs, the regulatory environment and policy settings.
There are different types of measures readily available when assessing mortgage interest rates, such as standard variable rates or package rates. However, these measures do not necessarily reflect interest rates actually paid, since banks typically apply unadvertised discounts. Some of the variation in rates actually paid reflects variation in creditworthiness across borrowers. The Securitisation Dataset includes the actual interest rate paid on each mortgage and so can provide both timely and granular insights into housing interest rates that are not available from many other sources.
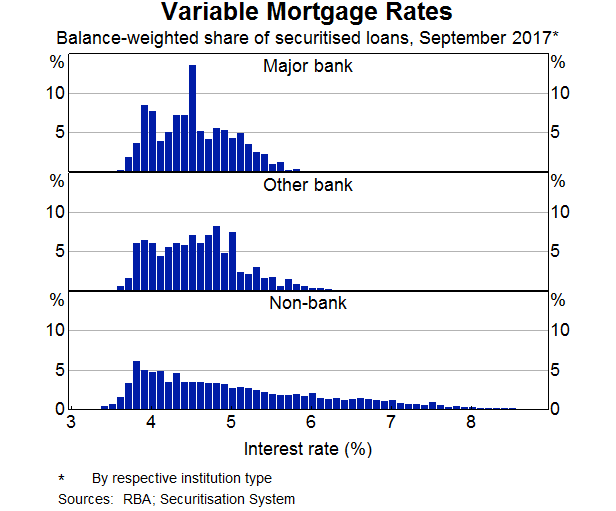
The next graph shows the distribution of interest rates paid on variable-rate mortgages across different lenders (Graph 5). The major banks offer a wide range of interest rates but the distribution is comparable to smaller banks. There is an even wider range of interest rates offered by non-bank lenders. This wider range to a large extent reflects that this category covers a variety of lenders targeting different types of borrowers and mortgages. There are some non-bank lenders that offer products with a similar level of interest rates to the banks. Other non-bank lenders specialise in providing riskier mortgages, such as to borrowers that require ‘alternative’ or low-documentation loans or have impaired credit histories.
Graph 5
The most common mortgages in the Australian housing market are owner-occupier loans with principal-and-interest repayments. So, let’s look at the distribution of interest rates paid for this type of loan in more detail, focusing on loans of the major banks (Graph 6). On the graph are marked three other interest rate measures. The line on the right is the relevant standard variable rate (SVR). Very few borrowers actually pay the SVR (or a higher interest rate); rather, borrowers are generally offered a discount relative to this reference rate. The discounts offered vary by borrower and lender, and also vary over time.
Graph 6
The second type of interest rate indicated, the middle vertical line in the graph, is the average ‘package’ rate. A typical package mortgage product has additional features beyond the ‘basic’ mortgage (such as an offset account) and may be bundled with other products (such as a credit card). Packages often include advertised discounts. A large share of loans has an interest rate consistent with the average package rate; however, the majority of loans have an interest rate below the average package rate.
The line furthest to the left shows the advertised ‘specials’ rate. Only a small share of loans in the dataset has an interest rate consistent with this lowest advertised rate. This may be because not many borrowers either qualify or seek loans at the advertised specials rate. Another reason is that advertised specials are interest rates on new loans, and new loans have attracted in recent years larger discounts compared with existing loans, as I will discuss later.
For the major banks, the interest rates on most loans are within the range set by the advertised specials rate and the package rate. Preliminary econometric analysis suggests that LVRs and loan size are important determinants of the discount offered to borrowers. Large loans typically have lower interest rates. One factor is that the loan size a borrower qualifies for is correlated with the borrower’s net income, which, in turn, is correlated with a better ability to repay. Also, borrowers seeking larger loans may have more bargaining power to negotiate greater discounts given the fixed costs associated with issuing loans.
The data shown in the distributions can be aggregated to provide a measure for the average outstanding interest rate on existing loans (Graph 7). (You may have seen similar graphs in some of our recent publications; the data underlying these graphs are from the Securitisation Dataset.) The outstanding interest rates on the four main types of mortgages – owner-occupier or investor, and principal-and-interest or interest-only – have changed over the past years partly in response to regulatory measures. These changes are also evident in the variable interest rate loans in the Securitisation Dataset. In the latter part of 2015, investor loans became more expensive compared with owner-occupier loans. This was in response to regulatory measures designed to limit the pace of growth of investor credit. Over the past year, regulatory measures have focused on limiting new interest-only lending. In response, lenders have increased rates on interest-only loans several times while lowering rates on principal-and-interest loans.
Graph 7
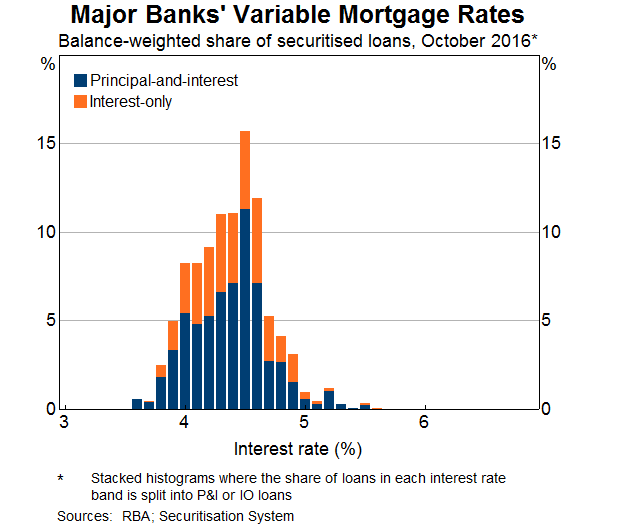
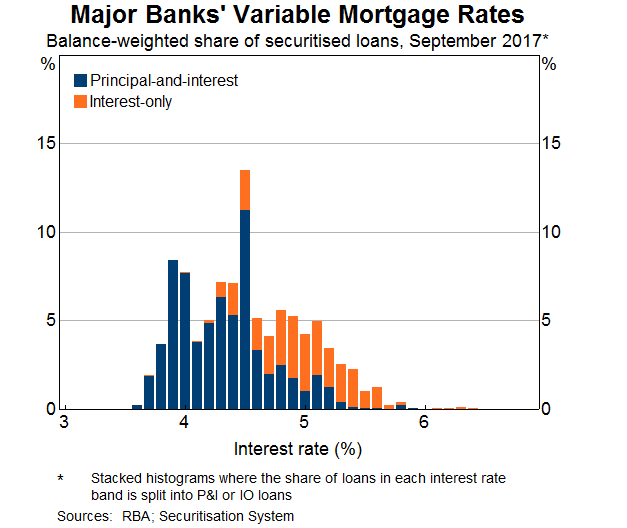
The response of the banks to the regulatory changes can also be measured by examining how the distribution of interest rates has changed. Here you can see a stacked histogram (Graph 8). For each interest rate band on the horizontal axes, it shows the share of loans that have either principal-and-interest (blue bars) or interest-only (orange bars) repayments. You can see the large overlap between the two distributions for interest-only and principal-and-interest loans before the introduction of limits on new interest-only lending. There has since been a marked repricing of loans within those two groups in response to the regulatory measures. You can now see a clear separation between the distributions (Graph 9). Interest rates on interest-only loans have increased and the distribution has shifted towards the right, following the large rate increases for both owner-occupier and investor loans in that category. Mortgages with an interest rate below 4 per cent are now almost exclusively principal-and-interest loans.
Graph 8
Graph 9
The distribution of principal-and-interest loans has also changed following the regulatory measures. There is now a greater proportion of principal-and-interest loans with an interest rate below 4 per cent, due to the lower rates applied to owner-occupier loans, and there has reportedly been increased competition for these types of loans.
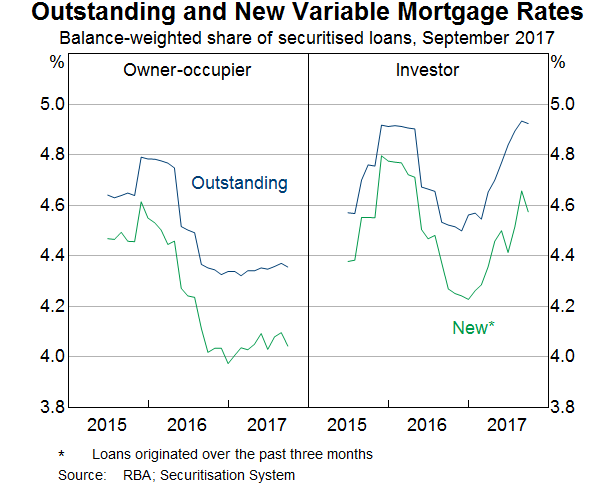
So far, we have looked at interest rates on all outstanding loans. As indicated earlier, another important measure is the interest rate for newer loans. While changes to SVRs, or reference rates, are directly transmitted to all borrowers with variable-rate loans, interest rates offered to new borrowers may move independently of reference rates depending on lenders’ discounting decisions. In this graph I show estimates obtained from the Securitisation Dataset for the interest rate on recently issued mortgages (Graph 10). As you can see, the average interest rate on new loans has been consistently lower than the interest rate on outstanding mortgages over the past few years. Over the past 12 months, the degree of discounting has in fact increased. This has been the case for both owner-occupier and investor loans. The increase in interest rate discounts offered to new borrowers over the past year suggests that competition for customers is stronger for new borrowers than for existing borrowers. The Reserve Bank has noted the apparent difference in competition for new and existing borrowers in its recent submission to the Productivity Commission’s Inquiry into ‘Competition in the Financial System’.
Graph 10
In this second part of my talk, I have highlighted three insights that we have gained from the dataset on mortgage interest rates actually paid by different borrowers and how they vary over time. First, as is the case with the size and LVRs of mortgages, there is a wide distribution of interest rates paid across different types of mortgages and borrowers. Second, in response to recent regulatory measures, these distributions have changed. And third, we have found that advertised and unadvertised discounts to reference rates are commonplace. These discounts have increased in recent years, such that new borrowers often pay lower interest rates than existing borrowers for similar types of mortgages.
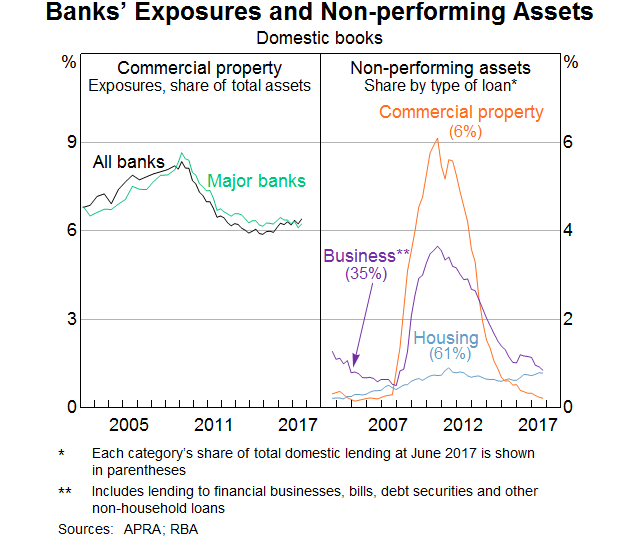
RBA Head of Financial Stability Jonathan Kearns, spoke at Aus-China Property Developers, Investors & Financiers today. He said the Bank has responsibility to promote the stability of the financial system as a whole so carefully monitors property markets because poor commercial property lending and the large stock of residential property debt means risks to financial stability and household resilience.
The high valuation of commercial property increases the potential for a sharp correction and so the risks from commercial property lending. The high level of household mortgage borrowing also brings risks, both for lenders and households.
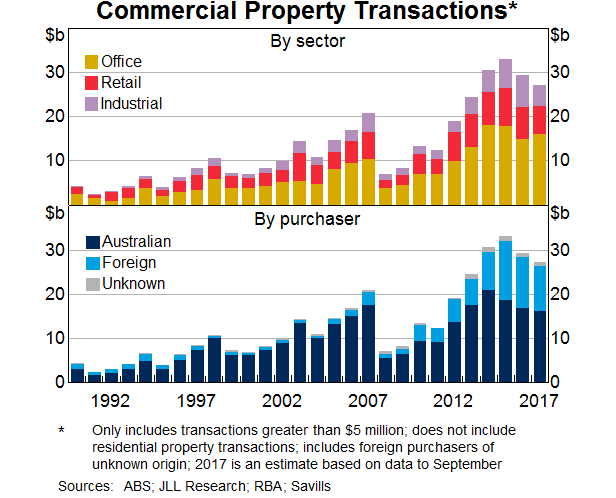
He also discussed the impact of purchases and financing by foreigner investors and banks. Nationally, purchases by foreign buyers are equivalent to around 10-15 per cent of new construction, or about 5 per cent of total housing sales. But he said, these purchases by foreign buyers do not, on the whole, reduce the supply of dwellings available to local residents and in fact may actually contribute to expansion of the housing stock. However, these purchases by foreign buyers, particularly for investment purposes, are a more recent phenomenon and so their impact on the housing cycle is less clear.
Property and Financial Stability
The property market is important for financial stability for a number of reasons. In the past, banks have experienced substantial losses on their commercial property lending because of its large cycles. Residential property is also important for financial stability because residential mortgages account for a very large share of banks’ lending in Australia. Because of the high value of households’ mortgage debt and housing assets, the property market also has implications for the resilience of households’ balance sheets. Today, I will outline the connection of financial stability with commercial property, and then with residential property.
Internationally, banks experienced substantial losses on their commercial property lending in the financial crisis. In Australia the performance of commercial property lending also deteriorated, but losses were relatively moderate.
Graph 1
However, Australia does have its own history in the early 1990s of large losses on commercial property lending, resulting in individual lenders needing to be rescued and threatening the stability of the financial system. In five years, Australian banks experienced losses of around 10 per cent of their loans, concentrated in their commercial property lending.
This was a classic boom-bust or ‘hog cycle’ story. The second half of the 1980s saw buoyant economic conditions, strong growth in commercial property prices and a large increase in commercial property construction.
A ready supply of credit fuelled the boom. Following bank deregulation and the entry of foreign banks into the domestic market in the mid 1980s, the domestic banks competed to hold on to their market share. Lending standards were lowered and business credit grew by around 25 per cent each year in the second half of the 1980s. With the economy overheating, monetary policy was tightened. Increased interest payments and the economy falling into recession resulted in rising losses on business lending. Office prices halved from their peak as construction initiated in the late 1980s added to supply in an already falling market. Losses mounted at banks with two having to be rescued, and one major bank needing to raise capital.
As notable as this episode seems, it follows a script that had played out before domestically and has since internationally. There are several aspects to commercial property lending that make it inherently risky, and typically more risky than residential mortgage lending. A large share of banks’ commercial property lending is for construction and development, including for large apartment buildings. Construction and development loans tend to be riskier because the property isn’t yet earning rent, things can go wrong in the often complex construction phase, and market conditions can change in the several years or more it takes to complete large projects. Losses can also be greater on lending for commercial property than for residential property because borrowers with a limited liability company structure have less incentive to repay than individual residential mortgage borrowers who face full recourse.
Adding to the risk is that the availability of finance for commercial property has tended to be pro-cyclical. A booming property market has often led to an easing of both lending standards and borrowers’ collateral constraints just as demand for funding is rising. Relative to residential property, the greater ability for funding to come from outside established lenders adds to this cyclicality. Commercial property lending can be syndicated and large individual projects make it easier for new banks to enter the market at a relatively low cost. This cyclicality of lending can accentuate the cycles in commercial property construction and prices.
Foreign investors may add to the cyclicality of the commercial property market if they tend to enter the market when prices have been rising and there are more properties for sale. Alternatively, if foreign investors’ decisions are largely influenced by conditions in their home country rather than the domestic market they may actually moderate the domestic property cycle. Foreign banks direct links to domestic banks tend to be small, so their impact on the domestic financial system is likely to be indirect through an amplification of the credit cycle and property market.
Historically, residential property lending has been less risky for banks than commercial property lending. Indeed, the stress test conducted by APRA indicated that Australian banks have sufficient capital to survive a deep recession and a collapse in the housing market. However, the sheer size of mortgage lending on Australian banks’ books means that residential loan performance is critical to banks’ health and so the stability of the broader financial system. Housing debt is also important for the resilience of the household sector in Australia. The ratio of household debt to income is high in Australia relative to other advanced economies, and has edged higher since the financial crisis.
In Australia, unlike many other countries, individual households also borrow to directly purchase investment properties, which may add to risk. More than one-in-ten tax payers owns an investment property. Most of these are geared, so much so that the majority do not earn positive income for their owners. While these borrowers generally start with smaller loans, and most of the debt is held by high-income households, they have less incentive to pay down their mortgage ahead of schedule because of the tax benefits of debt and so tend to retain higher mortgage balances over the lifetime of the loan.
Despite the high level of mortgage borrowing, various factors mitigate the risks to the financial system. Housing debt is mostly well secured. Limits on the maximum loan-to-valuation for mortgage lending and house price appreciation over time mean that existing borrowers generally have a large amount of equity in their homes. In addition, the ability of Australian borrowers to make excess payments on their mortgage, and that this is a tax effective way for owner occupiers to save, means that borrowers tend to accumulate large pre-payments (‘mortgage buffers’). Close to two-thirds of loans have such pre-payments, which collectively amount to two and half years of scheduled mortgage repayments at current interest rates.
As with commercial property, foreign buyers of residential property could amplify cycles or transmit foreign shocks. Non-residents purchasing Australian real estate as an investment may choose between different countries based on expected returns, which can increase the correlation of the Australian market with other countries. Changes in economic and regulatory conditions in foreign buyers’ home countries can also be transmitted to their demand for Australian property. But if purchases of residential property by foreign buyers mainly depend on conditions in their home country, their participation could actually have a moderating impact on the Australian housing cycle.
Having explained why we take a significant interest in the property market from a financial stability perspective, I would now like to provide an update on recent developments in the commercial and residential property markets and the role that international investors, finance and developers have played.
Commercial Property
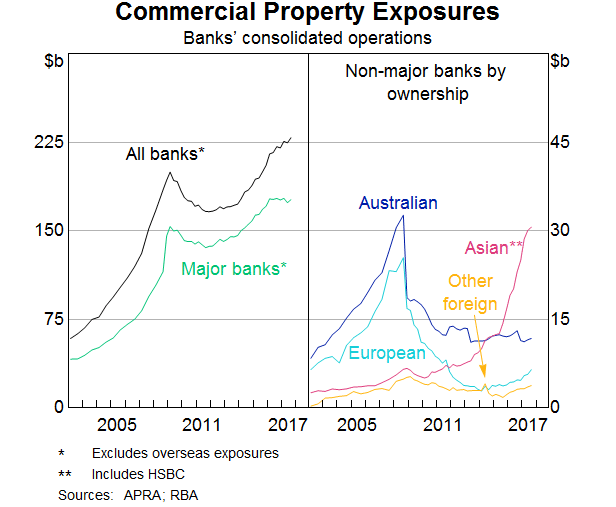
One part of the commercial property sector that the Reserve Bank has been watching closely is loans for the development of residential property. The surge in apartments recently completed and under construction in the major cities raises the risk of price falls. The construction of new apartments has been largest relative to the existing stock in Brisbane and inner-city Melbourne, though it is largest in absolute numbers in Sydney.
Prices for other types of commercial property have risen sharply with a strong increase in demand from international investors seeking the relatively high yields available on Australian commercial property. Exceptionally low long-term interest rates globally have pushed up valuations for property and other assets, all the more so because relatively strong and stable global economic growth in the past few years has reduced investors’ perception of the current risks. While there has not been a surge in construction, the run up in commercial property prices raises the risk of a sharp correction, for example if there is a change in sentiment or a pick-up in long term interest rates.
Graph 2
Commercial office markets have been strongest in Sydney and Melbourne with low vacancy rates and rising prices. In contrast, conditions have been weaker in Perth where vacancy rates increased sharply with the downturn in the state economy from the decline in mining investment.
Conditions in retail property markets have also been relatively subdued across Australia. In part, this reflects strong competition in the retail sector from new entrants and online retailers. However, banks have continued to grow their lending for new retail developments and refurbishments with an increased focus on entertainment, hospitality, services and mixed residential.
Overall, Australian banks have tightened their lending conditions for commercial property in recent years. Restrained lending by Australian banks has provided an opportunity for new entrants into the market. Asian banks have grown their commercial property lending sharply, more than doubling their market share in just two years, although it remains relatively small. This strong growth in commercial property lending by Asian banks is reminiscent of European banks’ growth in the lead up to the financial crisis. However, whereas Australian banks eased their lending standards in that pre-crisis period in order to compete, this time Australian banks do not appear to have eased lending standards.
Graph 3
Residential Property
The Australian residential property market has been strong in the post-financial crisis period as interest rates have been kept low to support economic activity and to boost low inflation. Since 2009, national housing prices have risen by around two thirds and growth of housing credit has outpaced that of incomes. By 2014, concerns grew about the risks from an increase in riskier types of lending, including interest-only loans and investor lending at high loan-to-valuation ratios as well as rising household indebtedness. In response to these concerns, the Australian Securities and Investments Commission (ASIC) increased its scrutiny of lending practices and APRA implemented several macro prudential measures in late 2014 and then again in early 2017, on both occasions after consultation with the Council of Financial Regulators, which the Governor of the Reserve Bank chairs. There are several aspects to these regulatory measures. For each authorised deposit-taking institution (ADI), the growth of investor housing lending has been capped at 10 per cent. Interest-only loans can be no more than 30 per cent of new mortgage lending. In addition, APRA has been monitoring high loan-to-valuation mortgage lending and instructed lenders to pay closer attention to loan serviceability criteria, such as the interest rate buffer applied to the current low mortgage rates and borrowers’ expenses.
These measures have played a role in reducing the build up in risks from household borrowing. Lenders responded to the restrictions by increasing their interest rates for interest-only loans and investor lending. In response, the share of new loans that are interest-only has been falling, and overall investor credit growth has remained below the 10 per cent threshold. Many existing borrowers have also switched their interest-only loans to principal-and-interest loans and there has been a decline in the share of new loans at high loan-to-valuation ratios.
While riskier types of lending have moderated, and investor credit growth has slowed, the pace of overall housing credit growth has been fairly stable this year as borrowing by owner-occupiers has picked up. Conditions in the housing market have eased, particularly in Sydney where prices had experienced strong growth and are particularly high, possibly giving lending restrictions greater impact in Sydney. In Melbourne, conditions remain stronger than in other capital cities. On the other side of the country, and at the other end of the spectrum in terms of housing market conditions, the Perth housing market remains weak. Prices have fallen gradually over the past two to three years, with rents also falling as the rental vacancy rate has increased to its highest level since 1990.
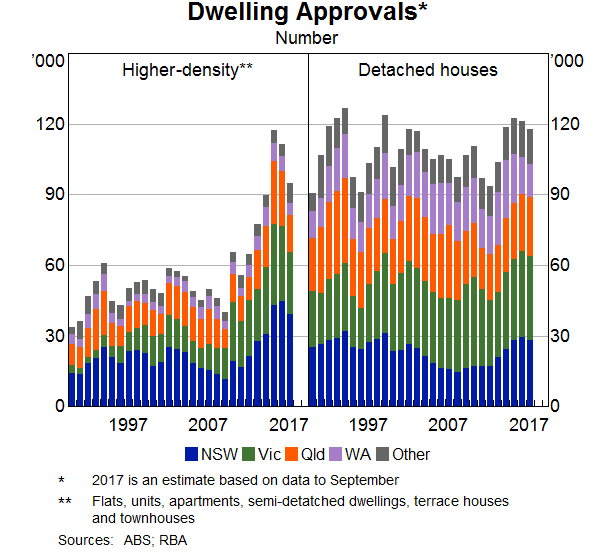
The strong demand driving housing price growth reflected not only low interest rates but also strong population growth. With rising demand and prices, dwelling investment increased strongly. A notable feature of the recent dwelling construction cycle has been the marked increase in the share of higher density construction, a helpful response to the shortage of well-located land in Australia’s large cities. Approvals for new higher density dwellings went from being less than half those of detached dwellings less than a decade ago to being almost on par in recent years. But the longer time to build higher-density dwellings than detached houses increases the risk that a large number of new dwellings could be completed just as the housing market turns down, so amplifying the housing cycle.
Graph 4
This surge in apartment construction has been largest in Sydney, but has also been notable in Melbourne. While the number of apartments being built in Brisbane has been smaller compared to its population, it has been greater relative to the existing stock of apartments. Peak apartment completion in Brisbane is expected to occur this year, capping a three-year period in which the number of apartments has increased by over one-third from the stock in 2015. Perth has also seen strong growth in a relatively small stock of apartments.
This change in the composition of the housing stock is resulting in a rebalancing of relative prices, with prices for detached dwellings growing faster than those for apartments in the major cities over the past five years. In the weaker housing markets of Brisbane and Perth, this has seen apartments experience small price falls in recent years. To date, despite valuations for some apartments at settlement being lower than the purchase price off the plan there have not been widespread reports of higher rates of settlement failure or any notable increase in arrears or losses for banks.
Purchases by foreign buyers have received considerable focus in recent years. Non-residents are able to purchase newly constructed dwellings in Australia, while temporary residents, such as those in Australia for work or study, are able to purchase an existing dwelling for their primary residence. It has been hard to get a firm estimate of how large these purchases are, but drawing on a range of sources, it seems that, nationally, purchases by foreign buyers are equivalent to around 10-15 per cent of new construction, or about 5 per cent of total housing sales. The share of new construction purchases is highest in Melbourne and Sydney. It is also higher for apartments, but it is still only perhaps around one-quarter of newly built apartments. Many foreign buyers come from China, seemingly around three-quarters. Purchases of new properties by foreign buyers have eased over the past year, reportedly because of stricter enforcement of Chinese capital controls and tighter access to finance for foreign buyers.
Purchases by foreign buyers do not, on the whole, reduce the supply of dwellings available to local residents and in fact may actually contribute to expansion of the housing stock. Foreign buyers in Australia for work or study would have been renting if they did not purchase. Other foreign buyers rent the property as an investment and so contribute to the rental stock. Also, there are some new developments that only proceed because they get high pre-sales from foreign buyers.
The strength of the Australian property market, and the participation by foreign buyers, has also enticed some foreign developers to Australia for specific projects, but overall they remain a small part of the market. Foreign banks also have a very small role in residential property lending in Australia.
Given their significance for financial stability, the Reserve Bank carefully monitors property markets. History has taught us that commercial property lending can result in substantial losses for banks. And the large stock of residential property debt means that it too is important for financial stability and household resilience.
The high valuation of commercial property, which is common to many other assets, increases the potential for a sharp correction and so the risks from commercial property lending. The high level of household mortgage borrowing also brings risks, both for lenders and households.
Purchases and financing by foreigner investors and banks have been prominent in the current commercial property cycle. We have seen this before and are well aware of the impact this can have on the cycle. The increased purchases of dwellings by foreign buyers, particularly for investment purposes, are a more recent phenomenon and so their impact on the housing cycle is less clear.
APRA has investigated commercial property lending standards to ensure these are not eroded, while measures by APRA and ASIC aim to reduce the riskiness of new residential lending. And the Reserve Bank, with its mandate for overall financial stability, will continue to closely monitor risks from property markets and lending.
The RBA published the Payments System Board Update: November 2017 Meeting on Friday. Of special note are comments about least-cost routing for transactions using dual-network debit cards, as eftpos routing is on average lower than the Debit MasterCard and Visa Debit systems. They fired a shot across the bow of the industry, saying if the banks won’t implement default lowest-cost routing, the RBA could regulate. The industry will continue to drag its feet.
In fact if you have a card with multiple payment functions (like credit card and eftpos) on a single card, many pay wave terminals will default to the credit card option, unless you insert the card and choose eftpos or your change your defaults. This generates higher merchant fees, and revenues to the card providers and banks. This should also be addressed.
Recent trends in payment card fraud and various industry initiatives aimed at tackling it. Members observed that there had been a significant increase in card-not-present fraud over recent years. Fraud is costly to merchants and other participants in the payments system and can undermine trust in electronic payments. The Board agreed that addressing this rise in fraud should be a priority for the industry. Members welcomed the various initiatives already underway and encouraged industry participants to work together to expedite an effective solution.
The cost of payments to merchants. The Board observed that there was a modest decrease in average merchant service fees in the September quarter, with the new interchange standards having taken effect on 1 July. The Board was briefed on data showing the distribution of payment costs for merchants. These data indicate that payment costs are typically higher for smaller merchants, and confirm that debit cards are generally less costly for merchants than credit cards, with eftpos being a lower-cost system on average than the Debit MasterCard and Visa Debit systems. The Board strongly supported calls from a range of stakeholders for acquirers to provide merchants with least-cost routing functionality for contactless transactions using dual-network debit cards. It requested the Bank staff to continue to engage with the payments industry on this issue, recognising that a prompt industry solution was preferable to regulation.
Recent developments in the ATM industry including the decisions by a number of banks to remove the fees charged to non-customers on ATM transactions. Members noted that ATM coverage is relatively high by international standards, and that the number of ATMs in Australia had reached a record high while the number of transactions at ATMs was declining. In this context, they agreed there may be scope for consolidation or fleet rationalisation that results in a more efficient and sustainable ATM industry while still maintaining broad access to ATMs.
The staff’s assessment of LCH Ltd’s SwapClear Service, a UK-based clearing and settlement facility licensed to operate in Australia. The Bank will provide the assessment report to the Assistant Treasurer and the Australian Securities and Investments Commission, as well as making its findings available to overseas counterparts with a supervisory interest in LCH Ltd, after which the assessment report will be published on the Bank’s website.
The Board also approved a minor technical variation to the interchange standards which will be published next week. Bank staff have consulted informally with acquirers and schemes who have indicated that this change may result in a reduction in compliance costs.
Luci Ellis RBA Assistant Governor (Economic) delivered the Stan Kelly Lecture on “Where is the Growth Going to Come From?“. An excellent question given the fading mining boom, and geared up households!
Over time, some industries grow faster than others. For a while, the mining industry was growing faster than the rest. Other industries take the lead at other times. But it doesn’t really get at the underlying drivers of growth. We need to ask: where will the growth really come from, over the longer term?
In answering this question, it is hard to go past the ‘three Ps’ popularised by our colleagues at Treasury: population, participation and productivity. I’ll go through each in turn.
Population
As the Governor noted in a speech a few years ago, Australia’s population is growing faster than in almost any other OECD economy (Lowe 2014). That has remained true over the past couple of years. The rate of natural increase is higher than many other countries, but most of the difference is the large contribution from immigration.
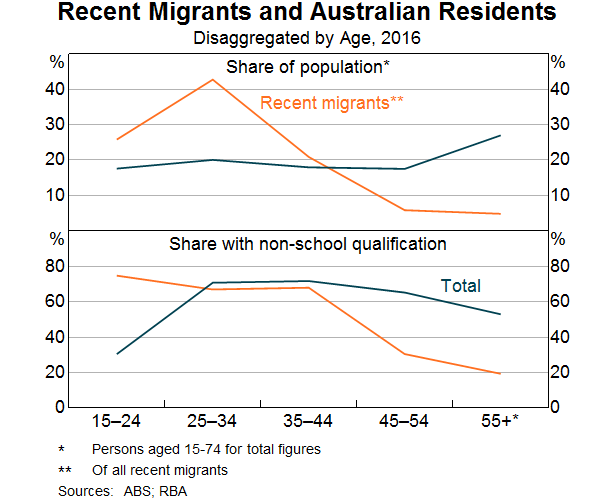
Of course, just adding more people and growing the economy to keep pace wouldn’t boost our living standards.[5] But there are two reasons why we should not assume that this is all that happens. Firstly, recent migrants have a different profile to the incumbent Australian population. They are generally younger, and the youngest age group are significantly more likely to have non-school qualifications (Graph 5). This is possibly because so many recent migrants initially arrive on student visas and then stay. In line with that, service exports in the form of education have grown rapidly over the past few decades.
Older migrants are on average less likely to have such a qualification than existing residents in the same age groups, but they are a small fraction of all migrants. The average education level of newly arrived Australians is actually higher than that of existing residents, precisely because they are younger. So Australia’s migration program is structured in a way that, in principle at least, it can grow the economy while raising average living standards.
Secondly, increasing economic scale is not neutral. There is more to it than just getting bigger. This is the lesson of what is sometimes called New Economic Geography: scale economies arise from product differentiation (Fujita, Krugman and Venables 1999). Bigger, denser cities are more productive. Perhaps more importantly, larger population centres allow more variety in the goods and services produced. Fujita and Thisse (2002) quote Adam Smith making the same point (Smith 1776, p 17).
There are some sorts of industry, even of the lowest kinds, which can be carried on no where but in a great town. A porter, for example, can find employment and subsistence in no other place. A village is by much too narrow a sphere for him; even an ordinary market town is scarce large enough to afford him constant occupation.So it is also with management consultants, medical specialists and a myriad of other occupations that can only be sustained in a large market.
Participation
The second of the three Ps, participation, can and has been increasing average incomes and living standards. It is usually presumed that ageing of the population will reduce participation. In Australia at least, other forces have offset that tendency in recent years.
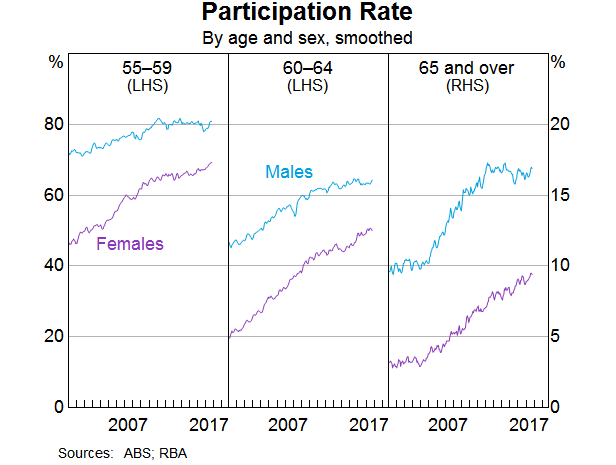
In our Statement on Monetary Policy, released last week, we noted that the participation rate has been rising recently. The increase has been concentrated amongst women and older workers. That is true of the pick-up over recent months. It is also true over a somewhat longer period, as shown in this graph (Graph 6). Older workers have increased their participation in the workforce as the trend to earlier retirement has abated. Mixed in with this is a cohort effect related to the increasing participation of women more generally. Each generation of women participates in the labour force at a greater rate than the previous generation of women did at the same age.
There is a connection here with the increase in health and education employment I mentioned earlier. Better healthcare outcomes means that fewer people retire early because of ill-health, so participation rises. More extensive childcare options make it easier for both parents to be in paid work. Given the usual presumptions in our society about who has primary responsibility for caring for children, this shift affects participation of women more than that of men. So it’s no surprise that the participation rates of women aged 35–44 have also been rising strongly. And more flexible work arrangements tend to encourage participation by both female and older workers.
In the end, though, lifting participation is a once-off adjustment. Once someone enters the workforce, they can’t enter it a second time without leaving first. Greater participation raises the level of living standards but it isn’t an engine of ongoing growth. We must also remember that the objective is not that everyone must be in paid employment. Many people are outside the labour force for good reasons, for example because they are in full-time education, caring for children or other relatives, or doing volunteer work by choice.
Productivity and Innovation
That leaves us with productivity, arguably the most important of three Ps, but unfortunately also the hardest to measure. It is also an area where distributions and firm-specific decisions really matter. Some recent international evidence shows that the firms at the global productivity frontier can be several times more productive than the average firm in their industry (Andrews, Criscuolo and Gal 2015).[6] This research also finds that firms tend to adopt a new technology only after the leading firms in their own country have adopted it. That is, the national productivity frontier first has to catch up to the global frontier, by adapting the new technology to local conditions. So the average productivity of firms in an economy depends on three things.
How quickly the leading firms in that country adopt the technology and match the productivity levels of the globally leading firms in that industry.
How large the leading firms are in the national economy.
How quickly the laggard firms can catch up, once the national leading firms have adopted a particular technology.
The findings of this research suggest that this last factor – the rate of technology adoption – has slowed down since the turn of the century.
The policy implications of these findings are subtle, and depend on whether you want to affect firms near the frontier, or the firms that are lagging far behind. For example, a more flexible labour market might make it easier for the leading firms to grow faster. Average productivity would rise because those leading firms account for a greater share of output. But then you would have an economy dominated by ‘superstar firms’ (Autor et al 2017). The implications of that are not necessarily benign. For a start, inequality could be greater. Median living standards might not rise.
The drivers of innovation, like the drivers of creativity more generally, are hard to pin down. But the literature does provide some pointers to them. First and perhaps most important is simply to grow: growth is more conducive to innovation than recession is. Recessions do not engender ‘creative destruction’; they produce liquidations, which are destructive destruction (Caballero and Hammour 2017). Indeed, when labour is plentiful, there is not much incentive to invest in productivity-boosting technology. And when everyone’s sales are weak, there is not much incentive to invest to try to increase them. There is nothing quite like a tight labour market to make firms think about how to do things more efficiently.
The pressures of strong sales or competition might spur innovation, but many other factors enable it. Infrastructure is a key enabler not only of productivity growth of existing firms, but whole new business opportunities. Often we think of communications infrastructure and the internet in this context. Transport infrastructure is at least as important, I would argue, which makes the current pipeline of public investment even more relevant to future growth outcomes. That’s because online commerce still needs good physical logistics. Unless it’s a purely digital product, something still needs to be delivered. Australia is a highly urbanised country, but it is also a highly suburbanised country. Improving urban transport infrastructure, as well as inter-urban transport infrastructure, could help boost productivity across a range of both traditional and new industries.
Also important is the political and regulatory environment. It would not surprise Stan and Bert Kelly that much of the literature finds that product market regulation and other devices protecting laggard firms tend to retard innovation. More generally, barriers to entry make it harder for new, potentially more innovative firms to break in.
It isn’t all about the start-ups, though. A lot depends on the propensity of existing firms to adopt new technologies and business practices. We think that this is one of the reasons for the slow rate of growth in retail prices in Australia at present. In the face of increased competition, incumbent retailers are having to both compress margins and use technology to become more efficient. Our liaison contacts tell us that they are investing heavily in better inventory management and other cost-saving measures, often by using data analysis more extensively.
Adopting these innovations takes time, because firms have to become familiar with the new technologies and change their business practices to take advantage of them. It wouldn’t be the first time that the computers – or perhaps this time, the machine learning algorithms – were visible everywhere except in the productivity statistics for just this reason.[7]
Adopting new technologies and business models also requires a willingness to change. Just as views to protection can change, so can society’s attitudes to risk, innovation and, thus, entrepreneurship. We saw, after all, that Australia’s economic culture could shift from being inward-looking to outward-looking over the course of a couple of decades.
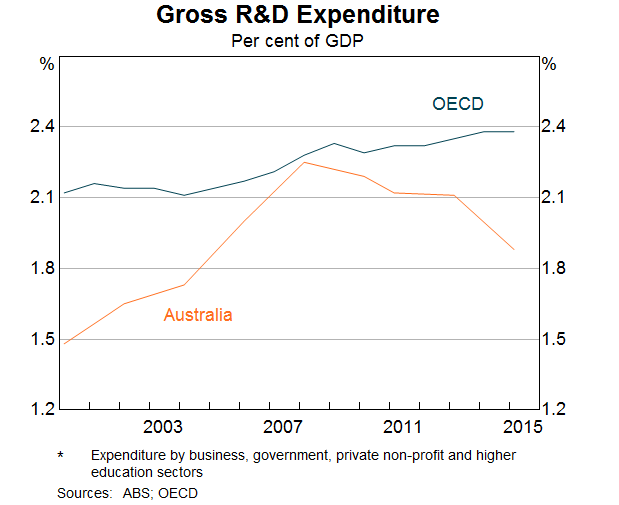
Australia is normally seen as being a relatively fast adopter of technology. But there are some aspects where we seem to lag. One is R&D expenditure (Graph 7). While this isn’t greatly below the average of industrialised countries and many similar countries get by perfectly well doing much less, it has been declining in importance lately. Some other indicators also suggest that Australian firms have in recent years been less likely to adopt innovative technologies than their peers abroad. For example, while small firms are holding their own, large firms in Australia are less likely to use cloud computing services than large firms in many other countries.[8] This wasn’t always the case: a decade and a half ago, Australian firms were towards the front of the curve in adopting the e-commerce technologies that were new at the time (Macfarlane 2000). A lot depends on whether the workforce has the skills to use these new technologies, but at heart, technology adoption is a business decision.
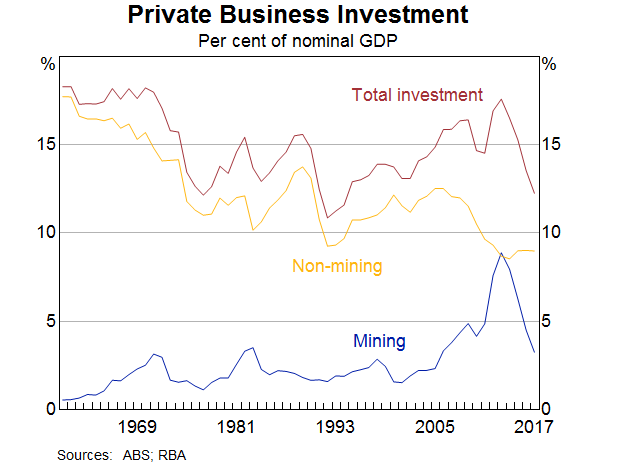
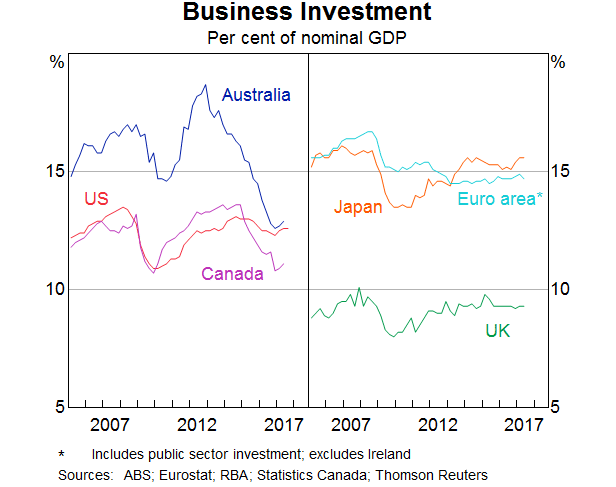
He argues that investment has been strong over the last decade, thanks to the mining sector. This is now easing back, and the question is will the non-mining sector start firing or not? Even if it does, they have huge boots to fill!
Investment spending here has been at a historically high level over much of the past decade. This has been primarily due to the strength of investment in the resources sector, which reached its highest share of activity in more than a century. So, unlike in other countries, there has been a significant addition to the capital stock in Australia over the past decade. We are seeing the fruits of that investment in the strong growth in resource exports.
In Australia, investment spending as a share of the economy rose to a multi-decade high around 2012–13 (Graph 1). This stands in stark contrast to the experience in nearly every other advanced economy as well as most emerging economies, with China being a noteworthy exception (Graph 2).
Much of that outcome was clearly a result of the record level of investment spending in the mining sector. Investment spending in the mining sector rose from around 2 per cent of GDP in the early 2000s, where it had been for much of the previous five decades to peak at around 9 per cent of GDP in 2012/13. Or, to put that in dollar terms, investment spending in the mining sector in 2006/07 totalled $41 billion and rose to a peak of $136 billion in 2012/13.
He concludes:
First, there has not been a lack of investment in Australia over the past decade. Indeed, it has been close to the opposite, with investment reaching a multi-decade peak.
Second, the strength of investment spending in Australia has been clearly associated with the mining industry and the spillovers (both positive and negative) of that to investment in other parts of the economy have been greater than we thought ex ante.
Third, in reviewing possible explanations for why investment in the non-mining sector in Australia has been weak, the most powerful reason boils down to firms’ expectations of future demand, otherwise known as animal spirits. Mining investment was strong because expectations for future demand were high and there wasn’t that much uncertainty around that expectation. Expectations of demand elsewhere have not been strong.
We are now seeing signs of that dynamic changing around the world and in Australia. With any luck, it will be sustained. This will be timely for the Australian economy as the mining investment story draws to its close.
In our latest weekly update, we explore how that RBA is caught between stronger global economic indicators, and weaker local conditions, and what this means for local households, the property market and banks.
Welcome to the Property Imperative weekly to 11th November 2017. Read the transcript or watch the video.
We start this weeks’ digest with the latest results from the banking sector.
CBA’s 1Q18 Trading Update reported a rise in profit, and volumes, as well as a lift in capital. Expenses were higher, reflecting some provisions relating to AUSTRAC, but loan impairments were lower. WA appears to be the most problematic state. Their unaudited statutory net profit was around $2.80bn in the quarter and their cash earnings was $2.65bn in the quarter, up 6%. Both operating income and expense was up 4%.
Westpac’s FY17 results were a bit lower than expected, impacted by lower fees and commissions, pressure on margins, the bank levy and a one-off drop to compensate certain customers. Despite a strong migration to digital, driving 59 fewer branches and a net reduction of ~500 staff, expenses were higher than expected. There has been a 23% reduction in branch transactions over the past two years in the consumer bank, once again highlighting the “Quiet Revolution” underway and the resulting problem of stranded costs. Treasury had a weak second half. But the key point, to me, is that around 70% of the bank’s loan book was in one way or another linked to the property sector, so future performance will be determined by how the property market performs. Provisions were lower this cycle, and at lower levels than recent ANZ and NAB results. WA mortgage loans have the highest mortgage arrears but were down a bit.
Looking at mortgage defaults across the reporting season, there were some significant differences. Some, like Westpac, indicated that WA defaults in particular are easing off now, while others, like ANZ and Genworth, are still showing ongoing rises. This may reflect different reporting periods, or it may highlight differences in underwriting standards. Our modelling suggests that the rate of growth in stress in WA is indeed slowing, but it is rising in NSW (see the Nine TV News Segment on this which featured our research) and VIC; and there is an 18 to 24-month lag between mortgage stress and mortgage default. So, in the light of expected flat income growth, continued growth in mortgage lending currently at 3x income, rising costs of living and the risk of international funding rates rising too, we think it is too soon to declare defaults have peaked. One final point, many households have sufficient capital buffers to repay the bank, thanks to ongoing home price rises. Should prices start to fall, this would change the picture significantly.
Banks have enjoyed strong balance sheet growth in recent years as they lend ever more for mortgages, at the expense of productive business lending. A number of factors have driven the housing boom including population and income growth for the past 25 years, a huge fall in interest rates and increases in the tax advantages to property investment through negative gearing and the halving of the capital gains tax level.
Fitch Ratings says the banks’ had solid results for the 2017 financial year, supported by robust net interest margins and strong asset quality. However, Australia’s four major banks will face earnings pressure from higher impairment charges and lower revenue growth in their 2018 financial year, and cost control to remain an important focus. They benefitted from the APRA inspired repricing of mortgages, and from lower impairment charges. Fitch said that mortgage arrears have increased modestly from low bases in most markets – Western Australia has had more noticeable deterioration – and they expect this trend to continue in FY18 due in part to continued low wage growth and an increase in interest rates for some types of mortgages.
The latest household finance data from the ABS confirms what we already knew, lending momentum is on the slide, and first time buyers, after last month’s peak appear to have cooled. With investors already twitchy, and foreign investors on the slide, the level of buyer support looks anaemic. Expect lots of “special” refinance rates from lenders as they attempt to sustain the last gasp of life in the market.
The number of new loans to first time buyers was down 6.3%, or 630 on last month. We also see a fall in fixed loans, down 14%. The DFA sourced investor first time buyers also fell again, down 4%. More broadly, the flow of new loans was down $19 million or 0.06% to $33.1 billion. Within that, investment lending flows, in trend terms, fell 0.52% or $62.8 million to $12.1 billion, while owner occupied loans rose 0.32% or $47.7 million to $15.0 billion. So investment flows were still at 44.6% of all flows, excluding refinances. Refinances comprise 17.9% of all flows, down 0.07% or $3.9 million, to $5.9 billion.
Auction volumes were also lower this past week, partly because of the Melbourne Cup festivities, and CoreLogic’s latest data suggests a slowing trend, more homes listed, and further home price falls in Greater Sydney. As a result, we expect home lending to trend lower ahead.
The MFAA says there has been a boom in mortgage brokers, but this may be unsustainable, given lower mortgage growth. The snapshot, up to March 2017, shows that the number of brokers was estimated to be 16,009, representing 1 broker for every 1,500 in the population and they originated around 53% of new loans. Overall the number of brokers rose 3.3% but net lending grew only 0.1%. As a result, the average broker saw a fall in their gross annual income. Also, on these numbers, brokers cost the industry more than $2 billion each year!
We published data on the dynamic loan-to-income data (LTI) from our household surveys. Currently we estimate that more than 20% of owner occupied mortgage loans on book have a dynamic LTI of more than 4 times income. Some LTI’s are above 10 times income, and though it’s a relatively small number, they are at significantly higher risk. Looking at the data by state, we see that by far the highest count of high LTI loans resides in NSW (mainly in Greater Sydney), then VIC and WA. Younger households have a relatively larger distribution of higher LTI loans. Reading across our core segmentation, we see that Young Affluent, Exclusive Professional and Multi-Cultural Establishment are the three groups more likely to have a high dynamic LTI. We also see a number of Young Growing Families in the upper bands too. As many lenders also hold the transaction account for their mortgage borrowers, it is perfectly feasible to build an algorithm which calculates estimated income dynamically from their transaction history, and use this to estimate a dynamic LTI. This would give greater insight into the real portfolio risks, compared with the blunt instrument of LVR. It is less misleading that LTI or LVR at origination.
The latest edition of our Household Financial Security Confidence Index to end October shows households are feeling less secure about their finances than in September. The overall index fell from 97.5 to 96.9, and remains below the 100 neutral setting. We use data from our household surveys to calculate the index. While households holding property for owner occupation remain, on average, above the neutral setting, property investors continue to slip further into negative territory, as higher mortgage rates bite, rental returns slide and capital growth in some of the major markets stalls. Property inactive households remain the most insecure however, so owning property in still a net positive in terms of financial security. There are significant variations across the states. VIC households continue to lead the way in terms of financial confidence, and WA households are moving up from a low base score. However, households in NSW see their confidence eroded as prices slide in some post codes (the average small fall as reported does not represent the true variation on the ground – some western Sydney suburbs have fallen 5-10% in the past few months). Households in QLD and SA on average have held their position this month. Confidence continues to vary by age bands, although the average scores have drifted lower again. Younger households are consistently less confident, compared with older households, who tend to have smaller mortgages relative to income, and more equity in property and greater access to savings.
As expected the RBA held the cash rate again this week, for the 15th month in a row. The RBA’s statement on Monetary Policy highlighted the tension between stronger global growth, reflected in expected rising interest rate benchmarks in several countries, including the USA; and weaker inflation and growth in Australia. As a result, pressure to lift the cash rate here appears lower than before. Underlying inflation is expected to remain steady at around 1¾ per cent until early 2019, before increasing to 2 per cent. The revised CPI weightings now announced by the ABS, will tend to reduce the inflation numbers in the next release. The RBA suggests growth will be lower for longer though is still holding to a 3% growth rate over their forecast period, They also highlighted the impact of stagnant wage growth and high household debt once again.
If rates do stay lower for longer here, it may benefit households already suffering under mountains of mainly housing related debt, but put pressure on the dollar and terms of trade, as rates overseas climb, sucking investment dollars away from Australia and lifting funding costs. Some are suggesting that the gap between income and credit growth, 2% compared with 6% over the past year, will require the RBA to lift the cash rate sooner, and ANZ for example is still forecasting rate hikes in 2018.
International conditions are on the improve, and many assume the rises in benchmark cash rates will be slow and steady. However, A GUEST post on the unofficial Bank of England’s “Bank Underground” blog makes the point, by looking at data over the past 700 years, that most reversals after periods of interest rate declines are rapid. When rate cycles turn, real rates can relatively swiftly accelerate. The current cycle of rate decline is one of the longest in history, but if the analysis is right, the rate of correction to more normal levels may be quicker than people are expecting – and a slow rate of increases designed to allow the economy to acclimatize may not be possible. Not pretty if you are a sovereign or household sitting on a pile of currently cheap debt!
So, we see on one side global conditions improving, with interest rates set to rise, while locally economic indicators are weakening suggesting the RBA may hold the cash rate lower for longer. This is creating significant tension, and highlights the dilemma the regulators face. But as we said before, this is a problem of their own making, as they dropped rates too far, and did not recognise the growing risks in the housing sector soon enough. So, already on the back foot, we expect to see some further targeted regulatory intervention, and we expect the cash rate to stay lower for longer, until the international upward pressure swamps the local situation. We think this may be much sooner than many, who are now talking of no rate change for a couple of years. Meantime households with large loans, little income growth and facing rising costs will continue to spend less, tap into savings, and muddle though. Not a good recipe for future growth, and economic success. As Laurel and Hardy used to say ” Well, here’s another nice mess you’ve gotten me into!”
And that’s the Property Imperative Weekly to 11th November 2017. If you found that useful, do leave a comment, subscribe to receive future updates, and check back next week.

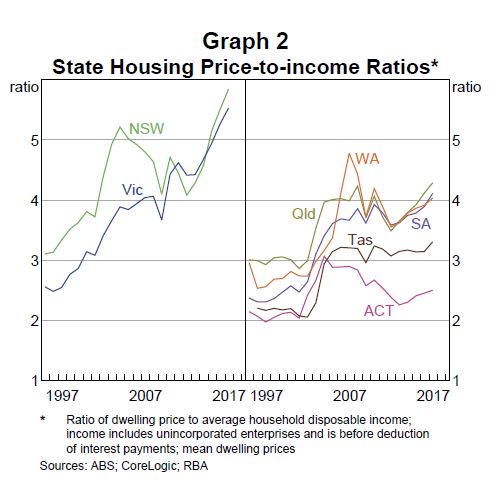
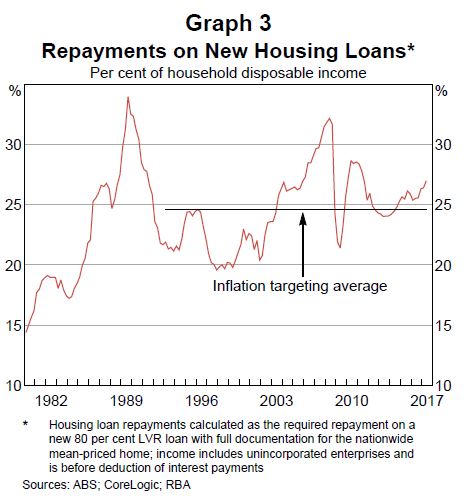 There are significant state variations.