RBA Holds Cash Rate (Again)

At its meeting today, the Board decided to leave the cash rate unchanged at 1.50 per cent.

Conditions in the global economy are continuing to improve. Labour markets have tightened further and above-trend growth is expected in a number of advanced economies, although uncertainties remain. Growth in the Chinese economy is being supported by increased spending on infrastructure and property construction, with the high level of debt continuing to present a medium-term risk. Commodity prices have risen recently, although Australia’s terms of trade are still expected to decline over coming years.

Wage growth remains low in most countries, as does core inflation. Headline inflation rates have declined recently, largely reflecting the earlier decline in oil prices. In the United States, the Federal Reserve expects to increase interest rates further and there is no longer an expectation of additional monetary easing in other major economies. Financial markets have been functioning effectively and volatility remains low.

The recent data have been consistent with the Bank’s expectation that growth in the Australian economy will gradually pick up over the coming year. The decline in mining investment will soon run its course. The outlook for non-mining investment has improved recently and reported business conditions are at a high level. Residential construction activity remains at a high level, but little further growth is expected. Retail sales have picked up recently, although slow growth in real wages and high levels of household debt are likely to constrain future growth in spending.

Employment growth has been stronger over recent months and has increased in all states. The various forward-looking indicators point to solid growth in employment over the period ahead. The unemployment rate is expected to decline a little over the next couple of years.

Wage growth remains low. This is likely to continue for a while yet, although stronger conditions in the labour market should see some lift in wages growth over time. Inflation also remains low and is expected to pick up gradually as the economy strengthens.

The Australian dollar has appreciated over recent months, partly reflecting a lower US dollar. The higher exchange rate is expected to contribute to the subdued price pressures in the economy. It is also weighing on the outlook for output and employment. An appreciating exchange rate would be expected to result in a slower pick-up in economic activity and inflation than currently forecast.

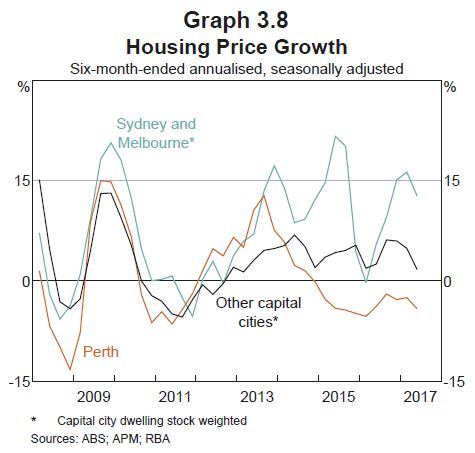
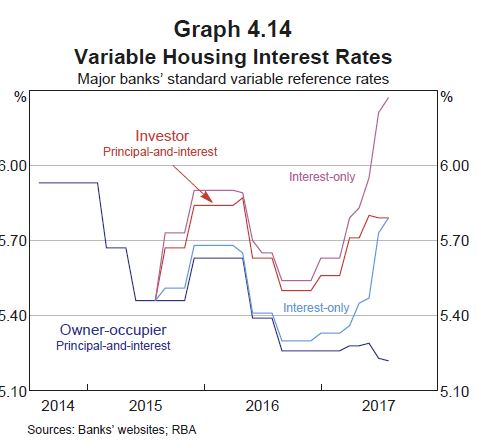
Conditions in the housing market continue to vary considerably around the country. Housing prices have been rising briskly in some markets, although there are signs that conditions are easing, especially in Sydney. In some other markets, prices are declining. In the eastern capital cities, a considerable additional supply of apartments is scheduled to come on stream over the next couple of years. Rent increases remain low in most cities. Investors in residential property are facing higher interest rates. There has also been some tightening of credit conditions following supervisory measures to address the risks associated with high and rising levels of household indebtedness. Growth in housing debt has been outpacing the slow growth in household incomes.

The low level of interest rates is continuing to support the Australian economy. Taking account of the available information, the Board judged that holding the stance of monetary policy unchanged at this meeting would be consistent with sustainable growth in the economy and achieving the inflation target over time.

Home Lending Reaches Another Record

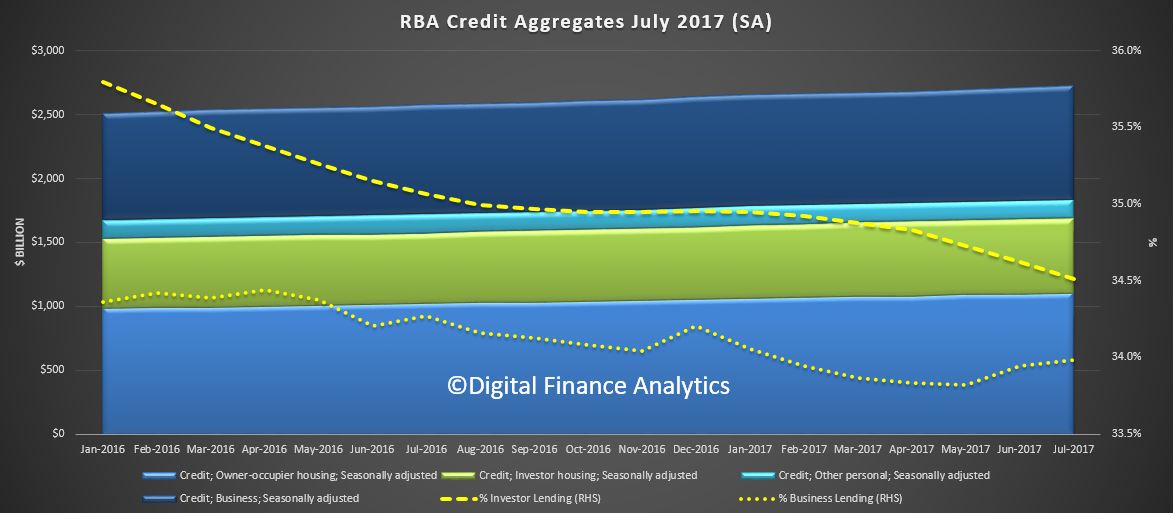
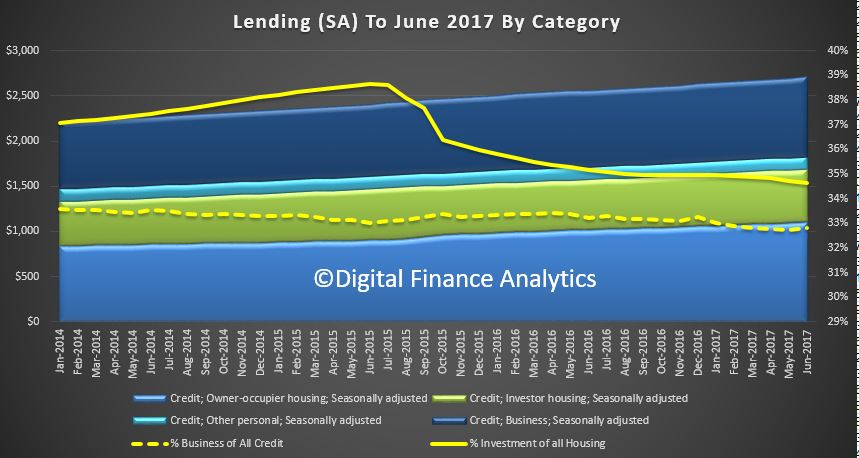
The RBA Credit Aggregates for July 2017 have been released. Overall credit rose by 0.5% in the month, or 5.3% annualised. Within that housing lending grew at 0.5% (annualised 6.6% – well above inflation), other Personal credit fell again, down 0.1% (annualised -1.4%) and business credit rose 0.5% (annualised 4.2%).

Home lending reached a new high at $1.689 trillion. Within that owner occupied lending rose $7 billion to $1.10 trillion (up 0.48%) and investor lending rose just $0.09 billion or 0.15% to $583 billion.  Investor mortgages, as a proportion of all mortgages fell slightly.

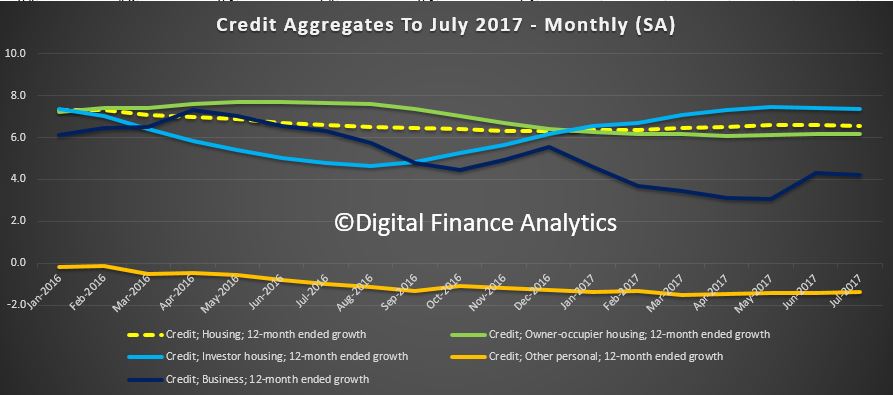
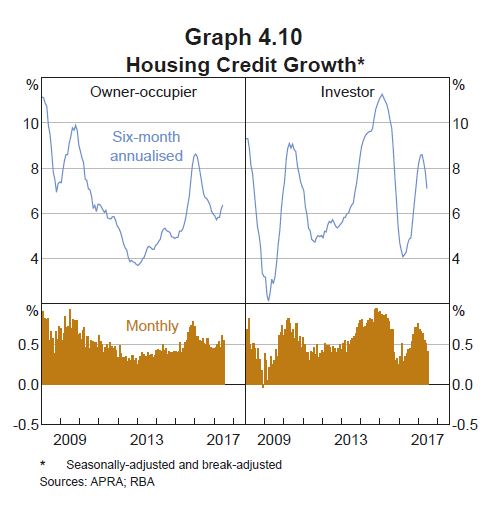
The adjusted movement data shows that investor housing is still at around 7%, higher than owner occupied loans and still way too high. Personal credit continues to languish, while business lending remains at around 4%. All growth rates for the financial aggregates are seasonally adjusted, and adjusted for the effects of breaks in the series

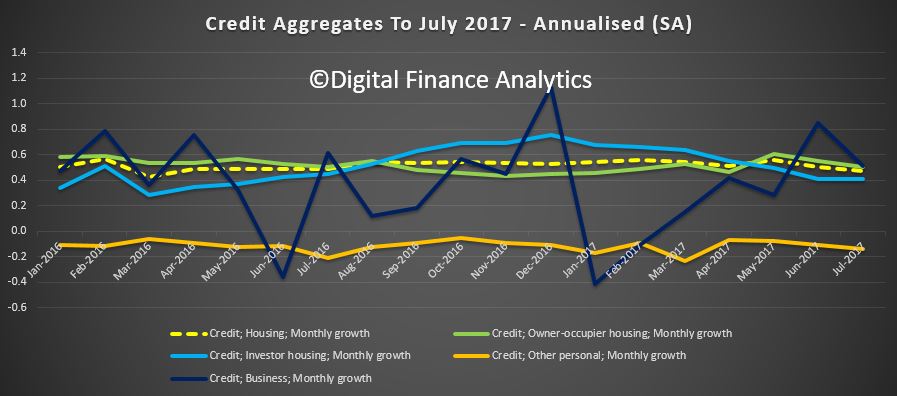
The more volatile monthly data shows a slight easing in housing credit growth this month, and a fall this month in business lending.

The RBA notes that:

Following the introduction of an interest rate differential between housing loans to investors and owner-occupiers in mid-2015, a number of borrowers have changed the purpose of their existing loan; the net value of switching of loan purpose from investor to owner-occupier is estimated to have been $56 billion over the period of July 2015 to July 2017, of which $1.4 billion occurred in July 2017. These changes are reflected in the level of owner-occupier and investor credit outstanding. However, growth rates for these series have been adjusted to remove the effect of loan purpose changes.

So more adjustments, either from mis-classification, or borrowers proactively switching from investment loans to get better rates.  This rate of switching has not slowed down, so it looks like a continuing process rather than a clerical error.

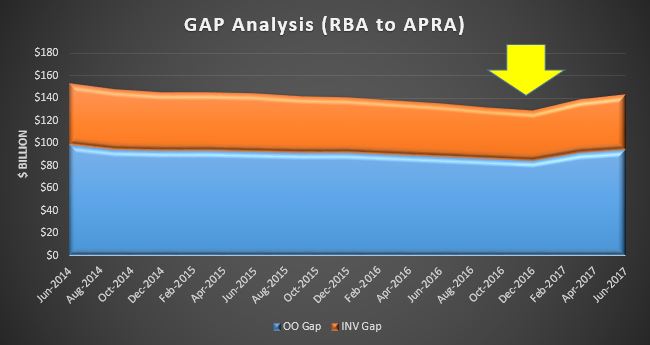
We suspect non-banks are picking up some of the investor lending slack as ADI’s conform to the regulators guidance. A quick calculation, comparing RBA and APRA data provides some validation:


RBA Minutes For August Says Little (In Many Words)

The latest RBA minutes really does not add much to our understanding, other than the bank continues to watch developments in the property market, they are holding to their forecasts on growth, and the signals across the economy are mixed.

Perhaps they were muted because of the reaction to the 2% rate lift to neutral last month, which was hurriedly walked back subsequently!

Domestic Economic Conditions

Members commenced their discussion of the domestic economy by noting that the June quarter inflation data had been in line with the Bank’s expectations and provided further confirmation that inflation had increased since 2016. Underlying inflation was ½ per cent in the June quarter and headline inflation was only slightly lower. Both Consumer Price Index (CPI) inflation and measures of underlying inflation were running at a little under 2 per cent in year-ended terms.

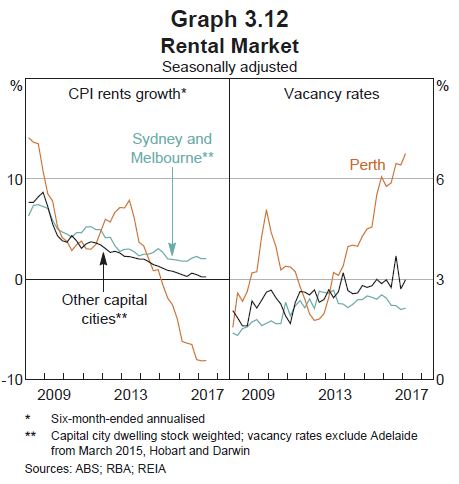
Non-tradables inflation had reached its highest year-ended rate in two years in the June quarter, boosted by rises in tobacco excise and utilities prices. Market services inflation had increased since 2016, but remained low; around half of total costs in the market services sector are labour costs, and these had been subdued over recent years. Inflation in the costs of constructing a new dwelling had also increased over the prior year in all capital cities other than Perth and Adelaide. In contrast, rents had been increasing at a below-average pace in Sydney and Melbourne, had been falling in Perth and had been broadly stable in most other capital cities.

The prices of tradable consumer durable items had declined over the year, partly reflecting the appreciation of the exchange rate and heightened competition from foreign retailers. Inflation in food prices (excluding fruit and vegetables) had been running at low rates for several years. Supply disruptions from Cyclone Debbie had had relatively little net effect on fruit and vegetables prices in the June quarter. Fuel prices had fallen in the quarter, but had contributed 0.2 percentage points to headline inflation over the year.

Members noted that the Australian Bureau of Statistics intends to update the weights in the CPI in the December quarter 2017 CPI release, to reflect changes in consumers’ spending behaviour over recent years. This was expected to lead to lower reported CPI inflation because the weights of items whose prices had fallen were likely to be higher, whereas the weights of items whose prices had risen were likely to be lower.

In their discussion of the outlook for the domestic economy, members noted that the Bank’s forecasts for output growth and inflation were largely unchanged from three months earlier. They noted that the forecasts were conditioned on the assumption of no change in the Australian dollar exchange rate during the forecast period, which extends to the end of 2019, and that this assumption was one source of uncertainty.

The available data on activity suggested that GDP growth had increased in the June quarter, following weaker-than-expected growth in the March quarter. Output growth was expected to reach around 3 per cent in year-ended terms during 2018 and 2019, which was a little higher than estimates of potential growth. The recent data had indicated that consumption growth had increased in the June quarter. The value of retail sales had risen strongly in April and May, and the increases had been broadly based both nationally and across spending categories. Beyond the June quarter, rising employment and stronger household income growth were expected to support consumption growth, which was forecast to be a little above its average of recent years.

Dwelling investment was expected to recover from the weakness in the March quarter, which was partly the result of wet weather in New South Wales, and remain at a high level over the following year or so, sustained by the large pipeline of residential building work already approved or under way. The number of new residential building approvals had stepped down since 2016 and members noted that, if approvals remained at current levels, construction activity could also begin to decline.

The established housing markets in Sydney and Melbourne had remained the strongest in the country, although conditions had eased since late 2016. Housing prices in Perth had declined a little further, while apartment price growth in Brisbane had been weak.

Turning to the business sector, members noted that activity in the mining sector was expected to be supported in the June quarter by stronger resource export volumes. Coking coal exports had returned to pre-cyclone levels in May, and liquefied natural gas exports had continued to increase. The decline in mining investment was expected to run its course in the following year or so and thereafter no longer be a drag on growth. Resource exports were expected to make a significant contribution to GDP growth over the forecast period.

Investment by non-mining businesses was expected to pick up later in the forecast period in response to stronger growth in demand. Businesses had continued to report above-average business conditions and members noted that many of the conditions that might typically be associated with stronger growth in investment were in place. Some indicators of non-mining investment, including recent strength in sales of commercial motor vehicles and the higher investment intentions recorded in the NAB survey, had been more positive in the period leading up to the meeting. The increase in the level of non-residential building approvals had also signalled a more positive outlook for private non-residential construction, although the pipeline of work to be done was at low levels. The pipeline of public infrastructure activity had increased over the previous few years, to be at its highest share of GDP since the mid 1980s. The expected increase in expenditure on public infrastructure had been reported as flowing into the order books of firms in the private sector.

Members observed that recent data had suggested further improvement in the labour market. Employment had increased in every state since the start of 2017, including solid growth in the mining-exposed states. This provided further evidence that the drag on economic activity from earlier declines in the terms of trade and falling mining investment were running their course. Over this period, around 165,000 full-time jobs had been created, labour force participation had risen and average hours worked had increased.

The unemployment rate had been little changed in June at 5.6 per cent and underemployment had edged lower over prior months. Indicators of labour demand had pointed to further employment growth and little change in the unemployment rate over coming quarters. By the end of the forecast period, the unemployment rate was expected to be just below 5½ per cent, slightly lower than forecast in May but still implying a degree of spare capacity in the labour market. Members observed that the recent improvement in labour market conditions and the increase in award wages should help support household incomes and thus spending. Some upside risk to spending could be envisaged if employment were to be higher than forecast. On the other hand, expectations of ongoing low wage growth could weigh on consumption growth. Spending could also be constrained by elevated levels of household debt, especially if housing market conditions were to weaken.

More broadly, members noted there was some uncertainty about the effect any decline in spare capacity in the labour market would have on wage and price inflation. Information from liaison indicated that some employers were finding it harder to attract workers with particular skills. If this were to broaden, wage growth could increase more quickly than forecast, which would see inflationary pressures also emerge more quickly. However, wage and price inflation had not increased by as much as expected in other economies around the world that are already close to full employment, which raised the possibility that low inflation in Australia might also persist longer than forecast.

Turning to the inflation forecast, members noted that underlying inflation was expected to be close to 2 per cent in the second half of 2017 and to edge higher over the subsequent two years. Most of the difference between headline and underlying inflation over the forecast period could be accounted for by further increases in tobacco excise and utilities prices. Retail electricity prices were expected to increase sharply in the September quarter, following the increases in retail prices in New South Wales, Queensland and Western Australia on 1 July, and the March quarter 2018, when similar increases were expected in Victoria. Members acknowledged that the second-round effects of higher utilities prices on retail prices through business costs were uncertain, partly because it was unclear when utilities contracts for businesses would be subject to renewal. Members also observed that energy is a relatively low share of costs for most businesses, although it is higher for some businesses that compete in international markets.

The inflation forecast partly reflected an expectation of a modest increase in wage growth as labour market conditions tightened further and the drag on activity and incomes from falls in mining investment and the terms of trade diminished. Working in the opposite direction were the effects of additional competition in the retail industry, the dampening effect of expanding housing supply on growth in rents, and the recent exchange rate appreciation. Headline inflation had been revised a little higher in the updated forecasts, mostly reflecting the prospect of faster growth in utilities prices, and was expected to be between 2 and 3 per cent over much of the forecast period.

International Economic Conditions

Members commenced their discussion of the global economy by noting that economic conditions had strengthened over the prior year and the improvement had broadened beyond international trade. In particular, growth in business investment had picked up in several advanced and emerging economies, including the United States, Canada, Japan and a number of economies in east Asia. Consumption growth had been resilient. Recent GDP data had generally confirmed earlier expectations and, accordingly, the forecast for global growth had been little changed since that published in the May Statement on Monetary Policy. A gradual increase in global inflationary pressures over the subsequent couple of years had seemed likely, as spare capacity in many advanced economies was expected to be absorbed, resulting in higher wage growth. However, as members noted, even though labour market conditions had already tightened in some advanced economies, wage growth and core inflation had remained subdued.

Growth in GDP in China had been a little stronger than expected in the June quarter, supported by accommodative financial conditions and expansionary fiscal policy. The strengthening in conditions in the industrial sector over recent months had been broadly based; construction activity had been resilient, although housing market policies introduced in some cities over the preceding year had been effective in lowering overall housing price inflation. Demand for both consumer goods and Chinese exports had picked up. The strength in manufacturing and construction activity had contributed to higher demand for steel. As a result, imports of iron ore, including from Australia, had trended higher and prices for iron ore and coking coal had increased since the previous meeting. The outlook for Australia’s thermal coal exports had not benefited to the same extent, partly because there had been an increase in domestic Chinese production. The forecast for Australia’s terms of trade had been revised up a little since May, but still implied a decline from their recent peak.

Growth in China was expected to ease in 2018 and 2019 because of structural factors such as a declining working-age population, as well as policies to address financial risks. Members noted that the outlook for the Chinese economy remained a significant source of uncertainty. In particular, it was unclear how the authorities would negotiate the difficult trade-off between growth and the build-up of leverage in the Chinese economy. To address risks in the shadow banking sector, the authorities had recently sought to improve coordination among financial regulators and had announced tighter regulatory measures. Members noted that such measures could be difficult to calibrate and that, as a result, financial conditions might tighten by more than expected.

GDP growth in the rest of east Asia looked to have been around estimates of potential in the first half of 2017, supported by accommodative policies as well as the increase in global trade growth. Members noted that many economies in this region were deeply integrated into global supply chains, particularly for semiconductors and other electronics. There had also been signs of a recovery in retail sales and a sharp increase in consumer confidence in South Korea, the largest economy in the region.

In the three largest advanced economies, investment growth had picked up and employment growth had supported growth in household incomes and consumption. GDP growth had picked up in the June quarter in the United States and had been above potential rates for some time in the euro area and Japan, which had experienced sizeable increases in exports as global economic conditions had improved. GDP growth in all three major advanced economies was expected to remain above estimates of potential growth over the forecast period. Unemployment rates had declined to low levels in all three economies and in the United States and Japan were below levels associated with full employment.

Financial Markets

Members noted that over recent months most attention in international financial markets had been on changes in expectations regarding monetary policy. In a number of advanced economies, monetary policy was expected to be somewhat less accommodative than previously anticipated.

At its June meeting, the US Federal Open Market Committee (FOMC) increased its policy rate and outlined plans for a gradual and predictable reduction in the size of the Federal Reserve’s balance sheet. More recently, the FOMC had indicated that the balance sheet reduction would be likely to begin relatively soon. Financial market participants continued to expect further increases in the US federal funds rate to occur more slowly than implied by the median projections of FOMC participants. At its July meeting, the European Central Bank had emphasised that monetary policy needed to remain very accommodative, but had also indicated that it will consider whether to reduce the pace of asset purchases at one of its forthcoming meetings. In July, the Bank of Canada raised its policy rate for the first time in seven years and financial market participants expected further increases. Central banks in several other advanced economies had also adjusted their communication over recent months so as to remove earlier biases towards easier monetary policy.

Long-term government bond yields had responded to the changes in expectations for the stance of monetary policy, with yields in most major financial markets, as well as in Australia, having risen from their levels in early June. Members noted, however, that yields remained at low levels. In Japan, yields on 10-year government bonds had remained around zero during 2017, consistent with the Bank of Japan’s policy of yield curve control.

Members observed that financial market conditions remained very favourable. Corporate financing conditions had continued to improve, with the increase in equity prices and decline in corporate bond spreads having continued over 2017 in the United States and the euro area.

In China, financial market conditions also remained accommodative, but had tightened since the end of 2016 as the authorities had instituted a range of measures to reduce leverage in financial markets. Bond yields had increased markedly since late 2016, despite a slight retracement in recent months, and corporate bond issuance had slowed following strong growth over the preceding several years. Members observed that credit availability to households and businesses had been relatively unaffected by the regulatory measures. The renminbi exchange rate had appreciated against the US dollar since the beginning of 2017, but had depreciated in trade-weighted terms. The Chinese authorities had increased their scrutiny of capital flows, resulting in a decline in net capital outflows, and the value of the People’s Bank of China’s foreign currency reserves had stabilised.

Members noted that there had been a broadly based depreciation of the US dollar over 2017, including against the Australian dollar. The appreciation of the Australian dollar over the previous two months had resulted in it returning to 2015 levels in US dollar terms and to the levels of late 2014 on a trade-weighted basis.

In Australia, housing credit growth had been steady over the first half of 2017, as a decline in growth in housing credit extended to investors had been offset by a slight increase in growth in housing credit to owner-occupiers. Members discussed the relative increases in housing lending rates to investors compared with owner-occupiers and for interest-only loans compared with principal-and-interest loans. Overall, the average actual interest rate paid on all outstanding housing loans was estimated to have increased slightly since late 2016. Housing loan approvals to investors had declined in recent months, which pointed to some easing in growth in housing credit to investors. The share of interest-only housing loans in total loan approvals appeared to have declined noticeably in the June quarter in response to recent measures introduced by the Australian Prudential Regulation Authority (APRA) to improve lending standards. Moreover, there was evidence of some switching of existing interest-only loans to principal-and-interest loans.

Australian share prices had been broadly steady in recent months. Over July, bank share prices had retraced some of their earlier decline, in line with a rise in bank share prices globally and following APRA’s announcement of additional capital requirements for the banking sector, which were only slightly higher than banks’ current actual capital ratios. The major banks had been issuing increasingly longer-dated bonds, including two large US-denominated 30-year bond issues in July. Members noted that longer-dated bonds are favoured under the Net Stable Funding Ratio requirement, which will come into effect in 2018. Members also noted that Australian issuance of residential mortgage-backed securities had continued at the relatively strong pace seen since late 2016.

Financial market pricing had continued to suggest that the cash rate was expected to remain unchanged over the remainder of 2017, with some expectation of an increase in the cash rate by mid 2018.

Considerations for Monetary Policy

In considering the stance of monetary policy, members noted that the improvement in global economic conditions had continued, particularly in China and the euro area. Demand growth from the Chinese industrial sector had been stronger than expected and had contributed to higher commodity prices. Labour markets had continued to tighten in a number of economies, but inflation had generally remained subdued. There had been a broadly based depreciation of the US dollar. Consistent with that, a number of currencies were close to their highs of the previous few years against the US dollar, including the euro and the Canadian dollar. The Australian dollar also had risen to levels last seen in 2015.

Domestically, the outlook was little changed. The forecast was for GDP growth to increase to around 3 per cent during the forecast period, supported by the low level of interest rates. Business conditions had improved further and faster growth in non-mining business investment was expected. Inflation was still expected to increase gradually as the economy strengthened. However, a further appreciation of the exchange rate would be expected to result in a slower pick-up in inflation and economic activity than currently forecast.

Employment growth had been stronger over recent months, so the forecasts for the labour market were starting from a stronger position. Forward-looking indicators suggested that the degree of spare capacity in the labour market would continue to decline gradually. Wage growth had remained low but was still expected to increase a little as conditions in the labour market improved. Members observed that recent strong employment growth would be likely to contribute to an increase in household disposable income, and therefore consumption growth, over the forecast period. However, ongoing low wage growth and the high level of debt on household balance sheets raised the possibility that consumption growth could be lower than forecast.

Members regarded conditions in the housing market and household balance sheets as continuing to warrant careful monitoring. Conditions in the housing market varied considerably around the country. While there were signs that conditions in the Sydney and Melbourne markets had eased somewhat, housing price growth in these two cities had remained relatively strong. In some other housing markets, prices had been declining. Borrowers investing in residential property had been facing higher interest rates and growth in credit to investors had eased, but overall housing credit growth had continued to outpace the relatively slow growth in household incomes.

Taking account of the available information and the need to balance the risks associated with high household debt in a low-inflation environment, the Board judged that holding the stance of monetary policy unchanged would be consistent with sustainable growth in the economy and achieving the inflation target over time.

The Decision

The Board decided to leave the cash rate unchanged at 1.5 per cent.

Some Innovative Mortgage Data

RBA Assistant Governor (Financial Markets) Christopher Kent discussed data from their securitised mortgage data pool. Currently, the dataset covers about 280 ‘pools’ of securitised assets and has information on 1.6 million individual mortgages with a total value of around $400 billion. Currently, this accounts for about one-quarter of the total value of home loans outstanding in Australia.

It is worth noting that securitised loans may not accurately represent the entire market, as loan pools are selected carefully when they are rolled into a securitised structure – “the choice of assets in the collateral pool may be influenced by the way that credit ratings agencies assign ratings and by investor preferences”. That said, there is interesting data contained in the speech, below. Note the focus on household debt. But no data on loan to income (again!)

The Reserve Bank has always emphasised the value of using a wide range of data to better understand economic developments. One relatively new source of data for us is what we refer to as the Securitisation Dataset. Today, I’ll briefly describe this dataset and then I want to tell you a few of the interesting things we are learning from it.[1]

The Bank collects data on asset-backed securities. Currently, the dataset covers about 280 ‘pools’ of securitised assets. We require these data to ensure that the securities are of sufficient quality to be eligible as collateral in our domestic market operations. The vast bulk of the assets underlying these securities are residential mortgages (other assets, such as commercial property mortgages and car loans, constitute only about 2 per cent of the pools). Some of these are ‘marketed securities’ that have been sold to external investors. There are also securities that banks have ‘self-securitised’.[2]

Self-securitisations are primarily used by participating banks for the Committed Liquidity Facility (CLF) in order to meet their regulatory requirements.[3] The size of the CLF across the banking system is currently $217 billion. Self-securitisations are also used to cover payment settlements that occur outside business hours via ‘open repo’ transactions with the RBA.

The Bank has required the securitisation data to be made available to permitted data users (such as those who intend to use the data for investment, professional or academic research). This has helped to enhance the transparency of the market. Much of that has been achieved by requiring data that is comparable across different pools of securities.

Another benefit of the Securitisation Dataset is that it provides a useful source of information to help us better understand developments in the market for housing loans. The dataset covers information on 1.6 million individual mortgages with a total value of around $400 billion. Currently, this accounts for about one-quarter of the total value of home loans outstanding in Australia.

Nature of the data

Let me make a few brief remarks about the nature of the data.

For each housing loan, we collect (de-identified) data on around 100 fields including:

  • loan characteristics, such as balances, interest rates, loan type (e.g. principal-and-interest (P&I), interest-only), loan purpose (e.g. owner-occupier, investor) and arrears status;
  • borrower characteristics, such as income and the type of employment (e.g. pay as you go (PAYG), self-employed);
  • details on the collateral underpinning the mortgage, such as the type of property (e.g. house or apartment), its location (postcode) and its valuation.[4]

The dataset is updated each month with a lag of just one month. The frequency and timeliness of the data allow us to observe changes in interest rates, progress on repayments (i.e. the current loan balance) and the extent of any redraw or offset balances (just to name a few) without much delay.

I should note that, while the dataset covers a significant share of the market for housing loans, it may not be entirely representative across all its dimensions. In particular, the choice of assets in the collateral pool may be influenced by the way that credit ratings agencies assign ratings and by investor preferences. Also, in practice it may take quite a while until new loans enter a securitised pool. I’ll mention one important example of this later.

Now let’s look at some interesting things we have learnt from this dataset.

1. Interest Rates

In the years prior to 2015, banks would generally advertise only one standard variable reference rate for housing loans.[5] There was no distinction, at least in advertised rates, between investors and owner-occupiers, or between principal-and-interest and interest-only loans. That changed when the banks responded to requirements by the Australian Prudential Regulation Authority (APRA) to tighten lending standards, with a particular focus on investor loans. Then, earlier this year, APRA and the Australian Securities and Investments Commission (ASIC) further tightened lending standards: this time the focus was on interest-only lending. A key concern has been that interest-only loans are potentially more risky than principal-and-interest loans. This is because with a principal-and-interest loan the borrower is required to regularly pay down the loan and build up equity. Also, interest-only borrowers can face a marked step-up in their required repayments once they come off the interest-only period (after the first few years of the loan term).

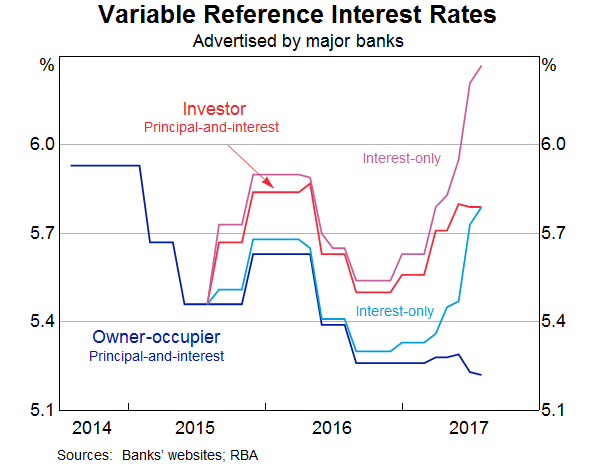
Among other things, the banks have responded to these regulatory actions by increasing interest rates on investor and interest-only loans. There are now four different advertised reference rates, one for each of the key types of loans (Graph 1). While the data in Graph 1 provide a useful guide to interest rate developments, they only cover advertised or reference rates for variable loans applicable to the major banks. Actual rates paid on outstanding loans differ from these for a few reasons. Borrowers are typically offered discounts on reference rates, which can vary according to the characteristics of the borrower and the loan. Discounts offered may vary across institutions, reflecting factors such as funding costs and market segmentation. (For example, non-bank lenders typically compete for different borrowers than the major banks.) The level of the discounts has also varied over time. Furthermore, there are fixed-rate loans, for which rates depend on the vintage of the loan.

Graph 1
Graph 1: Variable Reference Interest Rates


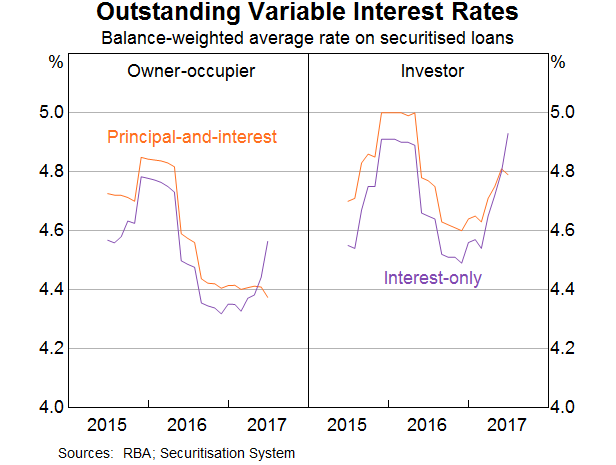
The Securitisation Dataset provides us with a timely and detailed source of information on the actual interest rates paid by households on their outstanding loans. Graph 2 shows rates paid on specific types of loans and by different types of borrowers.[6]

Graph 2
Graph 2: Outstanding Variable Interest Rates


The first thing to note is that rates on owner-occupier loans and investor loans used to be similar, but investor loans became relatively more expensive from the latter part of 2015. Again, this followed regulatory measures to impose a ‘benchmark’ on the pace of growth of investor credit, which had picked up noticeably.

The second development I’d draw your attention to is the variation in housing loan interest rates over time. There were declines in 2016 following the reduction in the cash rate when the Reserve Bank eased monetary policy in May and then August. More recently, rates have increased for investor loans and interest-only loans, with a premium built into the latter as lenders have responded to the tightening in prudential guidance earlier this year. As part of that guidance, lenders will be required to limit the share of new mortgages that are interest-only to 30 per cent. Meanwhile, interest rates on principal-and-interest loans to owner-occupiers are little changed and remain at very low levels. Pulling this all together, the average interest rate paid on all outstanding loans has increased since late last year, but only by about 10 basis points.

A third and subtle point relates to the differences in the level of interest rates actually paid on different loan products (Graph 2) when compared with reference rates (Graph 1). The reference rates suggest that any given borrower would expect to pay a higher rate on an interest-only loan than on a principal-and-interest loan. That makes sense for two reasons. First, because the principal is paid down in the case of principal-and-interest loans, those loans are likely to be less risky for the banks; other things equal, you would expect them to attract a lower interest rate. Second, the banks have added a premium to interest-only loans of late to encourage customers to take on principal-and-interest loans and constrain the growth of interest-only lending.

But Graph 2 (based on securitised loans) suggests that, up until most recently, actual rates paid on interest-only loans have been lower than those on principal-and-interest loans. This doesn’t necessarily imply a mispricing of risk. Rather, it appears to reflect differences in the nature of loans and borrowers across the two types of loan products. In particular, borrowers with an interest-only loan tend to have larger loan balances (of around $85 000–100 000) and higher incomes (of about $30 000–40 000 per annum).[7]

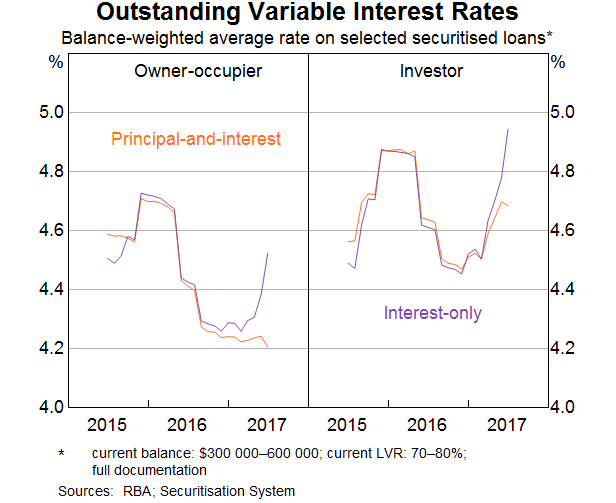
We can control for some of these differences between loan characteristics (such as loan size, loan-to-valuation ratio (LVR) and documentation type). When we do that, we find that rates have been much more similar across the two loan types in the past; although, a wedge has opened up more recently as we’d expect (Graph 3).

Graph 3
Graph 3: Outstanding Variable Interest Rates - selected loans


This highlights the value of examining loan-level data. We find that interest rates are lower for borrowers that are likely to pose less risk (as indicated, for example, by lower loan-to-value ratios and full documentation). Borrowers with larger loans – who typically have higher income levels – also tend to attract lower interest rates. In relation to loan size, this suggests that borrowers with larger loans may have somewhat greater bargaining power.

2. Loan-to-Valuation Ratios and Offset Balances

The Securitisation Dataset provides us with a measure of the LVR, based on the current loan balance.[8] We refer to this here as the ‘current LVR’. This is one indicator of the riskiness of a loan. Other things equal, higher LVRs tend to be associated with a greater risk of default (and greater loss for the lender in the case of default).[9]

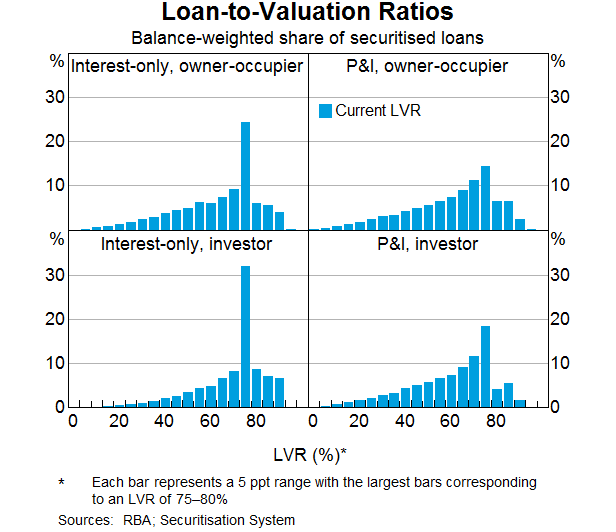
Graph 4 shows current LVRs for owner-occupiers and investor loans, split into interest-only and principal-and-interest loans. I should emphasise again that the Securitisation Dataset may not be entirely representative of the set of all mortgages, particularly when it comes to LVRs. That is because high LVR loans may be less likely to be added to a pool of securitised assets in order to ensure that the securitisation achieves a sufficiently high credit rating.[10]

With that caveat in mind, we see that there is a large share of both owner-occupier and investor loans with current LVRs between 75 and 80 per cent. That is consistent with banks limiting the share of loans with LVRs (at origination) above 80 per cent. Also, borrowers have an incentive to avoid the cost of mortgage insurance, which is typically required for loans with LVRs (at origination) above 80 per cent.

Graph 4
Graph 4: Loan-to-Valuation Ratios - current


Comparing investor loans with owner-occupier loans, we can see that investors have a larger share of outstanding loans with current LVRs of 75 per cent or higher.[11] That’s most obvious in the case of interest-only loans, but is also true for principal-and-interest loans. This reflects the investor’s financial incentive to maximise the amount of funds borrowed (without breaching the banks’ threshold above which they require lenders mortgage insurance). That can be more easily achieved with an interest-only loan. And, even in the case of principal-and-interest loans, investors don’t have the same incentives as owner-occupiers to get ahead of their scheduled repayments.

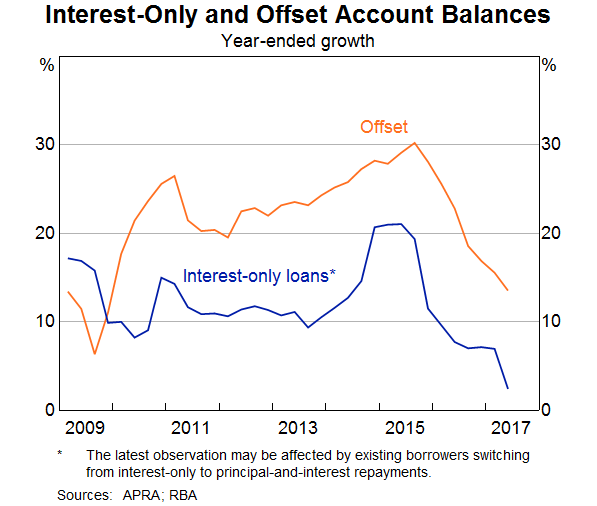
But what I’ve just shown doesn’t account for offset accounts. These have grown rapidly over recent years and are now an important feature of the Australian mortgage market (Graph 5). Funds held in these accounts are ‘offset’ against the loan balance, reducing the interest payable on the loan. In that way they are similar to a principal repayment. But, unlike the scheduled principal repayment, offset (and redraw) balances can be moved in and out freely by the borrower.

Graph 5
Graph 5: Interest-Only and Offset Account Balances


Part of the strong growth in offset balances up to 2015 appears to have been related to the rise in the share of interest-only loans, with the two being offered as a package. Interestingly, we saw a significant slowing in growth in offset balances around the same time as growth in interest-only housing loans started to decline.

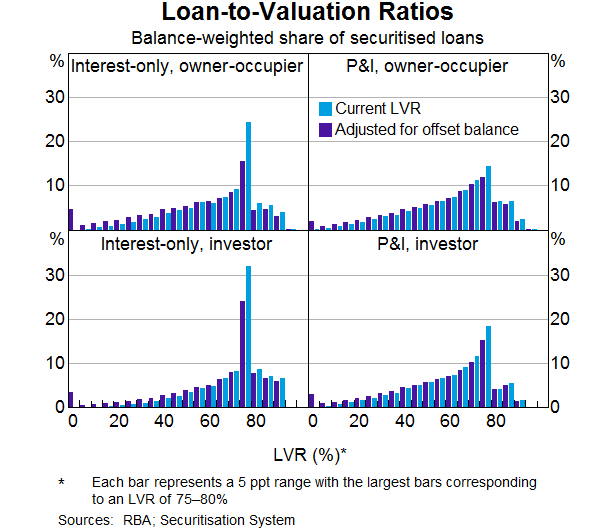
Graph 6 highlights how the distribution of current LVRs is altered if we deduct funds held in offset accounts from the balance owing. This suggests that for owner-occupier loans, interest-only borrowers are behaving somewhat like those with principal-and-interest loans. That is, many of those borrowers have built up significant balances in offset accounts. If needed in times of financial stress – such as a period of unemployment – borrowers could use those balances to service their mortgages.

Graph 6
Graph 6: Loan-to-Valuation Ratios


However, I would caution against any suggestion that this similarity regarding the build-up of financial buffers means that the tightening of lending standards for interest-only loans was not warranted – far from it. What matters when it comes to financial stability is not what the average borrowers are doing, but what the more marginal borrowers are doing. There are two important points to make on this issue.

First, for investor loans, even after accounting for offset balances, there is still a noticeable share of loans with current LVRs of between 75 and 80 per cent. And for both investor and owner-occupier loans, adjusting for offset balances leads to only a small change in the share of loans with current LVRs greater than 80 per cent. This suggests that borrowers with high current LVRs have limited repayment buffers.

The second point is that more marginal borrowers are now more likely to take on a principal-and-interest loan than in the past. One reason is that there is a premium on the interest rates charged on an interest-only loan (for any given borrower, compared with an owner-occupier loan). Another reason is that banks, at APRA’s direction, have also tightened their lending standards for interest-only loans, most notably by reducing the share of new interest-only loans with high LVRs at origination.[12]

3. Arrears by region

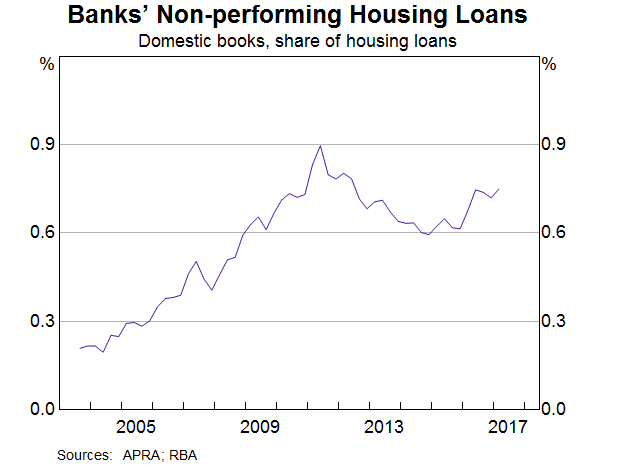
Banks’ non-performing housing loans have increased a little over recent years (Graph 7). However, at around ¾ of one per cent as a share of all housing loans, non-performing loans remain low and below the levels reached following the global financial crisis.

Graph 7
Graph 7: Banks' Non-performing Housing Loans


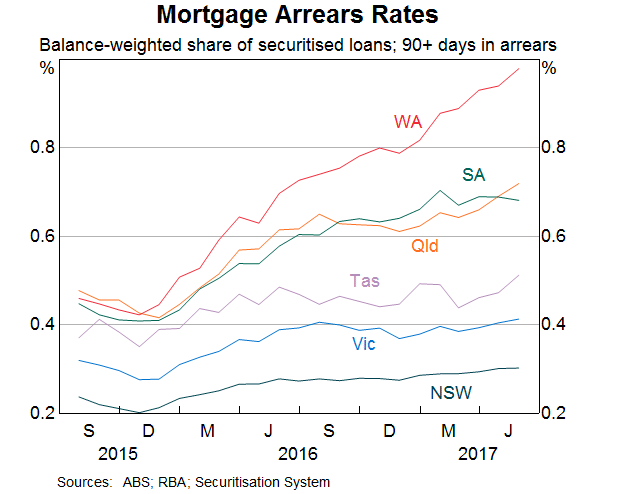
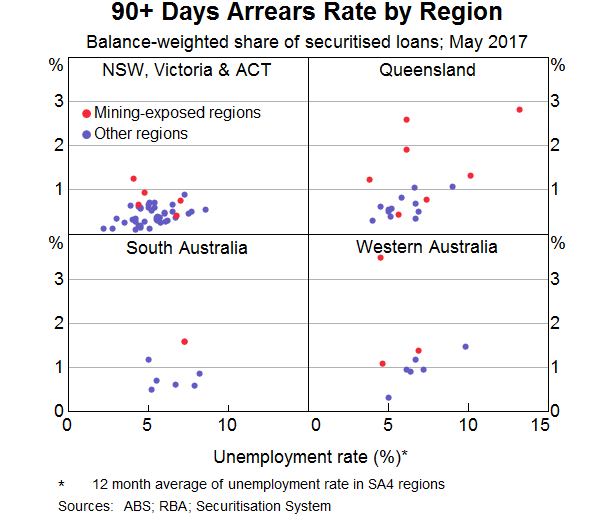
Using the Securitisation Dataset we can assess how loans are performing across different parts of the country by examining arrears rates. Like non-performing loans, the arrears rates have increased a little but remain low.[13] Arrears have risen more in regions experiencing weak economic conditions over recent years. In particular, there has been a more noticeable pick-up in arrears rates in Western Australia, South Australia and Queensland since late 2015 (Graph 8).

Graph 8
Graph 8: Mortgage Arrears Rates


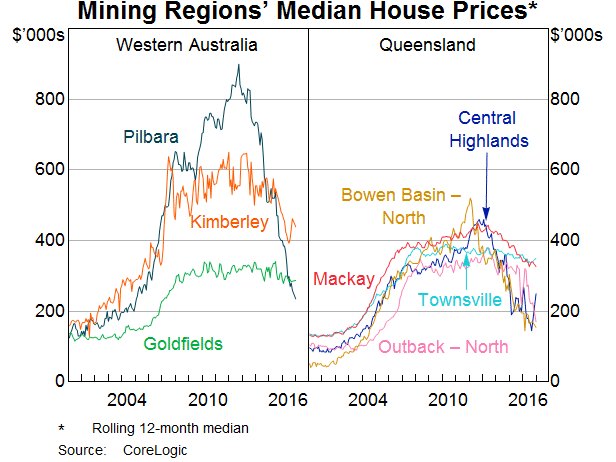
The Securitisation Dataset allows us to drill down even further to examine some relationships between arears and other factors. A key factor contributing to a borrower entering into arrears is a reduction in income, most obviously via a period of unemployment. We find that there is a positive relationship between arrears rates and the unemployment rate across regions (Graph 9).[14] However, the relationship is not especially strong, which suggests that other factors are at play. For example, arrears rates are higher in mining-exposed regions, which have generally experienced a sharp fall in demand following the end of the mining investment boom. One indicator of that has been the pronounced fall in the demand for housing in those parts of the country as indicated by a decline in housing prices (Graph 10).

Graph 9
Graph 9: 90+ Days Arrears Rate by Region
Graph 10
Graph 10: Mining Regions' Median House Prices

Conclusion

The Securitisation Dataset plays a crucial role in allowing the Reserve Bank to accept asset-backed securities as collateral in our domestic market operations. The development of this database and its availability to investors has also helped to enhance the transparency of the securitisation market.

A useful additional benefit of this database is that it provides us with a range of timely insights into the market for housing loans. I’ve discussed how things like actual interest rates paid, loan balances and arrears vary over time and across different types of mortgages and borrowers. Although variable interest rates for investor loans and interest-only loans have risen noticeably over recent months, the average interest rate paid on all outstanding loans has increased by only about 10 basis points since late last year. Also, many borrowers on interest-only loans have built up sizeable offset balances. But even after taking those into account, it appears that current loan-to-valuation ratios still tend to be larger than in the case of principal-and-interest loans. Finally, while mortgage arrears rates have increased slightly over recent years, they have increased more noticeably in regions exposed to the downturn in commodity prices and mining investment.

Endnotes

I thank Michael Tran and Michelle Bergmann for invaluable assistance in preparing these remarks. [*]

For more detail, see Aylmer C (2016), ‘Towards a More Transparent Securitisation Market’, Address to Australian Securitisation Conference, Sydney, 22 November. [1]

I use the term banks here to refer to all authorised deposit-taking institutions (ADIs), namely banks, building societies and credit unions. [2]

The RBA provides a Committed Liquidity Facility (CLF) to participating ADIs required by APRA to maintain a liquidity coverage ratio (LCR) at or above 100 per cent. [3]

For more details, see reporting templates on the Securitisations Industry Forum website. The valuation is typically from the time of origination. [4]

An exception was a period during the 1990s, when banks advertised distinct rates for owner-occupier and investor loans. [5]

Modernised reporting forms that are collected by APRA on behalf of the RBA and the Australian Bureau of Statistics will significantly improve the aggregate and institution-level data that are currently collected from ADIs and registered financial corporations (RFCs). While the new data will have less granularity than the Securitisation Dataset, they will have much greater coverage. [6]

The figure for income is the average of all borrowers for each loan. That is, a given loan may be in the name of more than one borrower; on average, there are 1.7 borrowers per loan. [7]

The balance of a loan is reduced via scheduled repayments of the principal and by any repayments ahead of schedule. The latter may be accessible through a redraw facility. [8]

Read, Stewart and La Cava (2014), ‘Mortgage-related Financial Difficulties: Evidence from Australian Micro-level Data’, RBA Research Discussion Paper No 2014-13. [9]

Some analysis we have conducted on the representativeness of the Securitisation Dataset suggests that it has fewer high LVR loans than the broader population of loans. There is also a tendency to include loans in securitisation pools only after they have aged somewhat (i.e. become more ‘seasoned’). [10]

The share of new investor loans with very high LVRs (above 90 per cent) at the time of origination has been declining for a few years and is below that for owner-occupier loans (Reserve Bank of Australia (2017), Financial Stability Review, April). This feature is not apparent in the data I’ve shown here, which is based on the current LVR for the stock of outstanding securitised loans, including those that are well advanced in age. [11]

APRA have instructed lenders to implement stricter underwriting standards for interest-only loans with LVRs greater than 80 per cent (see: <http://www.apra.gov.au/MediaReleases/Pages/17_11.aspx>). [12]

The 90+ days arrears rate refers to the share of loans that have been behind the required payment schedule or missed payments for 90 days or more but not yet foreclosed. [13]

These regions are defined in terms of the ABS’s Statistical Areas Level 4 (SA4s), which are geographic boundaries defined for the Labour Force Survey. The boundaries for most SA4s cover at least 100 000 persons. The Securitisation Dataset identifies loans according to the location of the mortgaged property.


Global Factors Are Driving Low Wage Growth – RBA

RBA Governor Philip Lowe’s Opening Statement to the House of Representatives Standing Committee on Economics today contained a few gems.

Globally monetary policy stimulus may be reducing, whilst low wage growth is linked to a complex range of global factors, from technology, competition and lack of security. Locally, business investment is still sluggish, and the RBA says, household are adjusting to lower wage growth. They still back 3% growth in the years ahead.

Since we last met in February, the global economy has strengthened. As a result, in most advanced economies, economic growth has been sufficient to push unemployment rates down further. A number of countries now have unemployment rates that are close to, or below, conventional estimates of full employment. Conditions have also improved in many emerging market economies, partly due to an increase in global trade. Commodity prices have mostly risen over recent months.

In China, growth has surprised on the upside a little of late. The main challenge there continues to be containing the risks from the build-up of debt, while at the same time keeping growth on a steady path. This remains a work in progress. Economic growth has also picked up in the euro area, with conditions the best they have been since the euro area crisis in 2012. On the other side of the ledger, though, in the United States the earlier optimism that the new administration’s fiscal policies would spur stronger growth has dissipated.

Since we last met, the Federal Reserve has increased interest rates twice and the policy rate in the United States now stands at 1¼ per cent. Despite this, the US dollar has depreciated in global markets, which has surprised many observers. The Bank of Canada has also increased its interest rate, reversing some of the policy insurance it took out earlier when the outlook was less positive. Elsewhere, there is no longer an expectation that central banks will announce yet further monetary stimulus and some central banks have indicated that they may scale back some of the current stimulus if conditions continue to improve. This is a positive development.

As well as this change in the outlook for global monetary policy, another prominent theme in discussions of the global economy of late has been the slow growth in wages. Despite the success that a number of countries have had in generating jobs, wage growth remains low. This is contributing to a continuation of inflation rates that are below target in most advanced economies, although in headline terms they are mostly higher than a year ago.

The reasons for the low growth in wages are complex. The fact that it is a common experience across countries suggests some global factors are at work. One possibility is that workers feel a heightened sense of potential competition; either from advances in technology or from international competition. More competition means less opportunity to put your price up. In the case of workers, it means slower rates of increase in wages. At the same time, many workers feel an increased sense of uncertainty and they feel less secure. This too is contributing to slow aggregate wage growth. The slow growth in wages is underpinning the low inflation outcomes in much of the world. It is possible that these effects will pass and that the normal relationship between tighter labour markets and higher wages will reappear. It is also possible that the current environment turns out to be quite persistent. How things turn out on this front is likely to have a significant bearing on the next stage in the global economic cycle.

I would now like to turn to the Australian economy.

The most recent GDP data are quite dated now and are for the March quarter. They showed growth weaker than we had earlier expected. This, however, partly reflected temporary factors, including weather-related disruptions to production and quarter-to-quarter volatility in resource exports. Since then, the recent run of data has been consistent with a pick-up in growth. There has been an improvement in survey-based measures of business conditions and capacity utilisation has increased. Employment growth has also picked up and retail spending has been a bit stronger of late. Financial conditions remain favourable, with interest rates remaining low and banks willing to lend.

The Reserve Bank released its latest forecasts for the economy last Friday. In summary, our central scenario is for GDP to grow at an average of around 3 per cent over the next couple of years. This would be better than we have seen for some time. The transition to lower levels of mining investment following the mining investment boom is now almost complete. This means that falling levels of mining investment will not be a drag on the economy for much longer. Instead, with some large LNG projects reaching completion soon, GDP growth is expected to be boosted by a lift in LNG exports.

For some time we have been looking for a strong pick-up in private business investment outside the resources sector. This is taking longer to occur than expected. While we do see positive signs in parts of the economy, many firms still show some reluctance to commit to significant investment, often citing a range of uncertainties. It is possible that this reluctance will continue for a while yet. But it is also possible that the improvement in business conditions that we have seen will give firms the confidence to invest more, after a period of under-investment. We have incorporated a middle path into our own forecasts.

On the investment front a positive development has been an increase in spending on public infrastructure, particularly transport. This is directly supporting aggregate demand and is having some positive spin-offs elsewhere in the economy. It is also addressing earlier under-investment and should improve the supply side of the economy.

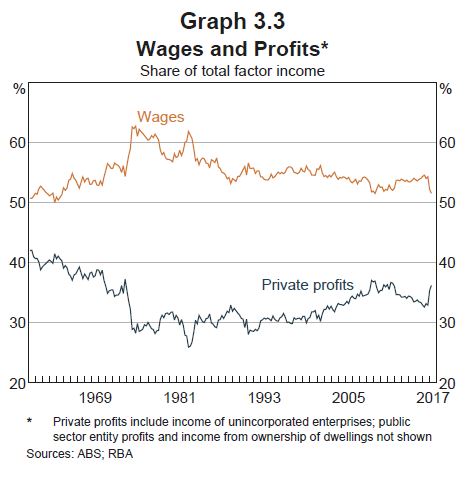
Another factor that has a bearing on the outlook is the behaviour of households. There is an adjustment going on, with many people getting used to lower growth in their real wages. Many now see this as more than just a temporary development, with wage increases of 2 point something per cent now the norm. In my view, the underlying drivers of the slower wage growth in Australia are much the same as we are seeing overseas. At the same time, the household sector is also dealing with higher levels of debt relative to income. Higher electricity prices are also affecting household budgets. This all means that consumer spending behaviour is something we continue to watch carefully.

One positive development in this area over recent times has been a pick-up in employment growth, which should boost incomes. A little while ago, employment growth was on the weak side and the unemployment rate had ticked up. In contrast, in recent months employment growth has been noticeably stronger and more people have entered the labour force. Encouragingly, the gain in jobs is evident in all states, including in Western Australia and Queensland, which have been adjusting to lower levels of mining investment. Our central scenario is for the national unemployment rate to move gradually lower, although it is likely to be some time before we reach what could be considered full employment in Australia.

Another area that we continue to watch closely is the housing market. Conditions continue to vary significantly across the country. The Melbourne and Sydney markets have been much stronger than elsewhere. There are some signs of slowing in these two markets, although these signs are not yet definitive. In some markets, a large increase in the supply of new dwellings is expected over the next year as new buildings are completed. This increase in supply is expected to have an effect on prices.

In terms of inflation, when we last met I suggested that inflation was at a trough and was expected to increase gradually. Recent outcomes have been consistent with this. Both headline and underlying inflation have risen and are currently running a little under 2 per cent. Inflation is likely to continue to move higher gradually, with the headline measure boosted by higher prices for tobacco, electricity and gas. A consideration working in the other direction is increased competition in the retail sector, particularly from new entrants. This is likely to continue for a while yet. The low wage increases are also contributing to the subdued inflation outcomes.

One factor that is influencing the outlook for both economic growth and inflation is the exchange rate. The recent appreciation means lower prices for imported goods and it is weighing on the outlook for domestic output and employment. Further appreciation, all else constant, would cause a slower pick-up in inflation and slower progress in reducing unemployment.

Since August last year, the Reserve Bank Board has held the cash rate steady at 1.5 per cent. This setting of monetary policy is supporting employment growth and a return of inflation to around its average rate of the past couple of decades. The Board is seeking to do this in a way that does not add to the medium-term balance-sheet risks facing the economy. It has been conscious that a balance needs to be struck between the benefits of monetary stimulus and the medium-term risks associated with rising levels of debt relative to our incomes.
As a result, the Board has been prepared to be patient. The fact that the unemployment rate has been broadly steady has allowed us this patience. We have preferred a prudent approach, which is most likely to promote both macroeconomic and financial stability consistent with the medium-term inflation target.

The Reserve Bank has continued to work closely with APRA through the Council of Financial Regulators to address financial risks. Our assessment is that the various supervisory measures – including a focus on lending standards and placing limits on investor and interest-only lending – will work to strengthen household balance sheets over time. Financial institutions have adjusted to the new requirements and these requirements are contributing to the resilience of the system as a whole.


RBA Bullish On Growth

The latest RBA Statement on Monetary Policy released today appears to be very upbeat. Despite forecasting growth down a bit in the near term, they are still holding the view of growth above 3% later, and if this is correct, supported by and improving international economic outlook, a rise in business investment, strong exports and low unemployment, then it seems to me conditions would be right to lift the cash rate towards the neutral position (which as we saw recently they hold to be 2% higher than current levels). That said, many economic commentators think the RBA is overly bullish, given high household debt and flat income growth, and risks in the property market.  Here are some relevant extracts.

The economy is expected to grow at an annual rate of around 3 per cent over the next couple of years, which is a bit higher than estimates of potential growth. The unemployment rate is accordingly expected to edge lower. Underlying inflation is higher than late last year; it is expected to reach around 2 per cent over the second half of 2017 and increase a little thereafter. The forecast for headline inflation has been revised a little higher, and lies between 2 and 3 per cent over much of the forecast period.

The forecast pick-up in inflation reflects a number of factors. As spare capacity in the labour market declines, this is expected to lead to a gradual increase in wage growth from its current low rates. Higher utilities inflation will add to overall inflation over the next year, although it is difficult to know exactly how much higher energy costs will be built into the prices of other goods and services. Headline inflation will also be boosted by further tobacco excise increases over the next couple of years.

Working in the opposite direction are the effects of the recent exchange rate appreciation, ongoing competition in the retail industry and low rent inflation.

By the end of the forecast period, the unemployment rate is forecast to be a little under 5½ per cent. This forecast is little changed from three months ago, and implies that some spare capacity in the labour market will remain. Recent stronger conditions in the labour market have afforded greater confidence in this forecast. Since the start of the year, around 165 000 full-time jobs have been created, average hours worked have increased and labour force participation has risen. Employment has increased in every state over this period, including in the miningexposed states. This suggests that the drag on economic activity from the earlier declines in the terms of trade and falling mining investment is running its course. The unemployment and underemployment rates have both edged lower. Indicators of labour demand point to continued employment growth and little change in the unemployment rate over coming quarters.
Wage growth is expected to remain subdued, but to increase gradually over the forecast period as labour market conditions continue to improve. The increase in minimum and award wages announced by the Fair Work Commission will add a little to wage growth in the September quarter.

The experience of some economies that are already close to full employment suggests that declining spare capacity might take some time to flow through to wage and thus price inflation. Inflationary pressures could instead emerge more quickly if workers seek to ‘catch up’ after a long period of low wage growth. The recent growth in employment is supporting growth in household income and indications are that growth in household consumption increased in the June quarter. Further out, continued employment growth and somewhat faster average household income growth are expected to support consumption growth, which is forecast to be a little above its post-crisis average in the period ahead.

A number of factors could offset the forces supporting stronger consumption growth. Slow real wage growth is likely to weigh on consumption, especially if households expect the slow growth to continue for some time.

However, ongoing expectations for low real wage growth remain a key downside risk for household spending. The recent sharp increase in the relative price of utilities poses a further downside risk to the non-energy part of household consumption to the extent that households find it hard to reduce their energy consumption; this is likely to have a larger effect on the consumption decisions of lower-income households.

Some households may also feel constrained from spending more out of their current incomes because of elevated levels of household debt. This effect would become more prominent if housing prices and other housing market conditions were to weaken significantly. Household debt is likely to remain elevated for some time: housing credit growth overall has been steady over the past six months, but has continued to outpace income growth. The composition of that debt is changing, however, as lenders respond to regulators’ recent measures to contain risks in the mortgage market. Investor credit growth has moderated and loan approvals data suggest this will continue in coming months. Also, new interest-only lending has declined recently in response to the higher interest rates now applying to these loans and other actions by the banks to tighten lending standards.

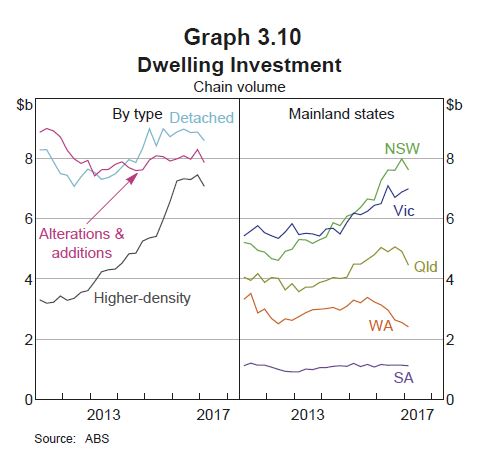
Dwelling investment is likely to recover from the partly weather-related weakness of the March quarter and stay at a high level over the next year or so, sustained by the large pipeline of residential building work already approved or underway. However, dwelling investment is not expected to make a material contribution to GDP growth.

The number of new residential building approvals has stepped down since last year; if they remain at this level, dwelling investment would be expected to start to decline in a year or so. Conditions in the established housing markets of the two largest cities remain fairly strong, although housing price growth appears to have eased a bit in recent months, more so in Sydney than in Melbourne. Housing prices in Perth have declined a little further, while growth in apartment prices in Brisbane has been weak.

Looking at Bank Funding the RBA says the implied spread between lending rates and debt funding costs for the major banks is estimated to have increased over the past year. Most of this increase was a result of higher interest rates on investor and interest-only housing lending. Lower funding costs have also contributed to the increase in the implied spread.

Housing credit growth has been stable over recent months. Growth in investor housing credit has declined recently, after accelerating through the second half of 2016. This has been largely offset by slightly faster growth in housing credit extended to owner-occupiers.

There are a number of uncertainties that could affect housing prices, particularly in the eastern states. The risk of more weakness in apartment prices in some locations where a large amount of supply is coming online remains. This could mean that buildings approved but not commenced do not go ahead, in which case dwelling investment and related household spending would be weaker than expected. Declining housing prices could also cause difficulties for some apartment developers.

Recent state and federal budget measures intended to restrain foreign investment have not yet had time to have had their full effects, which are uncertain; however, the effects are likely to be
largest in housing markets where foreign buyers have been most active, particularly inner-city apartments.


RBA Holds Cash Rate Once Again

The RBA held the cash rate today, and gave little new information, though suggesting that growth is still expected to pick up, and employment improve, but not wage growth. They also warn “growth in housing debt has been outpacing the slow growth in household incomes”, signalling even higher household debt. What was new was a warning about the drag effect on growth of a higher dollar!

At its meeting today, the Board decided to leave the cash rate unchanged at 1.50 per cent.
Conditions in the global economy are continuing to improve. Labour markets have tightened further and above-trend growth is expected in a number of advanced economies, although uncertainties remain. Growth in the Chinese economy has picked up a little and is being supported by increased spending on infrastructure and property construction, with the high level of debt continuing to present a medium-term risk. Commodity prices have generally risen recently, although Australia’s terms of trade are still expected to decline over the period ahead.

Wage growth remains subdued in most countries, as does core inflation. Headline inflation rates have declined recently, largely reflecting the earlier decline in oil prices. In the United States, the Federal Reserve expects to increase interest rates further and there is no longer an expectation of additional monetary easing in other major economies. Financial markets have been functioning effectively and volatility remains low.

The Bank’s forecasts for the Australian economy are largely unchanged. Over the next couple of years, the central forecast is for the economy to grow at an annual rate of around 3 per cent. The transition to lower levels of mining investment following the mining investment boom is almost complete, with some large LNG projects now close to completion. Business conditions have improved and capacity utilisation has increased. Some pick-up in non-mining business investment is expected. The current high level of residential construction is forecast to be maintained for some time, before gradually easing. One source of uncertainty for the domestic economy is the outlook for consumption. Retail sales have picked up recently, but slow growth in real wages and high levels of household debt are likely to constrain growth in spending.
Employment growth has been stronger over recent months, and has increased in all states. The various forward-looking indicators point to continued growth in employment over the period ahead. The unemployment rate is expected to decline a little over the next couple of years. Against this, however, wage growth remains low and this is likely to continue for a while yet.

The recent inflation data were broadly as the Bank expected. Both CPI inflation and measures of underlying inflation are running at a little under 2 per cent. Inflation is expected to pick up gradually as the economy strengthens. Higher prices for electricity and tobacco are expected to boost CPI inflation. A factor working in the other direction is increased competition from new entrants in the retail industry.

The Australian dollar has appreciated recently, partly reflecting a lower US dollar. The higher exchange rate is expected to contribute to subdued price pressures in the economy. It is also weighing on the outlook for output and employment. An appreciating exchange rate would be expected to result in a slower pick-up in economic activity and inflation than currently forecast.

Conditions in the housing market vary considerably around the country. Housing prices have been rising briskly in some markets, although there are some signs that these conditions are starting to ease. In some other markets, prices are declining. In the eastern capital cities, a considerable additional supply of apartments is scheduled to come on stream over the next couple of years. Rent increases remain low in most cities. Investors in residential property are facing higher interest rates. There has also been some tightening of credit conditions following recent supervisory measures to address the risks associated with high and rising levels of household indebtedness. Growth in housing debt has been outpacing the slow growth in household incomes.

The low level of interest rates is continuing to support the Australian economy. Taking account of the available information, the Board judged that holding the stance of monetary policy unchanged at this meeting would be consistent with sustainable growth in the economy and achieving the inflation target over time.

Home Lending Powers On (If You Believe The Figures)

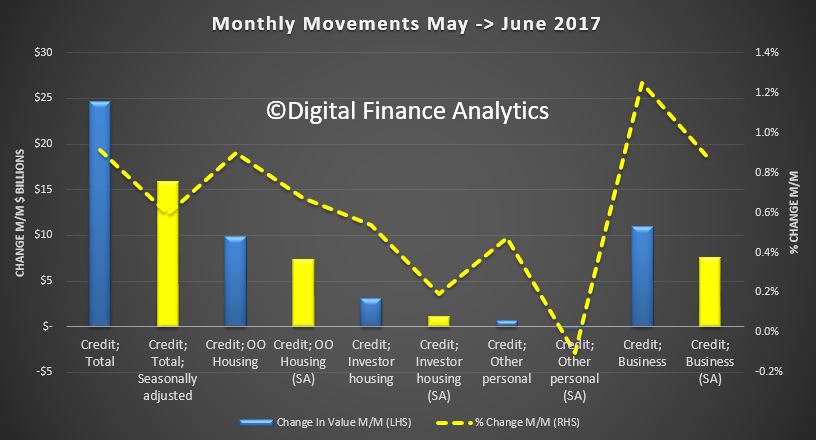
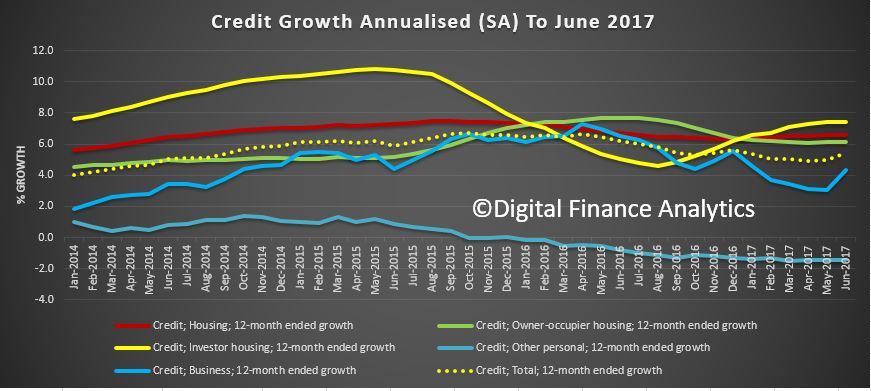
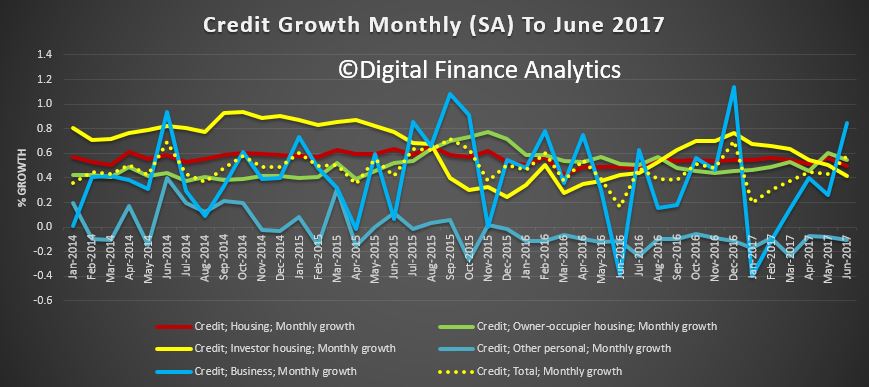
The latest credit aggregates from the RBA to June 2017 shows continued home lending growth, up 0.5% in the month, or 6.6% annually. Business lending rose 0.9%, or 4.4% annually, and personal credit fell 0.1% or down 4.4% over the past year. However, they changed the seasonally adjusted assumptions, so it is hard to read the true picture, especially when we still have significant reclassification going on.  In original terms housing loans grew to $1.69 trillion, another record.

Investor home lending grew 0.5% or $3.13 billion, but this was adjusted down in the seasonal adjusted series to 0.2% or $1.13 billion. Owner occupied lending rose 0.9% or $9.83 billion in original terms, or 0.7% or $7.34 billion in adjusted terms. Business lending rose 1.2% of $11 billion in original terms or 0.9% of $7.61 billion in original terms. The chart below compares the relative movements.

The RBA says:

Historical levels and growth rates for the financial aggregates have been revised owing to the resubmission of data by some financial intermediaries, the re-estimation of seasonal factors and the incorporation of securitisation data.

… so here is another source of discontinuity in the numbers presented! The movements between original and seasonal adjusted series are significant larger now, and this is a concern. We think the RBA should justify its change of method. Once again, evidence of rubbery numbers!

The annualised growth rates highlight that investor lending is still strong relative to owner occupied loans, business lending recovered whilst personal finance continued its decline.

The more volatile monthly series show investor loans a little lower, while owner occupied loans rise further, and there is a large inflection in business lending.

We need to note that now $55 billion of loans have been reclassified between owner occupied and lending over the past year – with $1.3 billion switched in June. This is a worrying continued trend and raises more questions about the quality of the data presented by the RBA.

Following the introduction of an interest rate differential between housing loans to investors and owner-occupiers in mid-2015, a number of borrowers have changed the purpose of their existing loan; the net value of switching of loan purpose from investor to owner-occupier is estimated to have been $55 billion over the period of July 2015 to June 2017, of which $1.3 billion occurred in June 2017. These changes are reflected in the level of owner-occupier and investor credit outstanding. However, growth rates for these series have been adjusted to remove the effect of loan purpose changes.

Finally they tell us:

All growth rates for the financial aggregates are seasonally adjusted, and adjusted for the effects of breaks in the series as recorded in the notes to the tables listed below. Data for the levels of financial aggregates are not adjusted for series breaks. The RBA credit aggregates measure credit provided by financial institutions operating domestically. They do not capture cross-border or non-intermediated lending.

So, given the noise in the data, it is possible to argue that either home lending is slowing, or it is not – all very convenient. The APRA data we discussed earlier is clearly showing momentum. Growth is still too strong.

It also makes it hard to read the true non-bank growth rates, but we think they are increasing their relative share as some banks dial back their new business.  Taking the non seasonally adjusted data from both APRA and RBA we think the non-bank sector has grown by about $5 billion in the past year to $115 billion. APRA will need to have a look at this, under their new additional responsibility, as we suspect some of the more risky lending is migrating to this less well regulated sector of the market.

Why the trend to use cards instead of cash should be a big worry

From The New Daily.

The revelation that Australian consumers are using card payments more often than cash is a worry because of a lack of fee transparency, an expert has warned.

The Reserve Bank of Australia reported this week that 52 per cent of all transactions are card payments, with only 37 per cent by cash.

Three years ago, cash was 47 per cent and card only 43 per cent.

Cash payments were most common for fast food, cafes, restaurants, bars and pubs, and least common for holidays and household bills. And the biggest users were Australians aged 50 to 65, and those in the bottom half of the income bracket.

Professor Rodney Maddock, a researcher at the Australian Centre for Financial Studies, said the transition to cards is premature because the current system is “wasteful” and “a mess” compared to cash.

“Most people have got no idea of the true cost they’re incurring when they use a credit card or a debit card or Eftpos or BPay. The current system makes it really, really hard for anybody to understand that,” he told The New Daily.

“Some of the fees are paid by the user, some by the merchant and some by the banks. It’s completely opaque.”

How the system works is that banks charge merchants ‘interchange fees’ for every credit or debit card payment they accept. The merchants claw back this money with surcharges (‘If you buy less than $15, we charge you $2’) and with higher prices across their stores.

The banks keep a percentage of these fees, pay a slice to the credit card company whose logo is on the card (probably Visa or Mastercard), and give the remainder as perks to rewards card holders.

Then customers must factor in annual fees and rates of interest charged by their banks.

In a recent paper, Professor Maddock and a colleague called for card holders to be treated the same as ATM users. A message should flash up on the screen asking the card holder if they were willing to pay the fee, they wrote.

“We want all of those costs to be transparent to the customer, because they are paying too many different ways. It’s too hard to tell as a customer what in the hell you are doing.”

Another academic, Professor Steve Worthington at Swinburne Business School, a researcher on the global payments sector, agreed that card fees are “incredibly opaque, incredibly not well understood”.

His particular concern was that consumers might not realise credit card rewards programs have recently been “devalued”.

“It is a very open question if they are worth it in any way, shape or form,” Professor Worthington told The New Daily.

Mozo, a financial product comparison website, has estimated that the average credit card spend required to earn $100 is now $22,426 a year, up from $18,765 in 2015 – and that the average customer would need to spend $60,000 a year on their card to make it worthwhile.

Rewards programs are being devalued because of new Reserve Bank regulations designed to improve transparency by putting caps on interchange fees.

Professor Maddock said the changes have not simplified card payments enough.

“The Reserve Bank has got itself into an awful mess having to regulate lots of different points in the system. It would be a lot simpler if they just regulated at one point.”

Mike Ebstein, a payments consultant and former second-in-charge of credit cards at ANZ, disagreed that card payments are inferior to cash. He said the advent of cards was a “quantum leap in convenience and security”.

“It’s baloney. There is a huge cost to the economy from the cash transactions that remain,” he told The New Daily.

“Merchants that accept cash don’t get value until they bank, there’s shrinkage, there’s pilferage, there’s security.

“Most advanced economies around the world are promoting the transition away from cash towards card payments, which are much more trackable.”

The Australian government has commissioned a taskforce headed by former KPMG chair Michael Andrew to investigate the ‘black economy’. It is widely expected to recommend further curbs on cash payments.

Will Wages Rise Any Time Soon?

On of the drivers of mortgage stress, which continues to rise, is flat and falling income growth. This phenomenon is hitting other economies too, such as the UK.

So, today’s speech from RBA Governor Philip Lowe is timely –  The Labour Market and Monetary Policy. This speech covers trends in employment and wages in Australia, and the impact of these on monetary policy decisions. It describes developments in the labour market in Australia, including the growth of employment in the services sector, and in part-time jobs. The speech then explores the reasons behind subdued wages growth in Australia and other advanced economies, and the challenge this poses for monetary policy. It restates the Bank’s approach to making monetary policy decisions within the framework of a medium-term inflation target, in way that supports sustainable economic growth and serves the public interest.

He makes the point that if some of the long standing links between income growth and monetary policy are not working as they did, more monetary stimulus may encourage investors to borrow to buy assets, which poses a medium-term risk to financial stability.

In comments after the speech, he also made the point that surging asset prices has led to a growth in inequality across Australia.

Whilst unemployment looks reasonable,

… under utilisation is a real issue.

The persistent slow growth in wages is creating a challenge for central banks. It is contributing to an extended period of inflation below target. In years gone by, the more standard challenge was to keep wage growth in check, so as to stop upward pressure on inflation, which could lead to restrictive monetary policy. No advanced economy faces this challenge at present.

It is possible that things could change in the not too distant future, particularly in those countries at, or near, full employment. It may be that the lags are just a bit longer than usual. If so, we could hit a point at which workers, having had only modest pay increases for a run of years, decide that it is time for a catch-up. If such a tipping point were reached, inflation pressures could emerge quite quickly. In this scenario we could see a period of turbulence in financial markets, given that markets are pricing in little risk of future inflation.

This scenario can’t be completely discounted. It would seem, though, to have a fairly low probability in Australia, especially in light of the continuing spare capacity in our labour market. The more likely case here is that wage growth picks up gradually as the demand for labour strengthens.

Globally, an alternative scenario is that the period of slow wage growth turns out to be much more persistent, partly for the reasons that I discussed earlier. In this scenario, wages growth eventually picks up, but it takes quite a while longer. If so, inflation stays low for longer, although there are other factors that could push inflation higher.

This scenario is one in which the Phillips Curve is flatter than it once was. It is one in which inflation is harder to generate. We can’t yet tell though whether the Phillips Curve in Australia has become flatter, given that we have experienced relatively little variation in the unemployment rate over recent times.

The combination of a flatter Phillips Curve and inflation below target raises a challenge for central banks: how hard to press to get inflation up?

For a central bank with a single objective of inflation, the answer is relatively straightforward. Inflation is too low, so you do what you can to get inflation up. If inflation doesn’t increase, you need more monetary stimulus.

This approach does carry risks, though. A flatter Phillips Curve means that the monetary stimulus has relatively little effect on inflation, at least for a while. At the same time, however, the monetary stimulus is likely to push asset prices higher and encourage more borrowing. Faced with low inflation, low unemployment and low interest rates, investors are likely to find it attractive to borrow money to buy assets. This poses a medium-term risk to financial stability.