In a landmark speech, Reserve Bank of Australia governor Philip Lowe has outlined his nightmare scenario of a property market crash, as well as his favourite solution to the affordability crisis.
The RBA is not overly concerned that a “severe correction in property prices” would trigger a banking collapse, as happened in the US in 2008-09, Dr Lowe said on Thursday.
No, he said he was far more worried that Australians would bring the economy to a grinding halt by curbing their spending.
“The Australian banks are resilient and they are soundly capitalised. A significant correction in the property market would, no doubt, affect their profitability. But the stress tests that have been done under APRA’s eye confirm that the banks are resilient to large movements in the price of residential property,” Dr Lowe told the Economic Society of Australia.
“Instead, the issue we have focused on is the possibility of future sharp cuts in household spending because of stretched balance sheets.”
Household debt is “high” relative to incomes, making it likely that many Australians would respond to a market correction with a “sharp correction in their spending”, in an attempt to pay down debt.
“An otherwise manageable downturn could be turned into something more serious.”
The golden solution
Dr Lowe’s speech contained a comprehensive answer to what has caused house prices to skyrocket, at least in Sydney and Melbourne, and what should be done to fix it.
The answer was unlikely to be comforting for either the Liberals or Labor, as it touched on both supply and demand-side fixes.
He dismissed allowing young Australians to use their superannuation for a deposit. “You don’t address affordability by adding to demand.”
But he also downplayed the importance of tax policies. “The best housing policy is really a transport policy,” he said during a question-and-answer session at the end.
In the speech itself, the Governor blamed the house price explosion on an encyclopaedic list of factors, including an increased ability to borrow via financial liberalisation and lower interest rates; supply constrained by zoning issues, geography and, crucially, inadequate roads and trains to link outer suburbs to the inner city.
He also pointed to Australians’ preference for big houses in the big cities; slow income growth; stronger-than-expected population growth; and the rise of investors.
While much has been made of the crackdown of APRA and ASIC on bank lending to investors — indeed, constraining investor demand is the centrepiece of Labor’s solution — Dr Lowe placed far more emphasis on supply issues.
“This borrowing [by investors] is not the underlying cause of the higher housing prices. But the borrowing has added to the upward pressure on prices caused by the underlying supply-demand dynamics. It has acted as a financial amplifier in some cities, adding to the already upward pressure on prices.”
The Governor noted in passing that tax policies (presumably negative gearing and the 50 per cent capital gains tax discount) would “have an effect”, but he was more optimistic about faster rates of home-building, better transport infrastructure, and an eventual rise in the RBA’s cash rate.
“Increased supply and better transport could be expected to help address the ongoing rises in housing prices relative to incomes. These changes and some normalisation of interest rates over time might also reduce the incentive to borrow to invest in an asset whose price is rising strongly.”
RBA Governor Philip Lowe spoke at the Economic Society of Australia (QLD) Business Lunch. Of note is the data which shows one third of households with a mortgage have little or no interest rate buffer, and that the Reserve Bank does not have a target for the debt-to-income ratio or the ratio of nationwide housing prices to income.
This afternoon I would like to talk about household debt and housing prices.
This is a familiar topic and one that has attracted a lot of attention over recent times. It is understandable why this is so. The cost of housing and how we finance it matters to us all. We all need somewhere to live and for many people, their home is their largest single asset. Real estate is also the major form of collateral for bank lending. The levels of debt and housing prices also affect the resilience of our economy to future shocks. Beyond these economic effects, high levels of debt and housing prices have broader effects on the communities in which we live. The high cost of housing is a real issue for many Australians and can have serious side-effects. High levels of debt and high housing costs can also reinforce the existing distribution of wealth in our society, making social and geographic mobility more difficult. So it is understandable why Australians are so interested in these issues.
At the Reserve Bank, we too have been focused on these issues in the context of our monetary policy and financial stability responsibilities. Our work has been in three broad areas. First, understanding the aggregate trends and their causes. Second, understanding how debt is distributed across the community. And third, understanding how the level of debt and housing prices affect the way the economy operates and its resilience to future shocks.
This afternoon, I would like to make some observations in each of these three areas.
Aggregate Trends
This first chart provides a good summary of the aggregate picture (Graph 1). It shows the ratios of nationwide housing prices and household debt to household income. Housing prices and debt both rose a lot from the mid 1990s to the early 2000s. The ratios then moved sideways for the better part of a decade – in some years they were up and in others they were down. Then, in the past few years, these ratios have been rising again. Both are now at record highs.
Graph 1
Although the debt-to-income ratio has increased over recent times, the ratio of debt to the value of the housing stock has not risen. This reflects the large increase in housing prices and the growth in the number of homes. Over recent times, there has also been a substantial increase in the value of households’ financial assets, with the result that the ratio of household wealth to income is at a record high (Graph 2). So both the value of our assets and the value of our liabilities have increased relative to our incomes.
Graph 2
Turning now to why the ratios of housing prices and debt to income have risen over time. A central factor is that financial liberalisation and the lower nominal interest rates that came with the lower inflation of the 1990s increased people’s ability to borrow. These developments meant that Australians could take out larger and more flexible loans. By and large, we took advantage of this new ability, as we sought to buy the housing we desired.
We could, of course, have used the benefit of lower nominal interest rates in the 1990s and the increased ability to borrow for other purposes. But instead we chose to borrow more for housing and this pushed up the average price of housing given the constraints on the supply side. The supply of well-located housing and land in our cities has been constrained by a combination of zoning issues, geography and inadequate transport. Another related factor was that our population was growing at a reasonable pace. Adding to the picture, Australians consume more land per dwelling than is possible in many other countries, although this is changing, and many of us have chosen to live in a few large coastal cities. Increased ability to borrow, more demand and constrained supply meant higher prices.
So we saw marked increases in the ratios of housing prices and debt to household incomes up until the early 2000s. At the time, there was much discussion as to whether these higher ratios were sustainable. As things turned out, the higher ratios have been sustained for quite a while. This largely reflects the choices we have made as a society regarding where and how we live (and how much at least some of us are prepared to spend to do so), urban planning and transport, and the nature of our financial system. It is these choices that have underpinned the high level of housing prices. So the changes that we have seen in these ratios are largely structural.
Recently, the ratios of housing prices and debt to household income have been increasing again. Lower interest rates both in real and nominal terms – this time, largely reflecting global developments – have again played some role. But there have also been other important factors at work over recent times.
One of these is the slow growth in household income. During the 2000s, aggregate household income increased at an average rate of over 7 per cent (Graph 3). In contrast, over the past four years growth has averaged less than half of this, at about 3 per cent. Slower growth in incomes will push up the debt-to-income ratio unless growth in debt also slows. This partly explains what has happened over recent years.
Graph 3
A second factor is that some of our cities have become major global cities. Reflecting this, in some markets there has been strong demand by overseas investors.
A third factor has been stronger population growth. Population growth picked up during the mining investment boom and, although it subsequently slowed, it is still around ½ percentage point faster than it was before the boom (Graph 4). For some time the rate of home-building did not respond to the faster population growth; indeed, the response took the better part of a decade. The rate of home-building has now responded and we are currently adding to the housing stock at a rate not seen for more than two decades. Over time, this will make a difference.
Graph 4
It is Melbourne and Sydney where population growth has been the fastest over recent times. Not surprisingly, it is these two cities where the price gains have been largest, and these price gains have helped induce more supply. Indeed, Victoria and New South Wales account for all of the recent upward movement in the national housing price-to-income ratio (Graph 5). In the other states, the ratio of housing prices to income is below previous peaks. So there is not a single story across the country. This is despite us having a common monetary policy for the country as a whole. Factors other than the level of interest rates are clearly at work.
Graph 5
In summary then, the supply-demand dynamics have been pushing aggregate housing prices in our largest cities higher relative to our incomes. With interest rates as low as they have been, and prices rising, many people have found it attractive to borrow money to invest in an asset whose price is increasing. The result has been strong growth in borrowing by investors, with investors accounting for 30 to 40 per cent of new loans.
This borrowing is not the underlying cause of the higher housing prices. But the borrowing has added to the upward pressure on prices caused by the underlying supply-demand dynamics. It has acted as a financial amplifier in some cities, adding to the already upward pressure on prices. The borrowing by investors is also obviously contributing to the rise in the aggregate debt-to-income ratio. Just like in the early 2000s, there is again a discussion as to whether these increases will continue and whether they are sustainable.
The Distribution of Debt
I would now like to turn to the distribution of housing debt across households. This is important, as it is not the ‘average’ household that gets into trouble. At the Reserve Bank we have devoted considerable resources to understanding this distribution. One important source of household-level information is the survey of Household Income and Labour Dynamics in Australia (HILDA).
If we look across the income distribution, it is clear that the rise in the debt-to-income ratio has been most pronounced for higher-income households (Graph 6). This is different from what occurred in the United States in the run-up to the subprime crisis, when many lower-income households borrowed a lot of money.
Graph 6
It is also possible to look at how the debt-to-income ratio has changed across the age distribution. This ratio has risen for households of all ages, except the very youngest, who tend to have low levels of debt (Graph 7). Borrowers of all ages have taken out larger mortgages relative to their incomes and they are taking longer to pay them off. Older households are also more likely than before to have an investment property with a mortgage and it has become more common to have a mortgage at the time of retirement.
Graph 7
We also look at the share of households with a debt-to-income ratio above specific thresholds. In 2002, around 12 per cent of households had debt that was over three times their income (Graph 8). By 2014, this figure had increased to 20 per cent of households. There has also been an increase, although not as pronounced, in the share of households with even higher debt-to-income ratios.
Graph 8
Another dataset that provides insight into distributional issues is one maintained by the Reserve Bank on loans that have been securitised. This indicates that around two-thirds of housing borrowers are at least one month ahead of their scheduled repayments and half of borrowers are six months or more ahead (Graph 9). This is good news. But a substantial number of borrowers have only small buffers if things go wrong.
Graph 9
At the overall level, though, nationwide indicators of household financial stress remain contained. This is not surprising with many borrowers materially ahead on their mortgage repayments, interest rates being low and the unemployment rate being broadly steady over recent years. At the same time, though, the household-level data show that there has been a fairly broad-based increase in indebtedness across the population and the number of highly indebted households has increased.
Impact on Economy and Policy Considerations
I would now like to turn to the third element of our work: the implications of all this for the way the economy operates and its resilience.
It is now commonplace to say that housing prices and debt levels matter because of financial stability. What people typically have in mind is that a severe correction in property prices when balance sheets are highly leveraged could make for instability in the banking system, damaging the economy. So the traditional financial stability concern is that the banks get in trouble and this causes trouble for the overall economy.
This is not what lies behind the Reserve Bank’s recent focus on household debt and housing prices in Australia. The Australian banks are resilient and they are soundly capitalised. A significant correction in the property market would, no doubt, affect their profitability. But the stress tests that have been done under APRA’s eye confirm that the banks are resilient to large movements in the price of residential property.
Instead, the issue we have focused on is the possibility of future sharp cuts in household spending because of stretched balance sheets. Given the high levels of debt and housing prices, relative to incomes, it is likely that some households respond to a future shock to income or housing prices by deciding that they have borrowed too much. This could prompt a sharp contraction in their spending, as they try to get their balance sheets back into better shape. An otherwise manageable downturn could be turned into something more serious. So the financial stability question is: to what extent does the higher level of household debt make us less resilient to future shocks?
Answering this question with precision is difficult. History does not provide a particularly good guide, given that housing prices and debt relative to income are at levels that we have not seen before, and the distribution of debt across the population is changing.
Given this, one of the research priorities at the Reserve Bank has been to use individual household data to understand better how the level of indebtedness affects household spending. The results indicate that the higher is indebtedness, the greater is the sensitivity of spending to shocks to income. This is regardless of whether we measure indebtedness by the debt-to-income ratio or the share of income spent on servicing the debt. If this result were to translate to the aggregate level, it would mean that higher levels of debt increase the sensitivity of future consumer spending to certain shocks.
The higher debt levels also appear to have affected how higher housing prices influence household spending. For some years, households used the increasing equity in their homes to finance extra spending. Today, the reaction seems different. This is evident in the estimates of housing equity injection (Graph 10). In earlier periods of rising housing prices, the household sector was withdrawing equity from their housing to finance spending. Today, households are much less inclined to do this. Many of us feel that we have enough debt and don’t want to increase consumption using borrowed money. Many also worry about the impact of higher housing prices on the future cost of housing for their children. As I have spoken about previously, higher housing prices are a two-edged sword. They deliver capital gains for the current owners, but increase the cost of future housing services, including for our children.
Graph 10
This change in attitude is also affecting how spending responds to lower interest rates. With less appetite to incur more debt for current consumption, this part of the monetary transmission mechanism looks to be weaker than it once was. There is, however, likely to be an asymmetry here. When the interest rate cycle turns and rates begin to rise, the higher debt levels are likely to make spending more responsive to interest rates than was the case in the past. This is something that we will need to take into account.
In terms of resilience, my overall assessment is that the recent increase in household debt relative to our incomes has made the economy less resilient to future shocks. Given this assessment, the Reserve Bank has strongly supported the prudential measures undertaken by APRA. Double-digit growth in debt owed by investors at a time of weak income growth cannot be strengthening the resilience of our economy. Nor can a high concentration of interest-only loans.
I want to point out that APRA’s measures are not targeted at high housing prices. The international evidence is that these types of measures cannot sustainably address pressures on housing prices originating from the underlying supply-demand balance. But they can provide some breathing space while the underlying issues are addressed. In doing so, they can help lessen the financial amplification of the cycle that I spoke about before. Reducing this amplification while a better balance is established between supply and demand in the housing market can help with the resilience of our economy.
There are some reasons to expect that a better balance between supply and demand will be established over time.
One is the increased rate of home-building. As we are seeing here in Brisbane and some parts of Melbourne, increased supply does affect prices. This increase in supply is also affecting rents, which are increasing very slowly in most markets.
A second reason is the increased investment in some cities, including in Sydney, on transport. Over time, this will increase the supply of well-located residential land, and this will help as well.
And a third reason is that at some point, interest rates in Australia will increase. To be clear, this is not a signal about the near-term outlook for interest rates in Australia but rather a reminder that over time we could expect interest rates to rise, not least because of global developments. Over recent years, the low interest rates in Australia have helped the economy adjust to the winding down of the mining investment boom. They have helped support employment and demand through a significant adjustment in the Australian economy. We should not, though, expect interest rates always to be this low.
It remains to be seen how the various influences on housing prices play out. Other policies, including tax and zoning policies, also have an effect. But increased supply and better transport could be expected to help address the ongoing rises in housing prices relative to incomes. These changes and some normalisation of interest rates over time might also reduce the incentive to borrow to invest in an asset whose price is rising strongly. To the extent that, over time, a better balance is established, we will be better off not incurring too much debt, and having housing prices go too high, while this is occurring.
I want to make it clear that the Reserve Bank does not have a target for the debt-to-income ratio or the ratio of nationwide housing prices to income.
As I spoke about earlier, there are good reasons why these ratios move over time. My judgement, though, is that, in the current environment, the resilience of our economy would be enhanced by an extended period in which housing prices and debt outstanding increased no faster than our incomes. Again, this is not a target or a policy objective of the Reserve Bank, but rather a general observation about how we build resilience.
Many of you will be aware that these issues have figured in the deliberations of the Reserve Bank Board for some time. This is entirely consistent with our flexible medium-term inflation targeting framework. With a medium-term target, it is appropriate that we pay attention to the resilience of our economy to future shocks. In the current environment of low income growth, faster growth in household debt is unlikely to help that resilience.
We have also been watching the labour market closely. The unemployment rate has moved up a little over recent months and wage growth remains subdued. Encouragingly, employment growth has been a bit stronger of late and the forward-looking indicators suggest ongoing growth in employment. We will want to see a continuation of these trends if the overall growth in the economy is to pick up as we expect. Stronger growth in incomes would of course also help people deal with the high levels of debt and housing prices. Overall, our latest forecast is for economic growth to pick up gradually and average around 3 per cent or so over the next few years.
To conclude, I hope these remarks help provide some insight into the Reserve Bank’s thinking about housing prices and household debt. As household balance sheets have changed, so too has the way that the economy works. Both from an individual and an economy-wide perspective, we need to pay attention to how the higher level of debt affects our resilience to future shocks.
The RBA said recently, when they released their credit aggregates to end March, that $51 billion of loans have been switched from investor to owner-occupier, with $1.2bn in March.
Following the introduction of an interest rate differential between housing loans to investors and owner-occupiers in mid-2015, a number of borrowers have changed the purpose of their existing loan; the net value of switching of loan purpose from investor to owner-occupier is estimated to have been $51 billion over the period of July 2015 to March 2017, of which $1.2 billion occurred in March 2017. These changes are reflected in the level of owner-occupier and investor credit outstanding. However, growth rates for these series have been adjusted to remove the effect of loan purpose changes.
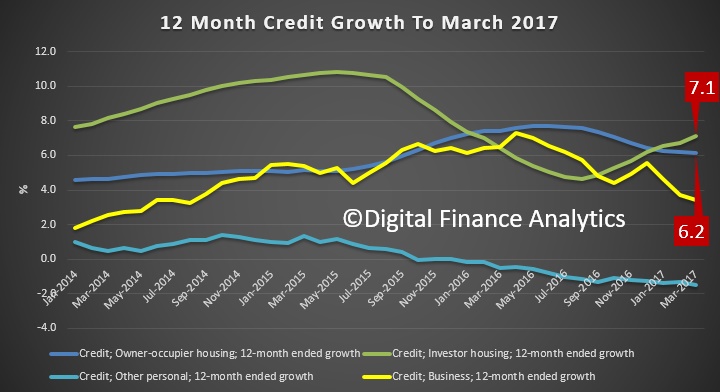
With the current balance of investor loans sitting at a record $577 billion, nearly 10% of the book has been switched to lower owner occupied rates. We of course cannot tell if this switching is legitimate, or opportunistic to get a lower interest rate and helpfully reduce the bank exposure to investor loans. The RBA data shows strong “corrected” investor growth of 7.1%, higher than owner occupied loans.
Responding to questions on notice from a Senate economic committee hearing, APRA said the switching “highlighted that some (lenders) have not had sufficiently robust practices” for monitoring the status of their borrowers and the data previously submitted to the regulator was “incorrect”.
APRA forced several banks to upgrade their reporting capabilities and, as a result, “some have strengthened their procedures”.
Tasmanian senator Peter Whish-Wilson, who asked APRA if its data was accurate, said the reclassification of loans was “concerning, whether it’s deliberate or not”.
He said: “I’d be loathe to see if any sort of systemic changes by the banks to loan classification were made to continue to grow loans to investors when it’s clear APRA is trying to crack down on what is potentially a very serious issue.”
The RBA released their May 2017 chart pack. We once again went straight to the household finances section, and as expected the debt to income ratio has deteriorated further. More debt means more stress, all else being equal. And with rates rising… etc … you know the rest!
At its meeting today, the Board decided to leave the cash rate unchanged at 1.50 per cent.
There has been a broad-based pick-up in the global economy since last year. Labour markets have tightened further in many countries and forecasts for global growth have been revised up. Above-trend growth is expected in a number of advanced economies, although uncertainties remain. In China, growth is being supported by increased spending on infrastructure and property construction, with the high level of debt continuing to present a medium-term risk. The improvement in the global economy has contributed to higher commodity prices, which are providing a significant boost to Australia’s national income. Australia’s terms of trade have increased, although some reversal of this is occurring.
Headline inflation rates have moved higher in most countries, partly reflecting the higher commodity prices. Core inflation remains low. Long-term bond yields are higher than last year, although in a historical context they remain low. Interest rates have increased in the United States and there is no longer an expectation of additional monetary easing in other major economies. Financial markets have been functioning effectively.
The Bank’s forecasts for the Australian economy are little changed. Growth is expected to increase gradually over the next couple of years to a little above 3 per cent. The economy is continuing its transition following the end of the mining investment boom, with the drag from the decline in mining investment coming to an end and exports of resources picking up. Growth in consumption is expected to remain moderate and broadly in line with incomes. Non-mining investment remains low as a share of GDP and a stronger pick-up would be welcome.
Indicators of the labour market remain mixed. The unemployment rate has moved a little higher over recent months, but employment growth has been a little stronger. The various forward-looking indicators still point to continued growth in employment over the period ahead. The unemployment rate is expected to decline gradually over time. Wage growth remains slow and this is likely to remain the case for a while yet.
The outlook continues to be supported by the low level of interest rates. Lenders have announced increases in mortgage rates, particularly those paid by investors and on interest-only loans. The depreciation of the exchange rate since 2013 has also assisted the economy in its transition following the mining investment boom. An appreciating exchange rate would complicate this adjustment.
Inflation picked up to above 2 per cent in the March quarter in line with the Bank’s expectations. In underlying terms, inflation is running at around 1¾ per cent, a little higher than last year. A gradual further increase in underlying inflation is expected as the economy strengthens.
Conditions in the housing market continue to vary considerably around the country. Prices have been rising briskly in some markets and declining in others. In the eastern capital cities, a considerable additional supply of apartments is scheduled to come on stream over the next couple of years. Rent increases are the slowest for two decades. Growth in housing debt has outpaced the slow growth in household incomes. The recently announced supervisory measures should help address the risks associated with high and rising levels of indebtedness.
Taking account of the available information, the Board judged that holding the stance of monetary policy unchanged at this meeting would be consistent with sustainable growth in the economy and achieving the inflation target over time.
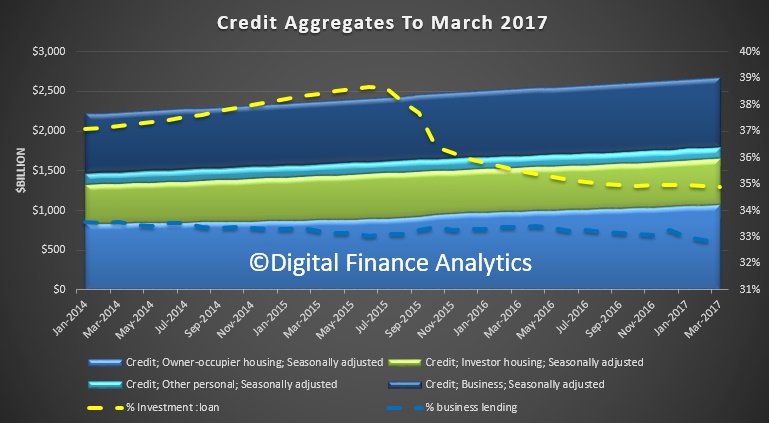
The latest data from the RBA, the credit aggregates, shows that loan growth was strongest for investment home loans, at an annualised rate of 7.1% compared with owner occupied loans at 6.2%. Business lending fell again, and personal credit continues to fall.
The proportion of lending to business fell to 32.8% (a record low) and the proportion of home lending for investors sat at 34.9%
Total credit grew $9.7 billion (up 0.4%), owner occupied lending rose $6.7 billion (up 0.6%), investment loans rose $2.5 billion (up 0.4%) and lending to business up $1 billion (up 0.1%).
However, the RBA adjusts these numbers to take account of $1.2 billion restatement between owner occupied and investment loans. Overall housing rose 6.5% in the past 12 months, way above income growth, so higher household debt once again.
Comparing the RBA and APRA data, it looks like the share of non-bank investor home lending is rising, and of course these lenders are not under the APRA regulatory control, but fall under ASIC (and they are not required to hold capital, as they are not ADIs). This is a loophole.
The RBA notes:
Following the introduction of an interest rate differential between housing loans to investors and owner-occupiers in mid-2015, a number of borrowers have changed the purpose of their existing loan; the net value of switching of loan purpose from investor to owner-occupier is estimated to have been $51 billion over the period of July 2015 to March 2017, of which $1.2 billion occurred in March 2017. These changes are reflected in the level of owner-occupier and investor credit outstanding. However, growth rates for these series have been adjusted to remove the effect of loan purpose changes.
A commodity-driven spike in Australia’s nominal GDP is putting the Reserve Bank of Australia under increased pressure to hike interest rates, says Nikko Asset Management.
Australia has seen strong growth in nominal GDP in the past year, thanks largely to the strong rally in commodities prices, according to Nikko Asset management fixed income portfolio manager Chris Rands.
The commodities rally is likely to continue for the next two quarters, Mr Rands said – but whether it continues longer than that will be down to Chinese demand.
Either way, the bright outlook for Australian economy over the next two quarters could potentially give rise to a more hawkish RBA than the market expects, he said.
Few economists are expecting the RBA to hike interest interest rates in the near future given the bank’s fears about further stoking domestic house prices.
But the sharp divergence between nominal GDP and the official cash rate (which have traditionally moved in lockstep) suggests it will be weighing on the RBA’s mind.
“In a strong nominal GDP environment, the RBA is typically either hiking rates or keeping them on hold,” said Mr Rands.
“Over the past five years, the cash rate has been moving in only one direction, and this new information could see the RBA taking a more hawkish tone than what the market is expecting,” he said.
The question for investors (and the RBA) is whether the rally in commodities that is driving nominal GDP growth is sustainable, Mr Rands said.
“If the commodity sector has been driven by Chinese fiscal expansion, this momentum could begin to run out during the second half of this year,” he said.
The RBA released their minutes today. Whilst there is mention of housing, there is not definitive evidence in the minutes to explain the RBA’s recent shift in sentiment as contained in the recent Financial Stability Report.
Indicators of household consumption had been a little weaker than expected in early 2017. The value of retail sales had fallen slightly in February, following average growth in January, and households’ perceptions of their personal finances had declined to below-average levels. Retail price inflation had remained subdued, partly because competition had remained strong across the retail sector. Members noted that utilities prices were expected to put some upward pressure on retail costs, but that retail rents had been flat – or rising very marginally at most – across the major cities.
Conditions in the established housing market had continued to vary significantly by region. Housing price growth had been strongest in detached housing markets in Sydney and Melbourne and some indicators for the established housing markets in these cities had picked up in the preceding couple of months. In contrast, housing market conditions in Perth had remained weak, although there were signs that prices there may be stabilising. Vacancy rates had been increasing, particularly in Perth. Strong growth in the supply of new apartments was continuing to drive a wedge between price growth for apartments and detached houses in Melbourne and Brisbane. Private residential building approvals had rebounded in February; the large pipeline of work to be done was expected to support dwelling investment over the subsequent year or two.
Growth in housing credit to owner-occupiers had moderated slightly over the preceding six months, while growth in housing credit to investors had increased, although investor loan approvals had declined in February. Most of the increase in lending to investors had occurred in New South Wales and Victoria, which was consistent with the pattern of housing market activity. Members observed that the growth of housing credit to investors had initially moderated in response to the announcement by the Australian Prudential Regulation Authority (APRA) of a 10 per cent benchmark for investor credit growth in late 2014. In addition, the share of lending with high loan-to-valuation ratios had fallen. However, growth in investor credit had increased steadily since early 2016, despite the fact that banks had tightened lending standards and, on average, increased the margin between interest rates on investor housing loans and those on loans to owner-occupiers.
Risks related to household debt and the housing market more generally had increased over the preceding six months. However, the nature of those risks differed across the country, according to the varying conditions and activity in local markets. Although credit to the household sector had been growing modestly relative to history, growth had been faster than income growth and the aggregate debt-to-income ratio for households had increased.
Nevertheless, indicators of financial stress in the household sector remained contained. Low interest rates and improved lending standards over recent years had been supporting households’ ability to service debt, and households on average had continued to build repayment buffers. Members noted, however, that some households with home loans appeared to have little or no buffer of excess mortgage repayments and could be vulnerable if household income were lower than expected. This observation emphasised the importance of realistic assessments of household expenses and prudent lending standards for mitigating risks to both financial stability and macroeconomic outcomes.
Members discussed the recent actions taken by APRA and the Australian Securities and Investments Commission to support prudent lending practices. These actions had been focused particularly on interest-only lending, serviceability assessments and responsible lending practices. APRA’s guidance had included limits on the share of interest-only loans in new housing loans and a requirement that banks impose strict limits on new interest-only lending at high loan-to-valuation ratios. Members recognised that the calibration of this guidance was not precise or straightforward. Developments needed to be kept under review and, depending on how the system responds to the various measures, members noted that the Council of Financial Regulators would consider further measures if needed.
Members observed that a number of factors make interest-only loans attractive in the Australian context. In particular, interest-only loans allow investors to take greatest advantage of particular features of the tax system, while the availability of offset accounts provides some owner-occupiers with opportunities to manage liquidity risks that might be associated with irregular income, for example.
Members noted that some banks had curtailed lending to some segments of the housing market, notably the Brisbane apartment market, where the supply of apartments was expected to increase significantly, raising the risks associated with oversupply. Reports of settlement failures had remained isolated. Members also noted the higher interest rates facing most investors, especially those with interest-only loans.
Developments in commercial property markets mirrored the geographic pattern seen in residential property markets. Conditions had been strengthening in Sydney and Melbourne but were weaker elsewhere. Valuations were generally high, however, and posed some risk to leveraged investors if prices were to decline sharply. Members were briefed on APRA’s recent review of commercial property lending. This review revealed some instances of weak underwriting standards and poor monitoring of risk profiles among lenders; several Australian banks had since tightened their lending standards.
Members observed that, in contrast to the growing risks faced by the household sector, vulnerabilities in the non-financial business sector remained low. Outside Western Australia, business failure rates had declined. Profitability had been supported by higher earnings for resource-related firms, following the increase in commodity prices. Gearing ratios and other measures of the strength of businesses’ balance sheets had generally been around their historical averages.
Conditions in housing markets continued to vary considerably across the country. The established markets in Sydney and Melbourne appeared to have strengthened further, but housing prices had continued to fall in Perth. The additional supply of apartments scheduled to come on stream over the subsequent couple of years in the eastern capital cities was expected to put some downward pressure on growth in apartment prices and rents, particularly in Brisbane.
Growth in housing credit continued to outpace growth in household incomes, suggesting that the risks associated with the housing market and household balance sheets had been rising. Recently announced supervisory measures were designed to help mitigate these risks by reinforcing prudent lending standards and ensuring that loan serviceability was appropriate for current conditions. Less reliance on interest-only housing loans was also expected to increase the resilience of household balance sheets. However, it would take some time to assess fully the effects of the recent pricing changes and the increased supervisory attention.
The Reserve Bank of Australia under governor Philip Lowe has backed the concerns of regulators about bank lending standards, seizing on the rising number of households who are a month away from missing a mortgage payment in his first major review of the financial system.
Dr Lowe has zeroed in on a rise in the percentage of households who have a buffer of less than one month’s mortgage payments, in contrast with the last review conducted under his predecessor which saw risks abating.
The RBA has put the spotlight firmly bank on the banks in its twice yearly report by noting “one-third of borrowers have either no accrued buffer or a buffer of less than one month’s payments”.
This latest study of the financial architecture adds more detail to the worrying picture emerging about the unbalanced housing market. It follows concerns from the Australian Securities and Investments Commission and the Australian Prudential Regulation Authority about a build up of risks and warnings from credit ratings agencies that the property market could face an orderly unwinding of prices.
The RBA also noted that these risks would have consequences for the banks themselves, pointing to the prospect of additional losses on mortgage portfolios for banks with exposures to the mining sector.
Significant pivot
The focus on households and the state of their balance sheets marks a significant pivot from the previous Financial Stability Review released one month before Dr Lowe was made governor and found that risks to households had lessened.
Founder of boutique research house Digital Finance Analytics Martin North said it was about time the Reserve Bank woke up to the risks posed by higher levels of household debt and stagnant incomes.
“This situation hasn’t fundamentally worsened in six months so it stands to reason what has changed is the RBA’s perception of the world,” Mr North said.
Statistics from Digital Finance Analytics show the percentage of Australian households that are cutting back expenditure, dipping into savings or using credit facilities to meet mortgage payments has risen to 22 per cent following a series of out-of-cycle rate rises from the banks.
Data published by the big four banks supports the warning from the RBA with anywhere between 20 and 40 per cent of big four bank mortgage holders just a misstep away from missing a mortgage payment.
ANZ and NAB, which measure the percentage of mortgage holders who do not have buffers of one month or more, count 61 per cent and 27.7 per cent of their customers respectively in the non-buffer bracket.
Commonwealth Bank and Westpac, which use a less stringent buffer measure to include any additional repayment and factor in offset accounts, put 23 per cent and 28 per cent of customers in the RBA’s danger zone.
Annual result data from the banks shows that the percentage of customers who do not have sufficient buffers have worsened by between 2 per cent and 3 per cent over the last 12 months alone.
The worsening position of households has been attributed to rising healthcare and energy costs combined with out-of-cycle rate rises and flat incomes.
Mr North noted that much of the data on households was predicated on the HILDA data which had a lag of several years.
“We have always had households that struggle to make mortgage payments,” Mr North said. “So the intriguing question for me is why have they woken up now? It could be that the governor has taken a different view on household debt.”
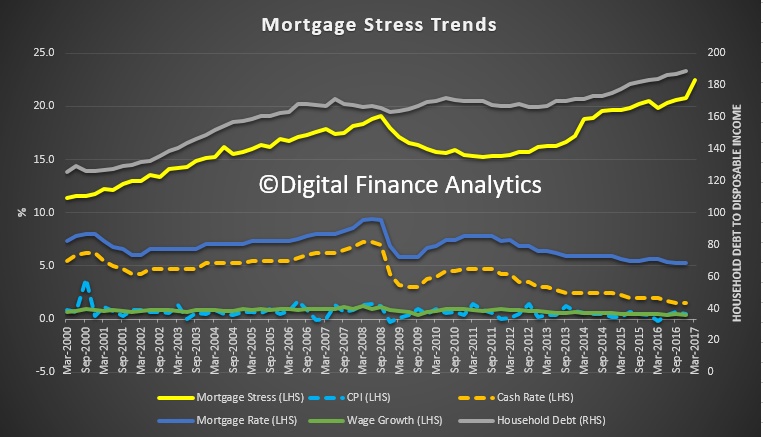
Today we take a longer term view of the rise of mortgage stress, which is driven by a combination of larger mortgages, flat incomes, higher living costs and rising debt.
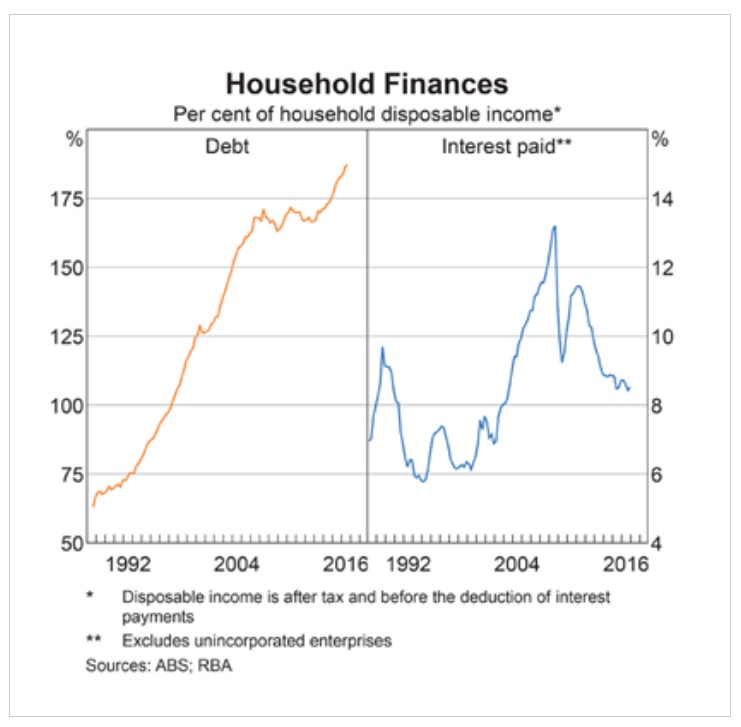
The first chart tracks household debt to disposable income from the RBA, as well as mortgage rates, the cash rate and both CPI and wage growth.
Stress levels rose consistently through the early 2000’s as debt and mortgage rates rose, to reach a peak of 19%, when the cash rate was 7.25%, the average variable mortgage rate was 9.35% and the household debt to disposable income sat at around 170. Those with a long memory may remember that we were warning about this trend in the 2000’s.
But then the GFC hit, rates were cut, and mortgages rates fell sharply to 5.8%. However the debt to disposable income ratio only fell a little to 168.
Lower rates stoked demand for property, so prices started to rise, and mortgage rates moved higher, then lower as the RBA used housing to try to fill the gap left by the mining sector moving into the production phases. Household debt to disposable income has since moved higher to a new high of 189 and is still rising.
During more recent times, mortgage stress and household debt has been moving up – and the latest stress data shows an acceleration as income growth all but stalls, and costs of living keep going, mortgage rates are rising.
To look at this in more detail, here is the same data, but with CPI and wage growth now mapped to stress and the cash rate. The fall in wage growth is significant, and this has now become one of the main drivers of stress.
My point is, nothing has suddenly changed. The inexorable rise in household debt, especially in a low wage growth scenario was obviously going to lead to issues (see our posts from 3 years back!) and so the RBA’s apparent volte-face is a welcome paradigm shift, but late to the party. Perhaps the New Governor had a different perspective from the previous incumbant!
One final point. In the recent Financial Stability report, the RBA used HILDA data to argue that household financial stress was not too bad. But the data is not that recent, latest from 2014 and 2015, and since then our surveys highlight that some more affluent households are also being squeezed, especially as mortgage rates rise, and their incomes stall; they are highly leveraged.
The HILDA Survey also includes questions on financial stress experienced by households over the previous year. There was a broad-based decline in the share of households experiencing episodes of financial stress between 2001 and 2015 (the time span available in the HILDA Survey). Nonetheless, households that were highly indebted in a particular year had a greater
propensity to experience financial stress. For instance, households that were highly indebted in 2002 were more likely to experience at least one incidence of financial stress in all other years compared with households that were less indebted in 2002 (Graph C5, right panel). The result also holds true for other cohorts. This suggests that a greater share of highly indebted households face financial difficulties and are more likely to be vulnerable to events that affect their ability to repay their debt, such as income declines or increases in interest rates.
Overall, these data highlight that highly indebted households can be more vulnerable to negative economic shocks and pose risks to financial stability. In particular, highly indebted households are less likely to be ahead of schedule on their mortgage repayments and they are more likely to experience financial stress, hence could be more vulnerable to adverse macroeconomic shocks. The consequent effects of this stress on the broader economy may be exacerbated by the disproportionately large share of investor housing debt owed by highly indebted households. Hightened investor demand can contribute to the amplification of the cycles in borrowing and housing prices, particularly when this investment is highly leveraged. Nonetheless, HILDA data also show that much of the debt held by highly indebted households is owed by households with high income and wealth, who are typically better placed to service larger amounts of debt.

“Instead, the issue we have focused on is the possibility of future sharp cuts in household spending because of stretched balance sheets.”

 Comparing the RBA and APRA data, it looks like the share of non-bank investor home lending is rising, and of course these lenders are not under the APRA regulatory control, but fall under ASIC (and they are not required to hold capital, as they are not ADIs). This is a loophole.

 To look at this in more detail, here is the same data, but with CPI and wage growth now mapped to stress and the cash rate. The fall in wage growth is significant, and this has now become one of the main drivers of stress.
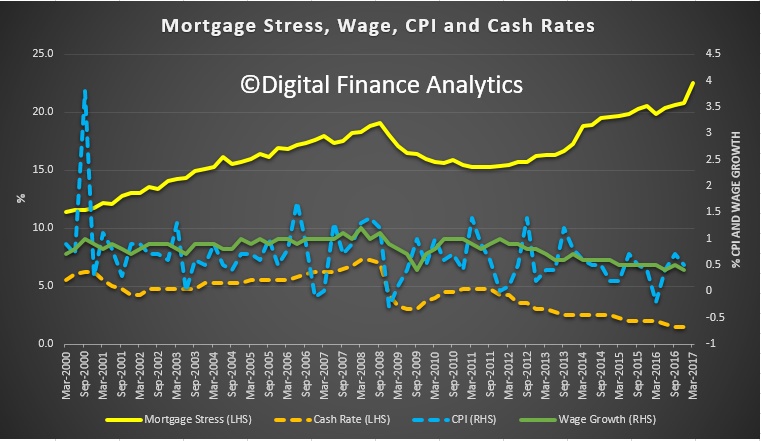 My point is, nothing has suddenly changed. The inexorable rise in household debt, especially in a low wage growth scenario was obviously going to lead to issues (see our posts from 3 years back!) and so the RBA’s apparent volte-face is a welcome paradigm shift, but late to the party. Perhaps the New Governor had a different perspective from the previous incumbant!
The HILDA Survey also includes questions on financial stress experienced by households over the previous year. There was a broad-based decline in the share of households experiencing episodes of financial stress between 2001 and 2015 (the time span available in the HILDA Survey). Nonetheless, households that were highly indebted in a particular year had a greater