The latest minutes from the December meeting reinforces the view that further rate cuts are not likely. They also mentioned the stronger property market, other than in WA.
In considering the stance of monetary policy, members discussed the policy decisions made throughout the easing phase since late 2011, during which the cash rate had been lowered in aggregate by 3¼ percentage points. The lower rates had helped support the economy in the transition following the mining investment boom and, more recently, had been in response to lower-than-expected inflation. Members discussed the effect of lower interest rates on asset prices and the decisions by households to borrow, particularly given the already high levels of household debt. Over recent years the Board had sought to balance the benefits of lower interest rates in supporting growth and achieving the inflation target with the potential risks to household balance sheets. Members recognised that this balance would need to be kept under review.
Turning to the policy decision for the December meeting, members noted that the international environment had been more positive in recent months, while observing that significant risks to the outlook for global activity persisted. The Chinese economy had remained resilient, supported by expansionary fiscal policy and rapid growth in financing. International financial markets had interpreted the outcome of the US election, specifically the implications for infrastructure spending, as being positive for growth and inflation in the United States. At the same time, there were increased expectations that the Federal Reserve would increase policy rates at the next meeting of the FOMC. Rising commodity prices had also contributed to an assessment that the outlook for global inflation was more balanced than it had been for some time, although inflation remained below most central banks’ targets.
Domestically, data that had become available over the previous month indicated that GDP growth in the September quarter was likely to be lower than the forecast at the time of the November Statement on Monetary Policy. Year-ended growth was expected to decline before picking up to be above potential later in the forecast period, supported by low interest rates and the lower exchange rate since 2013. Members noted that these factors had assisted the economy in its transition following the mining investment boom and that an appreciating exchange rate could complicate the adjustment. Falls in mining investment were expected to subtract less from GDP growth over time and resource exports were expected to continue to make a substantial contribution to growth.
There was still considerable uncertainty about the momentum in the labour market. The unemployment rate had declined over the past year, as had measures of excess capacity that accounted for the number of additional desired hours of work. Part-time employment had grown strongly over the previous year, but employment growth overall had slowed. Members noted that there was expected to be excess capacity in the labour market for some time, which was consistent with further indications of subdued labour cost pressures. This suggested that inflation would remain low for some time before returning to more normal levels.
Housing market conditions had strengthened overall over preceding months, although there was considerable variation across the country and between houses and apartments. Housing credit growth had picked up a little, particularly for investors. The supervisory measures that had strengthened lending standards in the housing market had led some lenders to take a more cautious attitude to lending in certain segments. At the same time, the increase in global bond yields had led some lenders to increase their rates on fixed-interest rate loans.
Taking into account the information that had become available over the previous month, and having eased monetary policy earlier in the year, the Board judged that holding the stance of policy unchanged would be consistent with sustainable growth in the economy and achieving the inflation target over time.
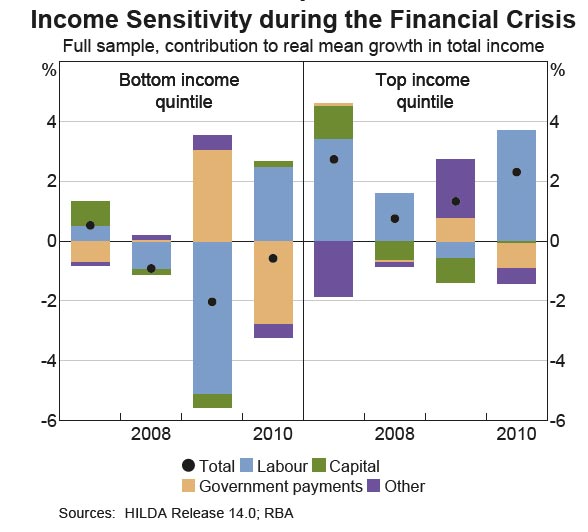
In the latest edition of the RBA Bulletin, released yesterday, there is a interesting segment on how the income of different individuals varies in response to changes in the state of the economy, using data from the HILDA survey.
Results suggest that the incomes of bottom- and top-income earners are the most sensitive to the state of the economy, although for different reasons: during strong economic conditions, the labour income of bottom-income earners rises, due to lower unemployment, while the capital income of top-income earners also rises, due to higher dividend and interest earnings. The effect on bottom-income earners appears to be stronger than that on top-income earners, suggesting that income inequality declines when economic conditions are strong.
Labour income is most sensitive at the bottom of the income distribution as those households are more exposed to unemployment and to adjustments in hours worked and/or wages. Capital income is responsive to GDP growth for those in the top and bottom income quintiles; however, capital income is much more sensitive for the top income quintile and is driven mainly by changing returns to financial assets.
These effects provide evidence for both a ‘labour income’ channel and a ‘capital income’ channel in Australia. The two channels have partly offsetting effects on inequality, but the response of labour incomes appear to have the stronger effect for Australia. This suggests that changes in economic conditions will have a more pronounced effect on bottom-income groups, which implies that stronger economic conditions tend to reduce income inequality in Australia, and vice versa.
The Reserve Bank has today published a consultation paper on dual-network debit cards and mobile wallet technology following discussion of these issues by the Payments System Board at its November meeting.
Dual-network debit cards are debit/ATM cards that allow transactions to be routed through two different networks. They offer convenience for cardholders and enhance the ability of merchants to encourage the use of lower-cost payment methods. Around two-thirds of the debit cards issued in Australia have dual-network functionality.
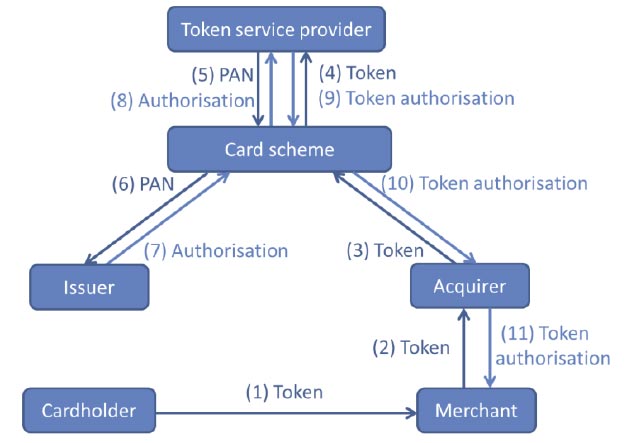
New technology has enabled mobile devices, such as mobile phones, to be used to make payments via an electronic representation of a payment card, as opposed to a traditional plastic card. The electronic representation of a card is typically contained in a ‘mobile wallet’, which is a software application on a mobile device that enables payments to be made through the card networks. This technology may offer greater convenience for cardholders as it avoids some of the physical limitations of carrying and using multiple plastic cards.
Some stakeholders have recently raised concerns about possible restrictions on competition in the mobile wallet sphere, specifically about conduct that may prevent or make it more difficult for both networks on a dual-network debit card to be enabled on a mobile device. This conduct could have the effect of reducing choice and convenience for cardholders in making mobile payments and reduce the ability of merchants to encourage the use of lower-cost payment methods. This consultation paper discusses these issues and raises a number of specific questions for consultation.
Interested parties are invited to make submissions on the consultation paper by 7 February 2017.
Questions for consultation:
1. What are the views of end-users (cardholders and merchants) regarding dual-network cards, including their use in mobile payments? Are there particular benefits that arise for end-users from having multiple payment networks available on a mobile device? What risks and costs might arise?
2. Are there any impediments or restrictions imposed (or planned or foreshadowed) by card schemes on the mobile wallet provisioning of competing networks on dual-network cards? If so, how significant are these and can they be justified on commercial or other grounds?
3. What are the likely effects – on competition and efficiency in the payments system, as well as more broadly – of the action of any scheme to prevent or discourage the mobile wallet provisioning of a competing network on a dual-network card? Are there benefits for end-users that arise from rules or policies that constrain the provisioning of an additional network on a device?
4. Do cardholders, issuers or others have views as to the feasibility of different possible ways of provisioning dual-network cards?
5. Under the existing voluntary undertakings to the Bank in place since August 2013 (see page 4), schemes have committed to some voluntary principles regarding dual-network cards. Have these principles been an effective response to the competitive issues that arose earlier? Have there been any issues in practice with the operation of these principles? Would an extension of these principles be an appropriate response to the current issues?
6. Are there any foreign precedents that are relevant for the consideration of these issues in Australia?
7. Are the issues raised relevant only to dual-network debit cards or are they also relevant to so-called ‘combo cards’ with credit functionality from one scheme and debit functionality from another?
8. Are there any prospective developments in payment card technology that may be relevant for the Bank as it considers these issues?
9. If the Bank were to contemplate a standard addressing conduct in this area, are there particular compliance costs that would arise for industry?
Dual-network (or ‘co-badged’) cards have attracted the attention of policymakers in a number of other jurisdictions – most notably the United States, Canada and the European Union, with different policy responses. In each case, however, the response has tended to focus on reducing costs to payments system end-users.
In the United States, Section 1075 of the 2010 Dodd-Frank Act, known as the Durbin Amendment, provided for a number of reforms to the debit card market with the intention of providing more competition in the market. One aspect, which came into effect in April 2012, has the effect of requiring that all debit cards be enabled on at least two unaffiliated networks. Networks must also not restrict or limit an issuer’s ability to contract with other networks.
In the European Union, the 2015 regulation on interchange fees makes specific reference to co-badged cards and their role in reducing the cost of payments. The regulation prevents card schemes from having rules that prevent issuers from including payments functionality of two or more networks on one card. It also requires that any scheme rules, routing principles or technical or security standards involving co-badged cards should be objectively justified and non-discriminatory. It specifies that the choice of payment application for transactions using co-badged cards should be made by users, not imposed by card schemes, issuers, acquirers or processing entities.
Individual countries within Europe have different structures with respect to card networks and mobile payments. For example: In Denmark, the domestic debit card system is Dankort; there are also co-badged ‘Visa Dankort’ debit cards. On co-badged cards, domestic transactions are routed via Dankort, while transactions made abroad are routed through the Visa network. In France, Carte Bancaire is the domestic (credit and debit) scheme, often co-badged with MasterCard or Visa, with the latter networks used typically for cross-border transactions and Carte Bancaire used for domestic purchases. In Canada, the Code of Conduct for the Credit and Debit Card Industry in Canada (‘the Code’) explicitly provides for dual-network cards but takes a different approach. It allows for non-competing, complementary domestic applications from different networks to exist on the same debit card but specifies that competing domestic applications from different networks cannot be offered on the same card. In practice, this means that domestic point-of-sale transactions made on co-branded debit cards are processed through one network, in particular the domestic Interac network, while other applications such as on-line payments and payments at foreign point-of-sale terminals may be processed through the other network on the card. Contactless payments are also processed via Interac (‘Interac Flash’ transactions). The Code also states that payment card networks must ensure that co-badged debit cards are equally branded. All representations of payment applets in a mobile wallet or mobile device, and the payment card network brands associated with them, must be clearly identifiable and equally prominent.
Cardholders in Canada are now able to provision non-competing domestic networks on dual-network cards for mobile use. Although there is no unifying precedent so far regarding how public policy will evolve regarding mobile payments and dual-network cards, many authorities recognise the benefits of competition among different schemes and have sought to avoid artificial restrictions on competition. A press release from the European Commission in June this year indicates its expectation that dual-network card functionality will be available in both physical and mobile forms.7 In particular, the Commission noted that under its new interchange fee regulation, consumers will be able to require their bank to co-badge a single card (or in the future their mobile phone) with any card brands that they issue to the consumer.
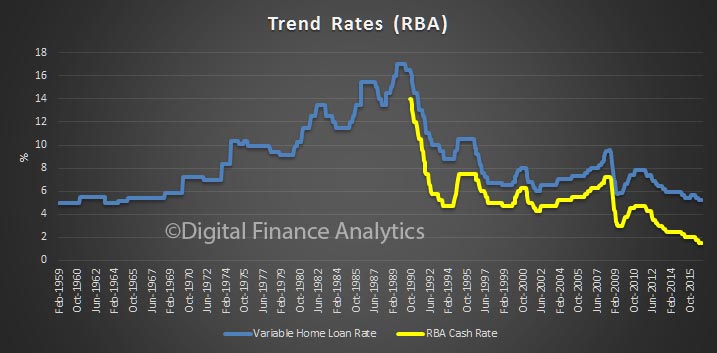
The latest RBA chart pack included the updated household debt to income ratio, which is higher again. This is a function of low income growth, and high debt, especially mortgages. Not pretty. Whilst low rates makes this manageable for many, the mortgage rate trend is likely to rise from here, putting more pressure on already stretched household budgets.
The Australian property market, overheated by ultra-low interest rates, faces a day of reckoning, senior economists have warned.
The Reserve Bank on Tuesday held the official cash rate at the historic low of 1.5 per cent, as expected. This marked the fourth consecutive month Australia’s central bank made no change to rates, since cutting them by 25 basis points in August.
The RBA should continue to sit on its hands for as long as possible, or risk further distortions, experts urged.
“It does look like there’s some big shakeouts about to occur in the financial markets,” Industry Super Australia chief economist Dr Stephen Anthony told The New Daily.
“I can’t tell you if it’ll happen this year, next year or the year after, but common sense says that things are very highly priced.”
Across the developed world, low rates have pushed investors into property, stocks and bonds, which drive up market prices but do little to fuel much-needed economic growth, Dr Anthony said.
“The RBA should just leave things where they are and sit back and use APRA and any other regulatory mechanism it can to slow price growth in Sydney and Melbourne.”
The widespread expectation is that the bank’s next movement will be up, given that the US Federal Reserve is likely to raise this month. But some, such as prominent economist Stephen Koukoulas, have urged further cuts.
Wednesday’s GDP figures may provide an argument for a cut next year. The result is expected to be soft, in the vicinity of 0.2 per cent for the September quarter. This would take annual growth to 2.5 per cent, missing the RBA’s forecast of about 3 per cent.
The RBA will also start 2017 with inflation at historically low levels, with little prospect that demand will recover quickly.
There are also plenty of global shocks in the making. Will Donald Trump help or hinder the world’s recovery? Will the defeat of the Italian referendum rock the country’s troubled banks?
Despite these challenges, cutting further would likely worsen the economic distortion, according to Dr Mark Crosby, a macroeconomist at Monash University.
“It’s always hard to call the top, but it’s definitely the case that there are risks being caused by these very low rates, especially in the Australian housing markets,” Dr Crosby told The New Daily.
“The point of low rates is to stimulate demand, but when that hasn’t happened and that liquidity goes elsewhere, that creates other problems, so yes there are definitely risks being built up, and that’s a worry for the Reserve Bank and other central banks, for sure.”
Even some experts connected to the Liberal Party think the property market is overheated.
Financial economist Christopher Joye, hired by Malcolm Turnbull at Goldman Sachs, and formerly an analyst at the Liberal-aligned Menzies Research Centre, said this week that properties are overvalued by about 25 per cent in Melbourne and Sydney, and that “mayhem” may be coming.
In fact, the anticipated ‘shakeout’ may have already begun, according to RMIT economist Dr Ashton De Silva, a housing market expert.
Prices in some parts of the market, such as off-the-plan apartments in Sydney and Melbourne, have already been hit, he said, with potentially worse to come.
“There are stories emerging where people are purchasing stuff off-the-plan, but then finding out when they actually take possession a couple of months or years later, the contract price is actually higher than the retail price,” Dr De Silva told The New Daily.
“My view is that there’s a very, very good chance that we’re going to see a significant correction in some dwelling types in some areas.”
At its meeting today, the Board decided to leave the cash rate unchanged at 1.50 per cent.
The global economy is continuing to grow, at a lower than average pace. Labour market conditions in the advanced economies have improved over the past year. Economic conditions in China have steadied, supported by growth in infrastructure and property construction, although medium-term risks to growth remain. Inflation remains below most central banks’ targets, although headline inflation rates have increased recently. Globally, the outlook for inflation is more balanced than it has been for some time.
Commodity prices have risen over the course of this year, reflecting both stronger demand and cut-backs in supply in some countries. The higher commodity prices have supported a rise in Australia’s terms of trade, although they remain much lower than they have been in recent years. The higher prices are providing a boost to national income.
Financial markets are functioning effectively. Government bond yields have risen further with the adjustment having been orderly. Funding costs for some borrowers have also risen, but remain low. Globally, monetary policy remains remarkably accommodative.
In Australia, the economy is continuing its transition following the mining investment boom. Some slowing in the year-ended growth rate is likely, before it picks up again. Further increases in exports of resources are expected as completed projects come on line. The outlook for business investment remains subdued, although measures of business sentiment remain above average.
Labour market indicators continue to be somewhat mixed. The unemployment rate has declined this year, although some measures of labour underutilisation are little changed. There continues to be considerable variation in employment outcomes across the country. Part-time employment has been growing strongly, but employment growth overall has slowed. The forward-looking indicators point to continued expansion in employment in the near term.
Inflation remains quite low. The continuing subdued growth in labour costs means that inflation is expected to remain low for some time, before returning to more normal levels.
Low interest rates have been supporting domestic demand and the lower exchange rate since 2013 has been helping the traded sector. Financial institutions are in a position to lend for worthwhile purposes. These factors are assisting the economy to make the necessary adjustments, though an appreciating exchange rate could complicate this.
Conditions in the housing market have strengthened overall, although they vary considerably around the country. In some markets, prices are rising briskly, while in others they are declining. Housing credit has picked up a little, although turnover of established dwellings is lower than it was a year ago. Supervisory measures have strengthened lending standards and some lenders are taking a more cautious attitude to lending in certain segments. Considerable supply of apartments is scheduled to come on stream over the next couple of years, particularly in the eastern capital cities. Growth in rents is the slowest for some decades.
Taking account of the available information, and having eased monetary policy earlier in the year, the Board judged that holding the stance of policy unchanged at this meeting would be consistent with sustainable growth in the economy and achieving the inflation target over time.
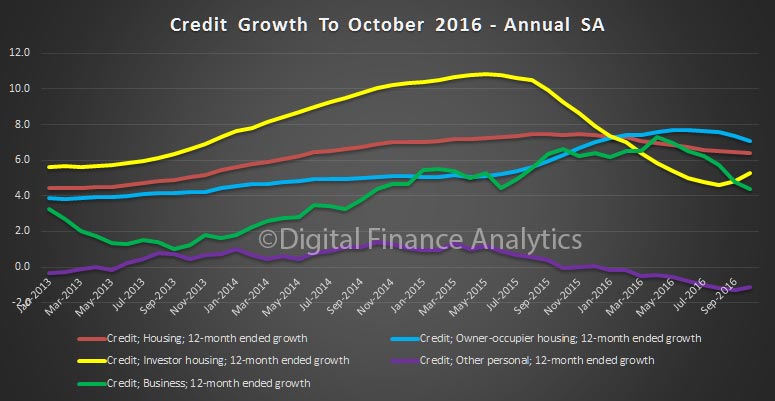
The RBA have released their Financial Aggregates for October 2016. Housing grew 0.6%, making an annual rate of 6.4%, still well above inflation. Personal finance was static, whilst business lending rose 0.5% making an annual rate of 4.4% (in original terms).
Looking at the seasonally adjusted data set, investment lending is growing at 5.3% and rising, owner occupied lending is 7.1% and falling, business lending is growing at 4.4% and falling, and other personal finance is down 1.1%. Investment lending is the only element to rise.
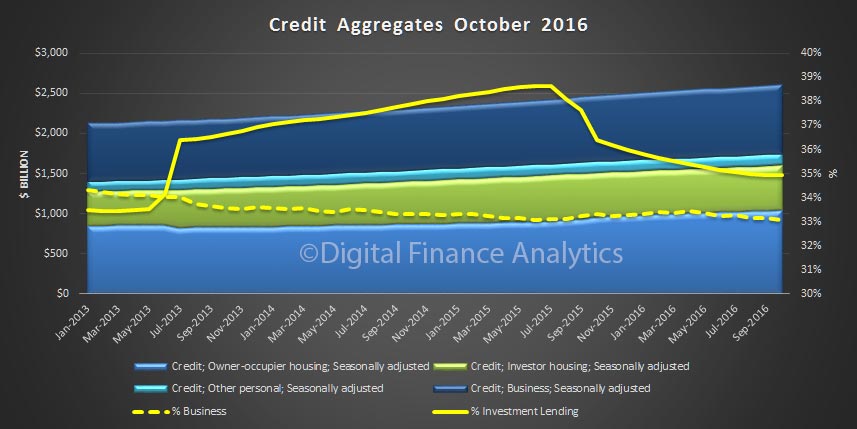
Looking at the detailed data, seasonally adjusted, owner occupied lending rose 0.54% in the month, by $6.6 billion, to $1.04 trillion, investment lending rose 0.59%, by $3.3 billion to $560 billion, and business lending rose 0.27%, by $2.3 billion to $864 billion.
We see therefore a fall in the relative share of lending to business, compared with housing, and the momentum in investment housing stronger than owner occupied housing. Both signs of trouble ahead. Investment lending is 35% of all housing, and business lending 33% of all banking lending.
There were further adjustments to loan classification in the month, just to confuse further. The RBA said:
Following the introduction of an interest rate differential between housing loans to investors and owner-occupiers in mid-2015, a number of borrowers have changed the purpose of their existing loan; the net value of switching of loan purpose from investor to owner-occupier is estimated to have been $46 billion over the period of July 2015 to October 2016, of which $0.8 billion occurred in October 2016. These changes are reflected in the level of owner-occupier and investor credit outstanding. However, growth rates for these series have been adjusted to remove the effect of loan purpose changes.
The RBA’s Christopher Kent, Assistant Governor (Economic) highlighted the economic variations across states in Australia. He makes the point that in a country as large and diverse as Australia, the behaviour of the economy as a whole often misses important differences across the country.
A key reason for the differences across the states over recent years has been the effect of the large declines in mining investment and commodity prices. These have contributed to weaker economic conditions in the mining states and, therefore, weighed on economic conditions nationally. But those forces are waning; indeed, the terms of trade have even risen of late. Hence, there are reasonable prospects for stronger growth of nominal demand in the mining states and, by extension, for the economy overall. That would contribute to a rise in domestic inflationary pressures and a gradual return of inflation to more normal levels.
A close examination of the differences across the states can shed some light on the outlook for the Australian economy.
The modest growth of non-mining business investment over recent years masks the stronger growth in some parts of the country and declines in others.
The weakness in full-time employment nationally over the past few years owes much to the subdued demand for labour in the mining states.
Housing market conditions are far from uniform. Prices are falling in Perth after a ramp up in supply combined with a fall in population growth. Meanwhile, Melbourne is seeing stronger population inflows, perhaps benefiting from strong growth of supply for some years and lower prices than in Sydney.
Housing price growth has picked up in Sydney and Melbourne, where auction clearance rates have increased to high levels. In addition, loan approvals to investors have increased over recent months.
In contrast to Sydney and Melbourne, housing market conditions remain subdued in Perth. Prices of apartments and detached dwellings there have declined further and are around 8 per cent below the peak. Rents in Perth have also declined by about the same amount. Those changes are consistent with the weakening in general economic conditions in Western Australia. Moreover, as the graph above shows, population growth in Western Australia has declined significantly since the peak of mining investment in 2012. And yet the full extent of the decline in population growth may not have been readily appreciated by buyers and builders of housing. That would be consistent with the fact that building approvals in Western Australia actually picked up noticeably from 2012 and did not peak until 2014, which was also about the same time that housing prices and rents reached a peak in Perth. This meant that the housing supply was still ramping up at the same time that population growth was declining. This is apparent in the following graph, which shows the growth in the number of people in each of the large states relative to the number of new dwellings completed at that time . The ‘dashes’ show the average number of people per household from the various censuses.
In Western Australia, this ratio has fallen sharply to about one additional person in the state per new dwelling completion. That’s well below the average number of inhabitants per dwelling. In other words, there are a lot of dwellings being completed relative to the needs of the slower growing populace. That is consistent with the sharp rise in vacancy rates in Perth and the adjustment to rents and housing prices. It also suggests that dwelling construction and construction employment are likely to remain subdued for some time. That is having a knock-on effect to other industries linked to the property market. These linkages are one way in which the decline in the resource sector has been extended and amplified through to other parts of the economy.
These are a few examples of how the experiences of the different states and industries can provide useful insights into the behaviour of the overall economy. The Bank puts time and resources into understanding these sorts of differences across regions and industries. We examine a range of publicly available data and build on that knowledge through our extensive liaison program. While the Bank sets monetary policy for the nation, an appreciation of the different parts gives us more confidence about our understanding of the behaviour of the whole.
RBA’s Chris Aylmer spoke at the Australian Securitisation Conference entitled “Towards a more Transparent Securitisation Market“. He highlighted the significantly lower volume of mortgage backed securitisation written since the GFC, thanks to changed funding dynamics and lenders. In addition, using RBA’s securitisation dataset which contains information from around 50 sponsors and 270 trusts on around 1,100 securities and covers around 2 million loans; he highlighted portfolio LVR and default data. Finally, he discussed the need to improve data quality further for the future.
Recent Developments
The Australian securitisation market experienced a gradual recovery following the global financial crisis, spurred initially by support from the Australian Office of Financial Management (AOFM) and demand from authorised deposit-taking institutions (ADIs, namely banks, building societies and credit unions) (Graph 1). However, issuance remains well below pre-crisis levels.
Graph 1
Residential mortgage-backed securities (RMBS) continue to form the largest part of the market, although there has been a notable reduction in issuance this year. Commercial mortgage-backed securities (CMBS) comprise only a tiny fraction of issuance, while other asset-backed securities (ABS) issuance is also quite small.
The stock of marketed securitisations outstanding is a little above $100 billion, compared with a peak of about $250 billion in 2007 (Graph 2).
Graph 2
The decline in RMBS issuance this year has been driven by a significant reduction in issuance by banks (Graph 3). This reflects, among other things, less favourable conditions than in the senior unsecured wholesale debt market where banks have been able to issue in size and for longer maturities. The treatment of encumbered assets in the net-stable funding ratio also favours the issuance of senior unsecured debt over RMBS.
Graph 3
Consistent with the reduced presence of banks in the asset-backed market, the share of conforming RMBS issuance has declined. In fact, over the past year non-conforming RMBS, which are mainly issued by non-bank mortgage originators, have accounted for about a quarter of total RMBS issuance, compared to a post-crisis average of around 5 per cent. Non-conforming RMBS have also become larger, with some recent issues being between $700 and $800 million – larger than any other non-conforming deal since 2007.
As noted previously, pricing on RMBS issuance has become somewhat less favourable relative to other sources of funding (Graph 4). Average primary market spreads on banks’ conforming AAA rated RMBS rose markedly in early 2016, from around 100 basis points to around 150 basis points. While these spreads have recently come down a little, they remain higher than is usually the case relative to spreads on the major banks’ unsecured Australian dollar-denominated bonds.
Graph 4
Before the crisis, typically around 40-60 per cent of ABS issuance was offshore. Since then, offshore issuance has been much smaller, and averaged around 4 per cent over the period 2012 to 2016. Some of this foreign demand may have been sated by covered bonds, the majority of which have been issued offshore. There is currently about $100 billion of covered bonds outstanding.
The investor base for Australian ABS has continued to evolve (Graph 5). Holdings of marketed ABS by ADIs have decreased a little over the past year or so, though they still remain high by historical standards, while there has been a pick-up in demand from real money investors.
Graph 5
The Securitisation Dataset
Our understanding of developments in the securitisation market has been enhanced by the individual deal data that we are now receiving, and in particular the de-identified loan-level data. For RMBS, these data include: 62 fields related specifically to the loan, such as loan balances, interest rates and arrears measures; 18 fields related to the borrower, such as borrower income and employment type; and 13 fields that detail the collateral underpinning the mortgage, including the postcode and property valuation. Useful new information includes data on offset balances and borrower income at origination. In addition, issuers are required to provide a working cash-flow waterfall model of the security which provides useful information about structural aspects of ABS.
The dataset contains information from around 50 sponsors and 270 trusts on around 1,100 securities (Table 1). It covers around 2 million loans, the majority of which are residential mortgages, or around one-third of mortgages outstanding.
Table 1: Asset-backed Securities in the New Securitisation Dataset Number
Sponsors(a)
Trusts
Securities
Loans
Total
RBA eligible
‘000(b)
Marketed RMBS
30
195
860
367
366
Of which:
– ADI
21
145
514
256
311
– Non-ADI
9
50
346
111
55
Non-marketed RMBS(c)
40
49
107
—
1,400
CMBS
2
3
23
5
1
Other ABS
7
26
127
24
407
Total
54
273
1,117
—
2,174
(a) Sponsors organise a securitisation transaction to sell or transfer receivables (such as loans) that they originated or acquired; the categories do not add to total because some sponsors are involved in multiple categories
(b) The categories do not add to total due to rounding
(c) Self-securitisations; these require a related-party exemption to be eligible for repo with the RBA
Source: RBA
As noted previously, the primary purpose for the RBA collecting these data is to allow it to manage its actual and contingent exposure to these securities. The RBA has accepted certain asset-backed securities as part of its regular market operations since 2007, and there are now nearly 400 eligible, marketed asset-backed securities that the RBA accepts under repurchase agreements (repo). While the RBA only accepts the AAA rated tranches in repo transactions and insists that these securities not have structural features or triggers that are particularly complex or unusual, they still have a wide range of features that make understanding the structure of the securities important. The assets underpinning them also range from household and commercial mortgages, through to auto loans and credit card receivables.
While we require these data to be collected for our own risk management purposes, the RBA also sees merit in the information on marketed securities being made available more broadly, in the interests of enhanced market transparency. Therefore, as part of our eligibility requirements for accepting certain marketed securitisations as collateral, we require issuers to make a significant share of the data they provide to us available more broadly to investors and other permitted data users.
The RBA also needs to understand non-marketed securitisations (known as self-securitisations) because these are potentially a significant share of the collateral used in our standing facilities. The Committed Liquidity Facility (CLF) is a large contingent liability for the RBA. It is used by ADIs to meet their liquidity requirements under the liquidity coverage ratio. The CLF enables participating ADIs to access a pre-specified amount of liquidity from the Reserve Bank by entering into repurchase agreements of eligible securities outside of our normal market operations. The current size of the CLF is $245 billion.
The self-securitisations are also used to cover payment settlements that occur outside business hours under the RBA’s ‘open repo’ arrangements. These arrangements, which permit banks to convert these securities to exchange settlement balances at the RBA, will become increasingly important as we move to the new payments platform (NPP) in late 2017. From this time more payment settlements will be occurring outside business hours, including over the weekend.
So what can we see in the data?
Debt securities
On the liabilities side, we have a wealth of information about the structure of each ABS. The main liabilities of a securitisation are the issued notes, which may be structured quite differently across deals. For example, RMBS marketed by the ADIs tend to have very simple structures, commonly one large senior note with relatively little subordination (Graph 6). In contrast, the RMBS structures issued by non-ADI mortgage lenders typically require a larger amount of subordination in order for the senior tranches to obtain a AAA rating, as the loan pools typically have a larger share of non-conforming loans. Another common feature of non-ADI deals is the large number of subordinated tranches.
Graph 6
The structure of different securitisations may change over time. This reflects the operation of each trust’s cash-flow waterfalls, which determine the linkages between the assets, the trust support features and the liabilities. The waterfalls specify the precise rules for the ordering of cash allocations in each period of the trust’s lifetime. As noted previously, the ordering and linkages within the cash-flow waterfalls permit a better understanding of the risk characteristics of individual deals.
These models of the cash flows allow us to monitor the performance of a deal and observe how it performs under a range of scenarios, including stress scenarios. For example, one risk associated with RMBS is prepayment risk, as mortgagees have the option to pay back their loans ahead of schedule. We can now observe how note balances and credit support evolve under different prepayment rates (Graph 7). In this case, a higher prepayment rate results in the principal outstanding on the senior notes being paid down faster; it also leads to higher credit enhancement sooner.
Graph 7
How each securitisation addresses mismatches between assets and liabilities and, in particular, the role of various support facilities such as those that provide the trust with liquidity, or mitigate its interest rate risk, is explicit in the data. Each deal will have several facilities, which may be provided by a number of different parties and potentially by a counterparty presenting the security as collateral to the RBA. This is particularly important for the RBA because of its relevance to how we mitigate ‘wrong way’ risk – that is, the risk that our exposure to a counterparty increases as the credit quality of that counterparty declines. To deal with this, additional repo haircuts are applied if the counterparty is ‘related’ to the asset-backed security presented to the RBA.
Loan-level information
The source of the cash flows needed to support the trust’s liabilities is the underlying asset pool. The new securitisation dataset provides important information on the quality of the underlying assets, by providing a detailed description of the associated collateral, borrowers and loan contracts. The loan-level data contain static information determined at origination (such as the type of collateral and its geographical location) and data that changes over time (such as the loan balances, loan-to-valuation ratio and arrears rates).
Features of the underlying assets can vary considerably across securitisations (Graph 8). The loans underpinning both the major bank and non-ADI securitisations shown here are geographically diversified across states, with the non-ADI deal a little underweight in NSW and overweight in Victoria relative to those states’ shares of the Australian population. At the same time, the non-ADI deal is more heavily concentrated in postcodes that are more distant from the centre of the capital cities than the major bank securitisation (Graph 9).
Graph 8
Graph 9
The interest rates paid by borrowers can also differ markedly across deals in the market, reflecting the considerable variation in characteristics of borrowers and lenders (Graph 10). Consistent with a loan pool comprising a higher share of non-conforming loans and self-employed borrowers, almost all loans backing the non-ADI deal shown here pay higher interest rates than those in the major bank deal (although again there is considerable variation across individual ADI and non-ADI deals).
Graph 10
It is also possible to monitor the quality of a security’s underlying assets over time (Graph 11). For example, at origination, a large share of the loans in these two deals had loan-to-valuation ratios (LVRs) close to 80 per cent, although the non-ADI deal had fewer loans with LVRs above this threshold. But now that the loans have aged, more recent data show that the LVRs are less concentrated as some of the loans have been paid down over time (although the data may not capture changes in valuations). The smaller shift in the distribution of the non-ADI deal could reflect a higher share of interest-only loans and/or a difference in the loan seasoning between the two portfolios, for example.
Graph 11
We are also able to analyse the distribution of arrears rates for securitised residential mortgages across Australia. Graph 12 shows that mortgage arrears are highest in Western Australia and Queensland, and in non-metropolitan regions, particularly those near mining operations.
Graph 12
The next steps for the RBA will be to develop an internal collateral pool model using, for example, credit risk models that take into account characteristics such as geographic concentrations, delinquencies and loan-to-value ratios.
Areas for Further Development
So what have we observed about the quality of the data, and where to from here?
The first point that I would make is that the data quality is generally good, though there is still scope to improve the accuracy, consistency and completeness of the data.
There is little consistency in reporting around credit scores and debt serviceability metrics. The RBA does not currently require this information to be made available to users of the data, but did flag last year that it would review this requirement once the information was collected. The RBA’s assessment is that because issuers are using very different measures and these metrics are currently being reported for only around half or three quarters of loans depending on the measure, publication would do little to enhance transparency at this stage. This will remain a ‘work-in-progress’ for the time being.
To improve data quality further, the RBA has continued to roll out more validation rules. To date, these rules have targeted the most critical fields for eligibility and the calculation of haircuts, ensuring that the information is complete and within plausible ranges. The rules also check for the completeness and internal consistency of the data. These checks will become increasingly sophisticated, focusing in particular on ensuring that the data evolve in a consistent manner over time.
The feedback that we have received from investors and other market participants is that, to date, the process for gaining access to the data is cumbersome, particularly the need to sign access deeds. With this in mind the ASF has recently released a new standard framework for loan-level data disclosure. The framework is a recommended minimum standard for industry participants when providing and receiving loan-level data for RMBS. The primary purpose of the framework is to mitigate certain risks, but particularly those relating to privacy where sponsors have to manage the risk around the possible re-identification of data.
There is more interest in the new data from buyers of lower-rated tranches, but this has not yet opened up a new investor base as investors have tended to rely on existing means of access to the relevant information. Better access arrangements would promote greater interest in the data from a wider investor base. It would also assist in the monitoring of deals so that investors can satisfy themselves that they are receiving the correct cash flows.
As I mentioned earlier, one of the RBA’s requirements for ABS to be considered repo eligible is that a large proportion of the new dataset (including summary stratification tables) be made available to the public. We will shortly be surveying information providers to see how this requirement is being met. Of particular interest is how users are accessing the securitisation data, how many requests have been received, the type of data request and take-up by investors and other permitted users.
The RBA is also planning to align the deadline for reporting to the RBA with the date that investor reports are due. This would remove the current mismatch and allow the RBA and other permitted users to price and assess the credit risk of these securities more accurately, and in a more timely manner.
In the interest of transparency, the RBA is now publishing information on our website about the progress of applications for securities to be considered eligible for the RBA’s market operations. This information includes details of securities that have been made ineligible because the ongoing reporting requirements have not been met.
In the past two days we have seen a couple of important changes of direction from the RBA relating to housing and household debt.
First, in the minutes of the meeting held on Melbourne Cup day, they acknowledge that assessing conditions in the housing market had become more complicated. “While overall conditions had eased relative to 2015, some indicators had strengthened over the previous few months. In particular, housing price growth had picked up noticeably in Sydney and Melbourne. However, housing turnover and growth in housing credit both remained lower than a year earlier, consistent with the supervisory measures that had been taken to tighten lending standards and the more cautious attitude to lending in certain segments. In addition, a considerable supply of apartments is scheduled to come on stream over the next few years, particularly in the eastern capital cities, and growth in rents in the September quarter was the slowest for some decades”.
Last night the Governor his address said that some households are being more cautious, and not using their houses like ATMs as much as in the early 2000’s. He says “this more prudent behaviour is a positive development but given the high and rising levels of debt, though, we need to watch things carefully. It is important that we avoid a build-up of financial imbalances in household balance sheets. We can never know with certainty exactly what level of debt is sustainable. It depends on income growth, lending standards and asset prices. But it surely must be the case that the higher is the debt, the greater is the risk. Given this, as I said recently when explaining our monetary policy decisions, it is unlikely to be in the public interest, given current projections for the economy, to encourage a noticeable rise in household indebtedness, even if doing so might encourage slightly faster consumption growth in the short term”.
Household debt is high on any measure as we have frequently discussed and this was intentional RBA policy to offset the fading momentum from the mining sector. Household income is growing but slowly, so are under pressure from large mortgage commitments. But now with commodity prices a little higher, it is time to ratchet back growth in household debt. As we discussed before the next move in interest rates on mortgages is likely to be up.
But the key question is how to get businesses to investment in growth. As the RBA noted recently, many companies still have very high internal rates of return for investment hurdle assessments, and we noted growth in business lending is slow relative to home lending.
The risk weightings for business lending, under Basel III are significantly higher than for mortgage lending, so the banks can spread their capital further and leverage more by lending to households for home purchase.
So, the issue for the RBA and other policy makers is how to tilt the playing field to encourage business activity and lending. Lower cash rates will make no difference, but perhaps thought should be given to other incentives to encourage business investment.