Philip Lowe RBA Governor spoke about the Australian economy tonight. He included (finally) some comments about household debt. He said it surely must be the case that the higher the debt, the greater is the risk. It is unlikely to be in the public interest, given current projections for the economy, to encourage a noticeable rise in household indebtedness, even if doing so might encourage slightly faster consumption growth in the short term. This is an important policy shift in my book! It may lead to tighter lending controls, and a slowing in home lending growth.
To provide some context I would like to begin with two observations.
The first is that Australia’s economic success over recent decades reflects both the underlying fundamentals and our ability to ride out various shocks. The fundamentals that have helped us are well known. They include our openness to trade and investment, our generally favourable demographics, our diverse and talented people, our abundance of natural resources, our ability to undertake structural reform to boost productivity and our links with the fast-growing Asian region. But also important to our prosperity is the fact that over the past quarter of a century, our economy has not been seriously derailed by economic shocks. After all, nothing undermines prosperity like a severe recession in which large numbers of people lose their jobs and see their wealth decline.
It is not as if there has been a shortage of shocks that could have derailed us. There was the Asian crisis, the bust of the US tech boom and the global financial crisis. We also experienced a once in a century surge in our terms of trade and the subsequent decline.
The point is that we have been able to ride out these and other shocks without too much difficulty. In part this is because of the flexibility of our exchange rate, monetary policy and the labour market. We have also avoided the build-up of large financial imbalances. But this resilience is also because when the shocks hit we have had buffers to absorb them. Because of these buffers, we had options that not all other countries have had.
The second observation is that today many business people tell us they feel the heavy weight of uncertainty. The long list of factors we hear includes: uncertainty about the transition in the Chinese economy; the future direction of technology; the political environment, both abroad and at home; the impact of high debt levels on future consumer demand; and uncertainty about where the extraordinary global monetary expansion will ultimately end. Understandably, when people feel uncertain, they sometimes feel that it’s best to delay making decisions, especially if those decisions are difficult to reverse. We want to seek out more information before proceeding. We want to wait.
So, to draw these two observations together: Australians have managed pretty well over the past quarter of a century, but we feel a bit uncertain about the future.
In my view, despite the uncertainties, we should still be looking forward to the future with some optimism. Here in Australia, with our long track record of good economic growth and our demonstrated ability to adjust to a changing world, we have a set of advantages that not all countries have. Our collective challenge is to capitalise on those advantages. Ensuring a strong focus on lifting productivity is surely the key here.
As we work out how to do this, though, we obviously can’t ignore the uncertainties. But neither can we let those uncertainties force us to retreat, to withdraw from the world. If we do this, then we, and our children, will be poorer as a result. Rather, we need to deal with, and prepare for, those uncertainties. This brings me back to the title of my remarks, ‘Buffers and Options’. Part of our preparation is to ensure that we have adequate buffers in place to deal with future shocks wherever they come from. These buffers provide us with options when challenges arise.
I would like to talk about buffers in three broad areas: the financial system, the fiscal arena and household finances.
Financial System
One area where it is particularly important to have adequate buffers is in the financial sector. The financial sector can either act as a cushion for adverse shocks or it can act as an amplifier. Which one it turns out to be depends upon how well the system is prepared to deal with bad events. If the system has skimped on liquidity and is carrying too little capital, then it is likely to amplify shocks. Conversely, if the financial system has adequate buffers, it is better able to support the economy in difficult times.
The aftermath of the global financial crisis is a good example of what can happen. This chart (Graph 1) shows how bank lending has grown – or in the case of Europe, contracted – since the financial crisis in 2008. Many banks in Europe and the United States simply did not have large enough buffers for the events that unfolded. Even today, capital levels remain an issue for some European banks. Insufficient capital means that some banks are constrained in their ability to provide finance and helps explain why banks have not taken advantage of the European Central Bank’s offer to lend them money at an interest rate below zero. The European economy has suffered as a result. In the United States, the picture is more positive, partly because there were more successful efforts early on to rebuild the buffers in the system.
Graph 1
In Australia, it has been a different story. The banking system did have the capacity to support the economy during the global crisis, although it is important to point out that it did this with the assistance of the Australian Government through various guarantee schemes following the freezing of global capital markets.
Around the world, the experience of recent years has rightly caused banks and their regulators to think again about how large the buffers should be. And the answer has been that they should be larger than they were before. This has been true in Australia too, despite the starting point here being better than in many other countries.
Since the beginning of 2015, the major banks have raised around $28 billion from new equity and retained earnings, significantly increasing their capital relative to their assets (Graph 2). Banks are also holding a larger share of their assets in liquid form and have changed the composition of their funding towards more stable sources (Graph 3). During 2016, liquid assets have accounted for around 20 per cent of the major Australian banks’ total assets, up from an average of around 15 per cent in the years preceding the financial crisis. Banks have also increased their use of deposits and long-term debt and reduced their use of short-term debt.
Graph 2
Graph 3
These are positive developments and they provide us with an extra degree of insurance against future shocks.
Of course, this insurance does not come for free. Higher capital, more liquidity and more expensive, stable funding all have a price. We need to keep an eye out to make sure that this price is not too high and that we don’t constrain the ability of the financial system to do its job. My view is that this has not been the case in Australia and that the changes have increased the resilience of our system.
There is, though, a legitimate discussion to be held as to who pays the price. We see this issue frequently debated in our media. One possibility is that the cost falls on the bank shareholders in the form of lower returns on equity. Another is that it falls on borrowers in the form of higher interest rates on bank loans relative to the cash rate.
Ultimately, the balance is for the market to sort out, but it would seem unlikely that the cost will fall entirely on one side or the other. Over time, shareholders and borrowers will both benefit from these larger buffers to the extent that they contribute to economic stability. The shareholders should experience less volatile returns and borrowers should be more likely to be supported during difficult times. The larger buffers provide a form of insurance to all.
Fiscal Arena
A second area where buffers are important is on the fiscal front.
Again, the events of the past decade provide a useful illustration.
In Europe, we saw examples of what can happen when public finances are not in order when difficult times strike. In some countries, when troubles arrived, governments felt that they had little choice other than to impose austerity measures to restore the fiscal accounts, despite the fact that these measures added to the immediate downturn in the economy.
Australia, again, provides a counter example. When the shockwaves of the global financial crisis hit us, the Australian Government did have the capacity to support the economy through a fiscal expansion. This support was one of a number of factors that helped us get through this period. The ability to provide the stimulus was enhanced by the sound fiscal position that had been built up over previous years (Graph 4). While the exact nature of the stimulus remains a matter of debate, regardless of where you stand on that debate the fiscal buffers that we had did provide us with options that not all other countries had.
Graph 4
Since the financial crisis in 2008, the budget has been in deficit and debt levels have moved higher. Under current projections, net debt is expected to peak in 2017/18 at 19.2 per cent of GDP and a balanced budget is not expected until 2020/21. This would still leave the fiscal accounts in better order than those in many other countries. Importantly, this means that fiscal policy still retains capacity to support the economy in difficult times. But this capacity is less than it once was. We have a smaller buffer than we once did and a smaller buffer means fewer options.
So from a risk-management perspective, there is merit in rebuilding our buffers on the fiscal front. This is a task that can be undertaken over time and it requires difficult choices to be made. As Secretary to the Treasury John Fraser reminded us in a recent speech, the task is made more difficult by slow growth in nominal income.[1] But it is important that we ensure our public finances are on a sustainable track. This requires a better balance to be established, over time, between recurrent spending and revenue. It is worth pointing out that this does not preclude government spending on infrastructure, where this is backed by a strong business case. Such spending can provide support for the economy and can help generate the productive assets that a prosperous economy needs. Done well, infrastructure spending is not inconsistent with establishing a better balance between recurrent spending and revenue.
Household Finances
The third set of buffers that I would like to talk about are those in household balance sheets.
These buffers too are important as they influence how households respond to difficult economic times. Ideally, in such times, people are able to draw on their savings a bit, and perhaps even access credit, so that they don’t have to cut their consumption sharply. Of course they can do this only if their balance sheets are in reasonable shape.
Again, overseas experience is relevant here. In the United States when the recession hit in 2008 some households found that they had simply borrowed too much. What followed was a period of defaults by some, less new borrowing and faster repayment of some debt. The result was a more severe downturn and a more protracted recovery than otherwise would have occurred.
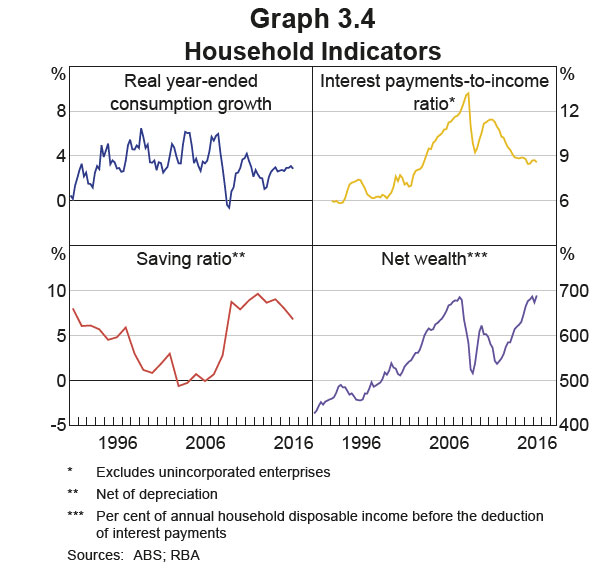
Given this and other experiences, we need to pay close attention to household balance sheets here in Australia too. Debt levels, relative to income, are high in Australia and are much higher than they once were (Graph 5). Currently, household debt is equivalent to 185 per cent of annual household disposable income, a record high and up from around 70 per cent in the early 1990s. If we net off the household sector’s holdings of cash and deposits the pattern looks somewhat different. It is important, though, to recognise that the households with the debt typically are not the same ones with the large deposits.
Graph 5
The reasons for the large increase in household debt have been well documented. The lower nominal interest rates that followed lower inflation in the 1990s allowed people to borrow more, as did the liberalisation of the financial system. As a nation, we took advantage of these new opportunities to borrow. As a result, we ended up with both higher levels of debt and higher housing prices.
Given the low level of interest rates and ongoing employment growth, most households are managing the higher levels of debt, but many feel that they are closer to their borrowing capacity than they once were and have adjusted their behaviour accordingly. Since the financial crisis, there has been a noticeable increase in the household saving rate. We are not using our houses like ATMs in the way that we were in the decade to the mid 2000s. Gone are the days when higher housing prices were a sign that we should go to the bank and borrow more to spend.
One illustration of this change in behaviour is the large increase in balances held in mortgage offset accounts and redraw facilities. In aggregate, households now have balances in these accounts equivalent to 17 per cent of total outstanding housing loans, which is a buffer worth 2½ years of scheduled repayments at current interest rates (Graph 6). From the survey data we look at, we can see that over recent years more households in all income brackets have got ahead on their mortgages (Graph 7).
Graph 6
Graph 7
This more prudent behaviour is a positive development. Given the high and rising levels of debt, though, we need to watch things carefully. It is important that we avoid a build-up of financial imbalances in household balance sheets. We can never know with certainty exactly what level of debt is sustainable. It depends on income growth, lending standards and asset prices. But it surely must be the case that the higher is the debt, the greater is the risk. Given this, as I said recently when explaining our monetary policy decisions, it is unlikely to be in the public interest, given current projections for the economy, to encourage a noticeable rise in household indebtedness, even if doing so might encourage slightly faster consumption growth in the short term.
Conclusion
So in each of the three areas I have talked about this evening – the financial sector, the fiscal arena and household balance sheets – the story is broadly similar. Stronger buffers give us more options. And more options promote stability and prosperity. If we skimp on the buffers then we expose ourselves to more risk.
It is true that building these buffers does not come for free. In the financial sector, it might mean lower returns on equity or higher lending margins. In the fiscal arena, it means difficult trade-offs about recurrent spending and taxation. And in the household sector, it means consumption growth is slower for a time than it might otherwise be. But this is the nature of insurance. You pay a premium for protection against future uncertainties and to provide resilience. Of course, we need to make sure that this premium is not too high. But it is surely better to pay the insurance premium when the sun is shining than when the storm clouds are building or, worse still, to seek insurance when it is too late.
I am very conscious that this evening I have spoken a lot about providing resilience against future shocks. Before finishing, I want to point out that I am doing so not because we are predicting difficult times ahead. The Reserve Bank’s central scenario for the Australian economy remains a relatively positive one.
Instead, my focus tonight probably reflects the inherent cautiousness of a central banker. Just as the past 25 years have seen numerous shocks to the global economy, chances are, so too will the next 25 years. In the past, we have been served well by the economy’s flexibility and the buffers that we had. Being realistic, we will probably need these buffers again some time in the years ahead.
At the moment, though, our economy is adjusting better than many predicted to the unwinding of the mining investment boom. Over the next year, we are expecting the economy to grow at around its potential rate, before picking up a bit in the following year. We also expect some further modest progress in lowering unemployment, although spare capacity remains.
The low interest rates are helping to support the economy. And the decline in the exchange rate over recent years has assisted a number of industries. Survey measures of business conditions and consumer confidence generally remain above average. The prices for our commodity exports have also lifted since the start of 2016. As a result, for the first time in some years, Australia’s terms of trade have moved higher. This will help to boost incomes and fiscal revenues.
Inflation remains low, but the latest reading did not suggest that it was moving lower still. There remain reasonable prospects that inflation will return to around average levels over the next couple of years.
Finally, to repeat an earlier point, despite the uncertainty in the world, we should be looking forward to the future with some optimism. Australians can continue to enjoy a level of prosperity enjoyed by relatively few people around the world. We have a strong set of fundamentals and a demonstrated ability to adjust to a changing world. We should also take some comfort that our system retains buffers against future shocks. Strengthening these buffers makes sense in the uncertain world in which we live.
Members noted that assessing conditions in the housing market had become more complicated. While overall conditions had eased relative to 2015, some indicators had strengthened over the previous few months. In particular, housing price growth had picked up noticeably in Sydney and Melbourne. However, housing turnover and growth in housing credit both remained lower than a year earlier, consistent with the supervisory measures that had been taken to tighten lending standards and the more cautious attitude to lending in certain segments. In addition, a considerable supply of apartments is scheduled to come on stream over the next few years, particularly in the eastern capital cities, and growth in rents in the September quarter was the slowest for some decades.
Of note is their bank funding costs comment:
There had been little change to bank deposit rates in October, with the exception of some reversals of previous increases in term deposit rates by the major banks. The cost of banks’ funding sourced from wholesale debt markets had declined by almost 20 basis points since the August cash rate reduction and was expected to decline further as the cost of new issuance remained below the cost of outstanding debt. There had been little change to housing or business lending rates in October.
This may change now, given recent ructions on the international scene, post Trump.
We need measures of residential property price inflation. They need to identify bubbles, the factors that drive them, instruments that contain them, and analyse their relation to recessions. Such measures are also needed for the System of National Accounts and may be needed as part of the measurement of owner-occupied housing in a consumer price index. So, timely, comparable, proper measurement is a prerequisite for all of this, driven by concomitant data.
Critical to price index measurement is the need to compare, in successive periods, transaction prices of like-with-like representative goods and services. Price index measurement for consumer, producer, and export and import price indexes (CPI, PPI and XMPIs) largely rely on the matched-models method. The detailed specification of one or more representative brand is selected as a high-volume seller in an outlet, for example a single 330 ml. can of regular Coca Cola, and its price recorded. The outlet is then revisited in subsequent months and the price of the self-same item recorded and a geometric average of its price and those of similar such specifications in other outlets form the building blocks of a price index such as the CPI. There may be problems of temporarily missing prices, quality change, say size of can or sold as a bundled part of an offer if bought in bulk, but essentially the price of like is compared with like every month. RPPIs are much harder to measure.
First, there are no transaction prices every month/quarter on the same property. RPPIs have to be compiled from infrequent transactions on heterogeneous properties. A higher (lower) proportion of more expensive houses sold in one quarter should not manifest itself as a measured price increase (decrease). There is a need in measurement to control for changes in the quality of houses sold, a non-trivial task.
The main methods of quality adjustment are (i) hedonic regressions; (ii) use of repeat sales data only; (iii) mix-adjustment by weighting detailed relatively homogeneous strata; and (iv) the sales price appraisal ratio (SPAR). The method selected depends on the database used. There needs to be details of salient price-determining characteristics for hedonic regressions, a relatively large sample of transactions for repeat sales, and good quality appraisal information for SPAR. In the US, for example, price comparisons of repeat sales are mainly used, akin to the like-with-like comparisons of the matched models method, Shiller (1991). There may be bias from not taking full account of depreciation and refurbishment between sales and selectivity bias in only using repeat sales and excluding new home purchases and homes purchased only once. However, the use of repeat sales does not require data on quality characteristics and controls for some immeasurable characteristics that are difficult to effectively include in hedonic regressions, such as a desirable or otherwise view from the property.
The problem of source data
Second, the data sources are generally secondary sources that are not tailor-made by the national statistical offices (NSIs), but collected by third parties, including the land registry/notaries, lenders, realtors (estate agents), and builders. The adequacy of these sources to a large extent depends on a country’s institutional and financial arrangements for purchasing a house and varies between countries in terms of timeliness, coverage (type, vintage, and geographical), price (asking, completion, transaction), method of quality-mix adjustment (repeat sales, hedonic regression, SPAR, square meter) and reliability; pros and cons will vary within and between countries. In the short-medium run users may be dependent on series that have grown up to publicize institutions, such as lenders and realtors, as well as to inform users. Metadata from private organizations may be far from satisfactory.
We stress that our concern here is with measuring RPPIs for FSIs and macroeconomic analysis where the transaction price, that includes structures and land, is of interest. However, for the purpose of national accounts and analysis based thereon, such as productivity, there is a need to both separate the price changes of land from structures and undertake adjustments to price changes due to any quality change on the structures, including depreciation. This is far more complex since separate data on land and structures is not available when a transaction of a property takes place. Diewert, de Haan, and Hendriks (2011) and Diewert and Shimizu (2013a) tackle this difficult problem.
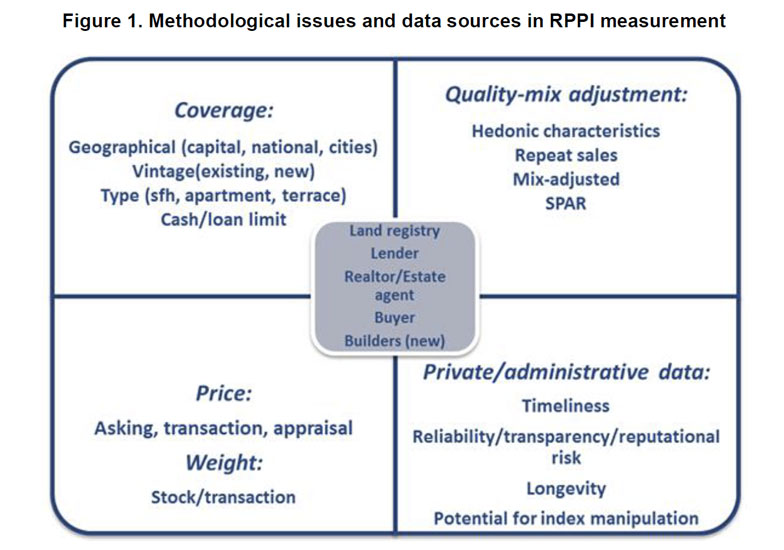
Figure 1 shows alternative data sources in its center and coverage, methods for adjusting for quality mix, nature of the price, and reliability in the four quadrants. Land registry data, for example, may have an excellent coverage of transaction prices, but have relatively few quality characteristics for an effective use of hedonic regressions, not be timely, and have a poor reputation. Lender data may have a biased coverage to certain regions, types of loans, exclude cash sales, have “completion” (of loan) price that may differ from transaction price, but have data on characteristics for hedonic quality adjustment. Realtor data may have good coverage, aside from new houses, data on characteristics for hedonic quality adjustment, but use asking prices rather than transaction prices.
The importance of distinguishing between asking and transaction prices will vary between countries as the length of time between asking and transaction varies with the institutional arrangements for buying and selling a house and the economic cycle of a country.
Whether measurement matters
A natural question is whether the differences in source data and methodologies used matters to the overall outcome of the index. Silver (2015) undertook an extensive formal analysis based on the RPPIs and, as explanatory variables, the associated methodological and source data for 157 RPPIs from 2005:Q1 to 2010:Q1 from 24 countries. The resulting panel data had fixed-time and fixed-country effects; the estimated coefficients on the explanatory measurement variables were first held fixed and then relaxed to be time varying. Subsequently, the explanatory variables were interacted with the country dummies.
The rest of the paper examines, consolidates, and provides improved practical methods for the timely estimation of hedonic RPPIs, though, as noted earlier, the proposed methods apply equally to CPPIs. Hedonic regressions are the main mechanism recommended for and used by countries for a crucial aspect of RPPI estimation—preventing changes in the quality-mix of properties transacted translating to price changes.
RPPIs and CPPIs are hard to measure. Houses, never mind commercial properties, are infrequently traded and heterogeneous. Average house prices may increase over time, but this may in part be due to a change in the quality-mix of the houses transacted; for example, more 4-bedroom houses in a better (more expensive) post-code transacted in the current period compared with the previous or some distant reference period would bias upwards a measure of change in average prices. A purpose and crucial challenge of RPPIs and CPPIs is to prevent changes in the quality-mix of properties transacted translating to measured price changes. The need is to measure constant-quality property price changes and while there are alternative approaches, the concern of this paper is with the hedonic approach as a recommended widely used methodology for this.
Note: IMF Working Papers describe research in progress by the author(s) and are published to elicit comments and to encourage debate. The views expressed in IMF Working Papers are those of the author(s) and do not necessarily represent the views of the IMF, its Executive Board, or IMF management.
The latest RBA Statement of Monetary Policy, released today includes a range of comments on housing, and mortgage lending. Clearly the RBA wants to continue to show there is nothing to see here. High absolute household debt and rising defaults hardly gets a mention! They also choose to use the APM home price data rather than CoreLogic’s indices (which would show higher growth). They say the average outstanding housing interest rate has fallen by around 35 basis points this year.
However, they do warn that if growth in housing demand does not continue to keep pace with the scheduled large increases in supply, it would place downward pressure on housing prices and rents and increase the risk of off-the-plan apartment purchases failing to settle.
They also warn that if the broader housing market was to weaken substantially, consumption growth may be lower than currently expected in response to wealth and income effects. Consumer price inflation would also be affected as housing costs comprise a significant share of household expenditure.
As expected, private dwelling investment was strong over the year to the June quarter. The value of residential building approvals has reached record levels as a share of GDP and the amount of work in the pipeline has edged higher. Accordingly, dwelling investment is likely to contribute to growth for some time yet. However, the large amount of work in the pipeline raises concerns that some locations could become oversupplied, particularly in inner-city areas where a lot of highdensity housing is planned. This could lead to settlement failures by off-the-plan purchasers and a general reduction in rents and prices.
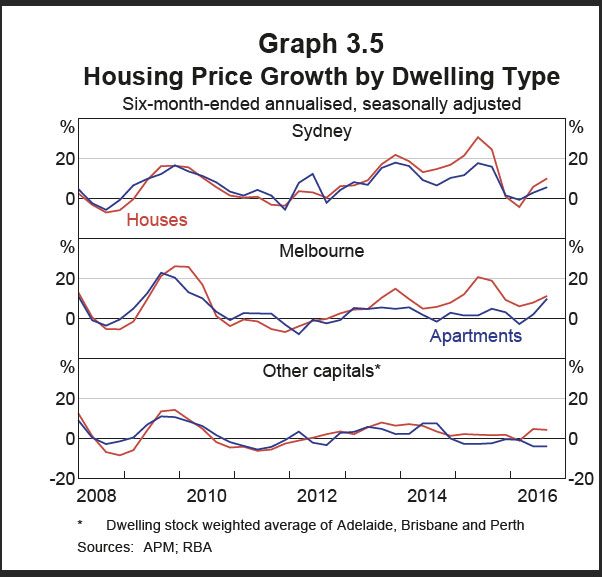
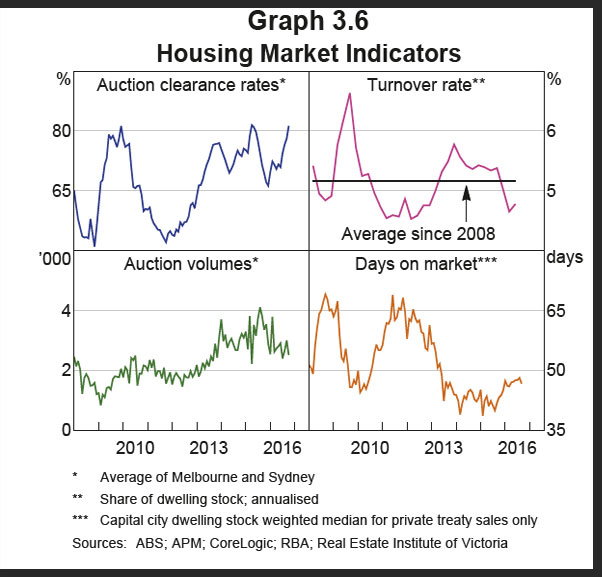
Conditions in the established housing market have eased relative to a year ago, although some indicators suggest that conditions may have strengthened over recent months. In particular, housing price growth has picked up noticeably in Sydney and Melbourne, where auction clearance rates have also increased to high levels.
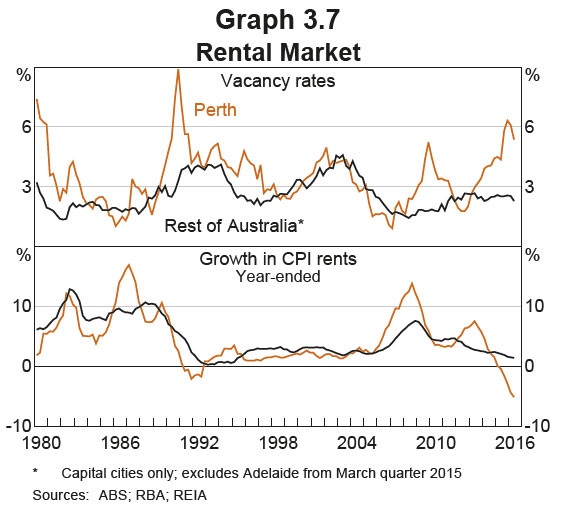
However, the number of auctions and housing market turnover more generally are lower than they were last year and properties are, on average, taking longer to sell. While housing credit growth has also declined over the past year, loan approvals data suggest that lending to investors has increased a little over recent months. Housing market conditions remain weak in Perth, where prices of both apartments and detached dwellings have declined further over the past year.
Housing credit growth has eased to an annualised pace of around 6 per cent. Growth in net housing debt is about 1 percentage point below growth in housing credit due to ongoing strong growth in deposits in mortgage offset accounts.
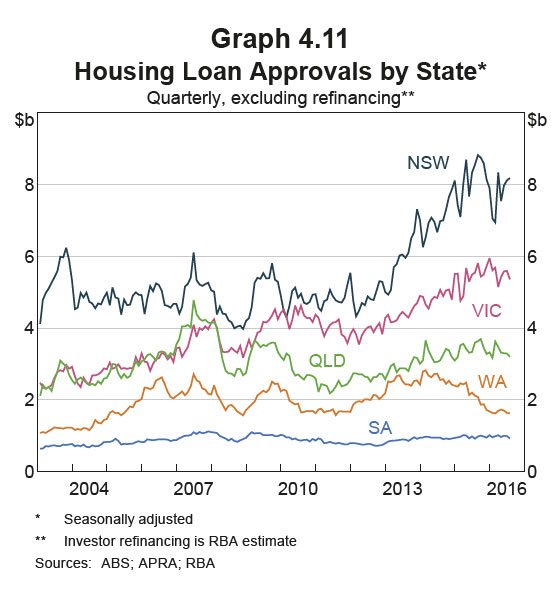
While the slowing in housing credit growth and loan approvals has been reasonably broad based, there remains some divergence in the pace of growth across states (Graph 4.11). The slowing in loan approvals has been particularly pronounced in Western Australia; while loan approvals in NSW have also eased over the past year, they continue at a pace noticeably above the national average.
Growth in credit advanced to investors has increased a little in recent months, consistent with a pick-up in investor housing loan approvals. In contrast, growth in credit advanced to owner-occupiers has eased a little recently. The current level of approvals is consistent with housing credit growth continuing at around its current pace.
The slowing in housing loan approvals over the past year is consistent with the decline in turnover in the housing market. It also reflects slower growth in average dwelling prices and a decrease in the average loan-to-valuation ratio. The latter follows the introduction of measures by the Australian Prudential Regulation Authority (APRA) to strengthen lending standards. Another factor that may be contributing to the easing in housing credit growth over the past year is an increase in the share of off-the-plan purchases, which are yet to flow through to the demand for credit. These transactions do not involve a mortgage at the time the dwelling is purchased off the plan, but add to the stock of housing credit when a mortgage is provided to the purchaser upon completion of the dwelling.
Around half of the August cash rate reduction was passed through to most advertised housing lending rates. The average outstanding housing interest rate has fallen by around 35 basis points this year and is likely to decline a little further as maturing loans are replaced with loans on lower The lowest available variable interest rates are more than 50 basis points below the average outstanding interest rate and, reflecting the lower rates on offer, the level of refinancing activity remains relatively high. One bank has recently introduced a loan product with the interest rate margin fixed at 249 basis points above the cash rate.
Recent strength in dwelling investment, particularly the construction of higher-density dwellings, has played a role in supporting the rebalancing of economic activity away from the resources sector.
Low interest rates and increases in housing prices have encouraged a substantial increase in the supply of apartments and the pipeline of residential work yet to be done has increased to historically high levels. While this pipeline should support growth in dwelling investment over the next year or so, the outlook for dwelling investment beyond this period is uncertain.
There is concern about the risk of an oversupply of apartments in specific geographical areas, such as inner-city areas of Melbourne and Brisbane. Outside Western Australia, the supply of housing has to date largely been absorbed by population growth. However, if growth in housing demand does not continue to keep pace with the scheduled large increases in supply, it would place downward pressure on housing prices and rents and increase the risk of off-the-plan apartment purchases failing to settle. If the broader housing market was to weaken substantially, consumption growth may be lower than currently expected in response to wealth and income effects. Consumer price inflation would also be affected as housing costs comprise a significant share of household expenditure.
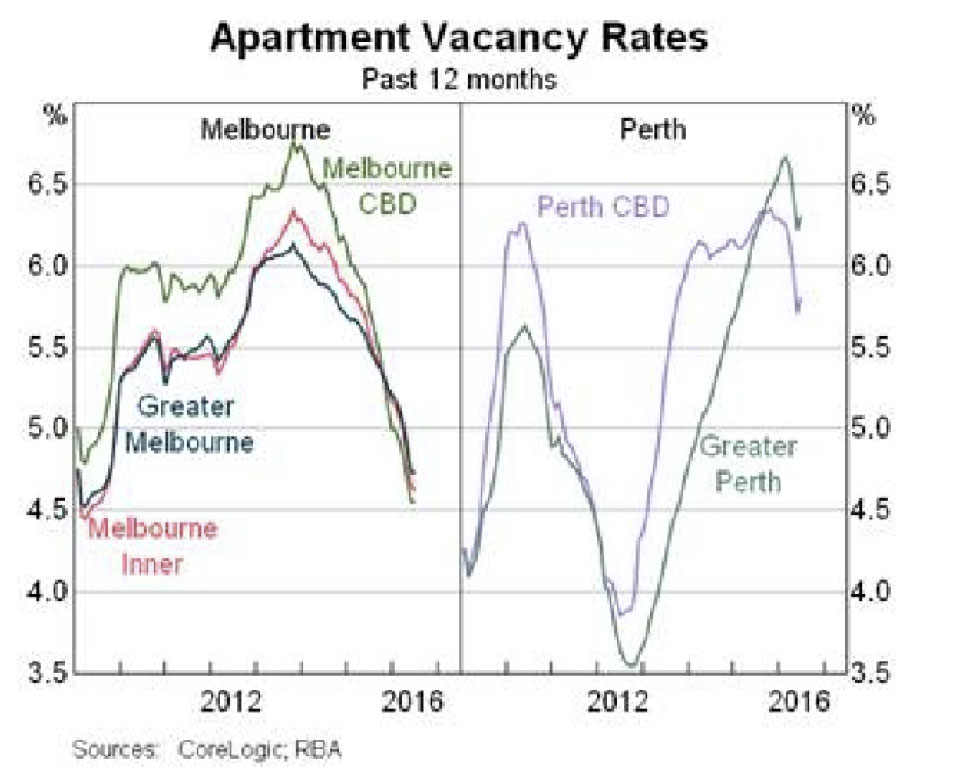
The RBA has release an FOI response relating to documents created since 1 July 2015 containing information on Australian metropolitan apartment vacancy rates.
They say that a first look at the data indicates that the large additions to supply may be weighing on the apartment markets in inner-city Brisbane and Melbourne. It also highlights the strength of current conditions in the Sydney apartment market, whereas Perth and areas heavily exposed to the mining industry are experiencing some weakness in housing markets
The substantial volume of apartment construction currently taking place across Australia has been concentrated in Sydney, Melbourne and Brisbane. The large amount of expected apartment completions over the coming years has led to concerns around potential oversupply, particularly in the inner-city areas of Brisbane and Melbourne. By number, these 3 city’s CBDs are forecast to have the largest amount of apartment completions over the coming two years As a share of the existing stock, the new forecast supply in Brisbane CBD will increase the dwelling stock in that area by 25 per cent. Adjacent areas to the Brisbane CBD, such as Brisbane Inner – North, and Holland Park – Yeronga are also forecast to have substantial increases in supply.
In Melbourne, the total number of new units is estimated at over 16 000 over the next two years, well above the forecast increase in other areas and as in Brisbane, neighbouring areas such as Port Phillip are also expected to have large numbers of new units.
Liaison suggests developers will increasingly offer rental guarantees as apartment supply increases (as a way of securing investor sales) and will be quick to adjust rents in response to vacancies. This raises the risk that a ‘flight to quality’ will translate to the broader apartment market over time through softer demand for older low quality, low amenity apartments.
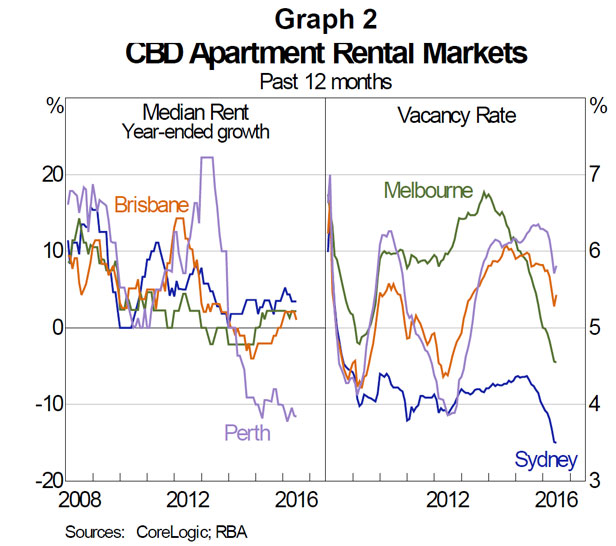
In Sydney, the areas forecast to have large numbers of new units are more geographically dispersed and the proportional increase to the dwelling stock is generally smaller than for Melbourne and Brisbane. The dataset provides information about market conditions at a more granular level. For example, CBD apartment market conditions differ markedly across cities; the weakness in the Perth economy has led to sizeable declines in apartment values and rents as well as elevated vacancy rates, Brisbane and Melbourne’s apartment market conditions are subdued, while Sydney’s remains strong.
For Greater Sydney, expected apartment completions are higher than in the other capital cities. But oversupply is less of a concern, because this expected supply forms a lower share of the dwelling stock and is relatively spread out across the inner and middle suburbs. For those areas within Sydney forecast to experience larger increases in supply relative to the existing dwelling stock, (such as Strathfield – Burwood – Ashfield, Parramatta, Ryde – Hunters Hill and Auburn), there is little sign that oversupply concerns are weighing on these areas, with both value and rental growth remaining relatively strong However, in Melbourne and Brisbane, value growth in areas with the largest amount of expected completions (such as Melbourne City and Brisbane Inner) is relatively weak.
In Darwin, the housing market faces major headwinds as population growth slows. Contacts reported that high-density housing is oversupplied after years of strong building activity, which has led to falls in rents and prices and a rise in vacancy rates. High-rise construction has fallen significantly and building companies have had to adapt by rapidly shedding staff.
Apartment vacancy rates are already the highest of any capital city and residential rents have fallen considerably “white collar” workers – such as in engineering and design – do rent apartments. These highly-paid workers are either leaving now or have already left, which could partially explain the high vacancy rates already in Darwin. The decrease in accommodation costs resulted in Darwin’s CPI growth falling to around 0 per cent in year-ended terms in June 2016.
In the latest edition of the RBA’s Chart Pack, we get an update of household finances to end October 2016. The debt to income ratio rose again, from 186 in June 2016, reinforcing the piles of debt household have. A record. How will this all get repaid given the current low levels of income growth? Whilst low interest rates mean repayments are manageable at the moment, this will change if rates rise.
At its meeting today, the Board decided to leave the cash rate unchanged at 1.50 per cent.
The global economy is continuing to grow, at a lower than average pace. Labour market conditions in the advanced economies have improved over the past year, but growth in global industrial production and trade remains subdued. Economic conditions in China have steadied recently, supported by growth in infrastructure and property construction, although medium-term risks to growth remain. Inflation remains below most central banks’ targets.
Commodity prices have risen over recent months, following the very substantial declines over the past few years. The higher commodity prices have supported a rise in Australia’s terms of trade, although they remain much lower than they have been in recent years.
Financial markets are functioning effectively. Funding costs for high-quality borrowers remain low and, globally, monetary policy remains remarkably accommodative. Government bond yields have risen, but are still low by historical standards.
In Australia, the economy is growing at a moderate rate. The large decline in mining investment is being offset by growth in other areas, including residential construction, public demand and exports. Household consumption has been growing at a reasonable pace, but appears to have slowed a little recently. Measures of household and business sentiment remain above average.
Labour market indicators continue to be somewhat mixed. The unemployment rate has declined this year, although there is considerable variation in employment growth across the country. Part-time employment has been growing strongly, but employment growth overall has slowed. The forward-looking indicators point to continued expansion in employment in the near term.
Inflation remains quite low. The September quarter inflation data were broadly as expected, with underlying inflation continuing to run at around 1½ per cent. Subdued growth in labour costs and very low cost pressures elsewhere in the world mean that inflation is expected to remain low for some time.
Low interest rates have been supporting domestic demand and the lower exchange rate since 2013 has been helping the traded sector. Financial institutions are in a position to lend for worthwhile purposes. These factors are assisting the economy to make the necessary adjustments, though an appreciating exchange rate could complicate this.
The Bank’s forecasts for output growth and inflation are little changed from those of three months ago. Over the next year, the economy is forecast to grow at close to its potential rate, before gradually strengthening. Inflation is expected to pick up gradually over the next two years.
In the housing market, supervisory measures have strengthened lending standards and some lenders are taking a more cautious attitude to lending in certain segments. Turnover in the housing market and growth in lending for housing have slowed over the past year. The rate of increase in housing prices is also lower than it was a year ago, although prices in some markets have been rising briskly over the past few months. Considerable supply of apartments is scheduled to come on stream over the next couple of years, particularly in the eastern capital cities. Growth in rents is the slowest for some decades.
Taking account of the available information, and having eased monetary policy at its May and August meetings, the Board judged that holding the stance of policy unchanged at this meeting would be consistent with sustainable growth in the economy and achieving the inflation target over time.
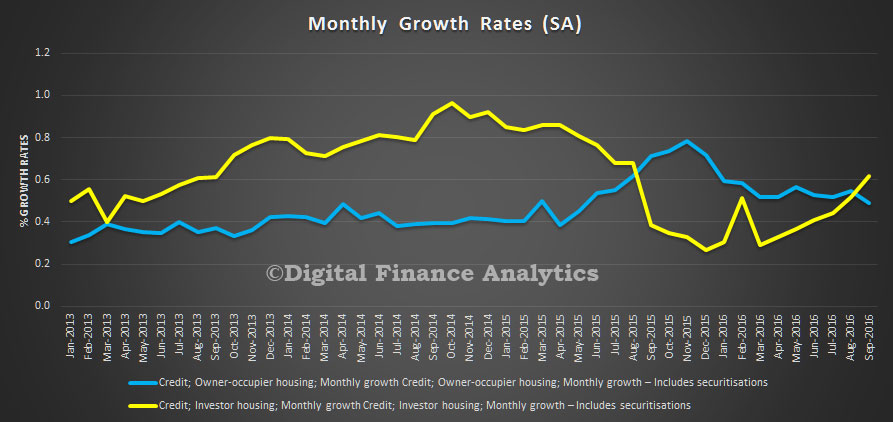
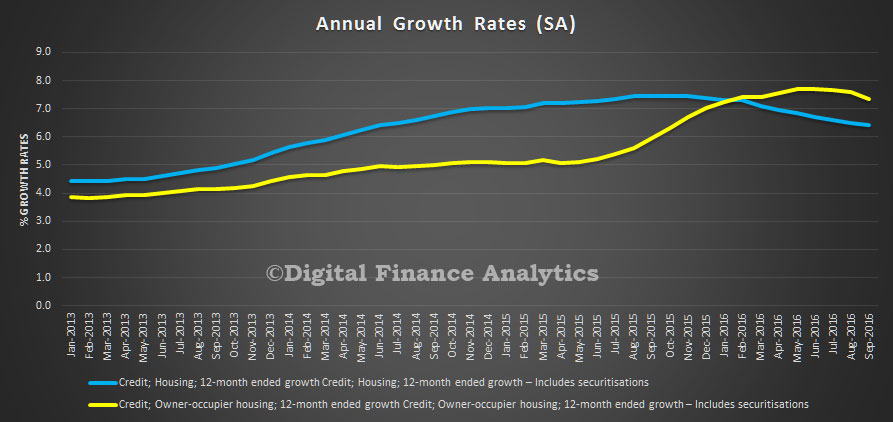
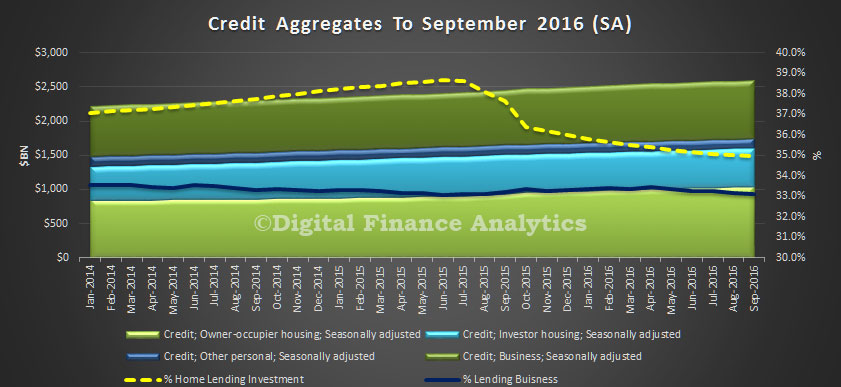
The RBA released their credit aggregates for September today. Overall, lending for housing rose 0.5% to reach another record $1.6 trillion, up $8.6 billion. Within that, owner occupied lending rose 0.6%, up $6.1 billion and investment lending rose 0.4% or $2.5 billion. This is a slightly lower growth rate than a year back (7.5%), but is still strong, well above inflation and wage growth. This means household debts will continue to rise.
The monthly growth rate for investment mortgages shows a sharp move up, and from March 2016, as banks started to focus on lending to this sector. Lending for owner occupation growth rates fell a little, having peaked at the end of last year.
The annualised analysis shows a tilt down, but if recent trends continue, this will reverse. This is hardly a good indicator that housing lending is under control. Indeed, we saw another high auction clearance rate at the weekend.
It is worth noting that there was $1bn of mortgages being switched between owner occupied and investment categories. The proportion of loans for investment purposes is still stitting at 35%. In addition, the proportion of lending to business continues to fall, rising just 0.3% this month, or $2.9 bn. Lending for personal finance fell again, down 0.1%.
The RBA said:
Following the introduction of an interest rate differential between housing loans to investors and owner-occupiers in mid-2015, a number of borrowers have changed the purpose of their existing loan; the net value of switching of loan purpose from investor to owner-occupier is estimated to have been $45 billion over the period of July 2015 to September 2016, of which $1.0 billion occurred in September 2016. These changes are reflected in the level of owner-occupier and investor credit outstanding. However, growth rates for these series have been adjusted to remove the effect of loan purpose changes.
Note we have used the seasonally adjusted data in our analysis. You can read our analysis of the companion APRA monthly banking stats here.
Global inflation appears to be at a point of inflection, which can create challenges for investors and necessitate a re-evaluation of strategies.
Inflation has only been a problem because there hasn’t been enough of it. Lack of inflation fuels fears of deflation, despite lengthy and innovative attempts by central banks to stimulate growth and push prices higher.
However, inflation is seemingly at an inflection point. The word ‘deflation’ may exit the financial lexicon over the coming months as commodity prices stabilise and global excess capacity is slowly reduced, and investors position for modestly higher rates of inflation.
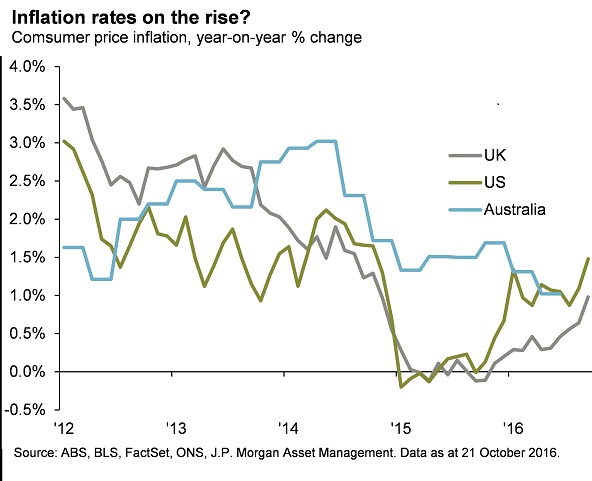
In the past week, inflation in both the UK and the US has reached the highest rates in almost two years at 1.0 per cent and 1.5 per cent year-over-year respectively.
In the US economy the rise in the price of oil over the last year is filtering through into higher energy costs, meanwhile the UK inflation rate got an additional boost from the tumbling value of the pound.
Sterling has declined by 16 per cent on a trade weighted basis since the EU referendum back in July and 22 per cent since last November. It’s worthwhile to note that an increase in inflation in these two economies can result in very different policy responses.
In the US, rising prices is a signal of a healthier economy and removes another obstacle to the Federal Reserve hiking rates later this year.
The story is very different in the UK as rising inflation is a symptom of the stress that the threat of a ‘hard brexit’ is placing on the economy.
This could result in further easing of monetary policy as the Bank of England is prepared to look past the near term rise in prices, preferring to focus on the potential drag on growth of the UK extracting itself from the European Union.
In Australia, we may not yet be at the point were we start to see inflation rise, and there are structural reasons for why inflation is low and why it can remain relatively benign – international competition in retail and low wage growth are just two examples.
We do not expect it to plunge further however, and the rate of inflation here has not skirted with deflation as it has in the UK and the US.
This week’s inflation release will be critical for the outlook on monetary policy, given that the rate of inflation has missed the bottom of the RBA’s target band for six consecutive quarters already.
The RBA’s current projection is for inflation to be 1.5 per cent year-on-year in December and then remaining between 1.5-2.5 per cent in 2017.
Only if inflation threatens to undershoot these already low projections will the RBA be spurred to cut rates again and, as a reluctant cutter, they will likely keep rates where they are into next year.
The outlook for global inflation is on the turn. A modest rise in inflation – and inflation expectations – from their very low levels in the US and UK will be echoed through the rising yields in the global government bond market.
This is especially the case when combined with exhaustion from monetary policy and the focus on increased levels of fiscal spending.
Yields on the US and Australian ten-year government bonds have increased by over 20 basis points since the end of September and while these moves may seem sharp, they are not nearly as dramatic as the back-up in yields experienced during the 2013 taper tantrum.
Yields on core government bonds are likely to rise but are unlikely to surge thanks to demand from insurance companies and pension funds that have been starved of safe yield bearing assets for many years.
Government bonds hold a fundamental position in any portfolio as a diversifier, but play a diminished role in providing income.
The perceived riskier areas of the fixed income market provide some income relief. Spreads in investment grade and high yield credit have narrowed to their historical averages but can tighten further.
The performance of emerging market debt this year has been staggering. US dollar denominated debt returned nearly 15 per cent in the first nine months of the year and investors may be wondering if they have missed the rally, however the improvement in growth prospects and upward revision to corporate earnings suggests that there are still opportunities for investors.
Author: Kerry Craig global market strategist at J.P. Morgan Asset Management.
The RBA minutes, released today, have several paragraphs on the housing sector, yet seem to be quite selective in their narrative. So we have laid out our own perspectives alongside the words from the RBA.
We think the housing risks are higher for one simple reason. Debt enables households to bring forward purchases, to be paid for from later income. But with income rising so slowly, and debts still growing fast, how will the debts be repaid?
RBA Minutes Says
DFA Says
Household consumption growth had moderated in the June quarter. This was driven by a decline in the consumption of goods, consistent with low growth in retail sales volumes, while growth in the consumption of services had remained around average. More timely indicators of household consumption had been mixed: although growth in retail sales had been low over the few months to July, households’ perceptions of their personal finances had remained above average. Members noted that future consumption growth would largely depend on growth in household income. Members observed that the household saving ratio had been little changed in the June quarter but remained on a gradual downward trend, in line with earlier forecasts.
Why no mention of the rising household debt ratio? It is now higher than ever it has been. With income growth so low, whilst serviceability of large loans at current interest rates is manageable by many, how will the capital value of the loan be paid off?
The proportion of households who are property inactive continues to rise, as more are excluded on affordability grounds.
Dwelling investment had been increasing more rapidly than housing credit, suggesting that households were increasing their housing equity at a relatively strong rate. Indeed, private dwelling investment had continued to grow at an above-average rate in the June quarter. The large amount of work in the pipeline and the high level of building approvals in July and August were expected to support a high level of dwelling investment for some time, although the rate of growth in dwelling investment was expected to decline over the forecast period.
Investment loans were the only growth area in the August ABS data- up 1%. Lenders are very willing to lend to this sector. We think stronger macro-prudential policies are needed. Demand for investment property remains strong, on the expectation of continued future home price growth.
The growth of home prices is not matched to growth in rental incomes, in fact they are slower than they have been for years. This creates a further risk in the investment sector. We know many households are not covering the costs of their rental property from rent received, relying on tax breaks and offsets, especially in VIC and NSW, whilst hoping for capital growth.
In the established housing market, conditions had eased relative to a year earlier, although there had been some signs that conditions had strengthened a little more recently. Housing price growth in Sydney and Melbourne had increased in recent months and auction clearance rates in these two cities had risen. In contrast, turnover and housing credit growth had been noticeably lower than a year earlier and the value of housing loan approvals had been little changed in recent months. Conditions in the rental market had continued to soften, particularly in Perth, where population growth had been easing and the rental vacancy rate had risen.
There is debate as to the rate of real growth in home prices, but they are still rising, especially in VIC and NSW. High auction clearance rates show demand remains strong. Home prices could well continue to rise, enabling more lending. We need DSR and LTI macro-prudential measures. LVR measures do not help much in a rising market.
Conditions in the housing market had been mixed over prior months. The effects of tighter lending standards had been apparent in indicators such as the shares of interest-only loans and loans with high loan-to-valuation ratios in new lending, both of which had declined over the past year. Turnover had declined and housing credit growth had been steady at a noticeably lower rate than a year earlier. Although the rate of increase in housing prices had been lower than a year earlier, growth in housing prices and auction clearance rates had strengthened in Sydney and Melbourne in the months leading up to the meeting. Members noted that considerable supply of apartments was scheduled to come on stream over the next couple of years, particularly in the eastern capital cities. Overall, members assessed that while the risks associated with rapid growth in housing prices and lending had receded over the past year, developments would need to be monitored closely.
Interest only loans are actually rising again according the APRA’s latest data, as investment loan growth continues. Several lenders are offering attractive discounts now. Household have high levels of debt. The risks are quite high now, and would become severe if interest rates were to rise