The Reserve Bank of Australia (RBA) sees housing finance as a smaller danger than in the past, judging by its latest Financial Stability Review, but we aren’t back to happy days just yet. A number of economic indicators still show there’s cause for concern in the property market.
The review does acknowledge some problems in the apartment markets in Brisbane and Melbourne, but it sees major threats to the resilience of the Australian financial system overseas: examples are the rising debt levels in China, the low performance of European banks, the Brexit, and the impact of low milk prices on New Zealand farmers (with a possible feedback effect to Australian banks).
The review highlights Australian banks’ stronger capital buffers and compliance with toughened prudential standards from the Australian Prudential Regulation Authority (APRA). Because house price growth has moderated and mortgage borrowers are substantially ahead of their scheduled payments, the risk from mortgage lending is somewhat lower.
However, it’s surprising that the review doesn’t stress some aspects that are obvious.
What the RBA didn’t say
Although Australia hasn’t experienced the type of shock to the economy the United States did, due to the sub-prime mortgage crisis, there is substantial risk due to a large portion of mortgage loans being subject to interest-only periods of typically five years. Research for US home equity lines of credit finds the risk that people won’t be able to pay mortgage expenses increases substantially towards the end of flexible repayment terms, in particular during times of increasing lending standards.
Mortgage borrowers often have the expectation that they are able to refinance at the end of the interest-only term into a similar loan with a new interest-only period. However, this rollover is not possible in economic downturns when banks suddenly tighten their lending standards and and are likely to cut refinancing.
The RBA’s review shows that Australian banks have tightened their lending standards and have room for further tightening, but currently we do not see larger impacts on delinquencies. Current rates of people not being able to make their mortgage payments are low but may quickly change in an economic downturn. It’s also difficult to forecast whether this will change judging by medium- to long-term trends.
There might be other reasons why people might struggle to make their mortgage repayments. We have seen central banks following the European and US central banks in lowering interest rates and markets are expecting a reversal in the future. As most mortgage loans in Australia are at a floating rate this would imply that the largest relative payment increase will be to interest-only loans, should the RBA follow these leads.
In addition to this, Australia continues to enjoy low unemployment rates. This may change and lower the average income levels, putting more stress on people’s ability to pay mortgage loans.
Banks have relatively reduced interest only loans and high loan to valuation ratio (LVR) style loans. However, it is also clear that origins of high risk mortgages continue at relative high levels.
Australian Prudential Regulation, new mortgage loans for ADIs with greater than $1 bn of term loans
The fraction of interest-only loans has come down from 44% in December 2014 to 36% in March 2016. While this is a noticable decrease, more than a third of loans continue to be interest-only.
The RBA’s review argues that Australian mortgage borrowers are on average approximately two and a half years ahead of the scheduled payments. This argument does not take interest-only loans into account.
Prepayments are generally made into offset accounts which include a redraw facility and are generally used when new properties are used. In other words, these prepayments may be quickly depleted to increase leverage but also in situations when borrowers have difficulties making payments.
Dominance of housing loans on bank books
The largest problem of Australian banks remains the dominance of housing loans on bank books. Approximately 60% of total loans are for residential properties, and 36% of loans are business loans dominated by commercial real estate loans and loans to small and medium sized companies, which are often backed by the real estate of the business owner.
This over-concentration is the Achilles’ heel of the Australian banking system and hard to protect against. It’s a reflection of demand for bank loans in Australia and alternatives to bank lending available to large firms.
International financial markets may provide a solution, allowing banks to diversify and risk transfer via asset risk swaps. Unfortunately, these solutions have not been explored much in the past . The reluctance to do this is mostly based on the poor performance of overseas assets during the global financial crisis.
The RBA’s review further discusses the achievements under the Basel Committee on Banking Supervision to limit the systemic risk of financial institutions via increased regulation and higher capital buffers. The review further notes that no Australian bank is of global systemic importance.
However this is not a reason for complacency as the failure of one of the largest Australian banks would lead to a great shock to the Australian economy. A further concentration in the banking industry would make bank products more expensive than they would be in a competitive system.
The Reserve Bank has warned that a sharp fall in the value of inner-city apartments in Melbourne and Brisbane is “closer to materialising”, as developers continue to flood both markets with new high-rise dwellings.
The central bank made the observation in its latest financial stability review, which noted that supply pressures are likely to weigh most on apartment prices in Brisbane and Melbourne.
Over the next two years, around 16,000 new apartments will be completed in Melbourne, raising the prospect of a glut in high-rise units.
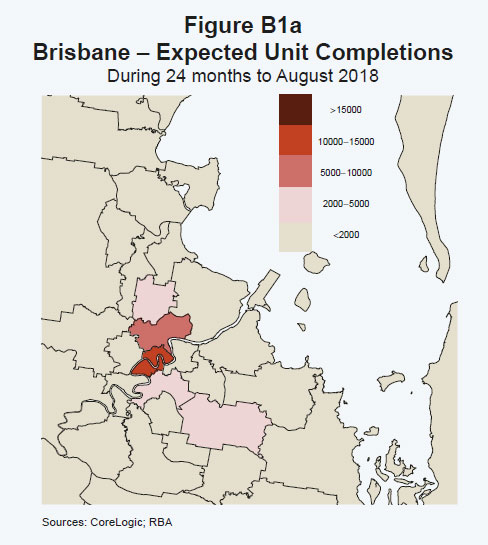
About 12,000 new apartments are expected to be built in Brisbane.
The RBA is concerned that a fall in demand for new apartments could test the ability of developers and property buyers to meet repayments on loans that collectively run into the tens of billions.
“In residential property development, the risks in some apartment markets are closer to materialising, as the large and geographically concentrated increase in supply approaches,” the central bank said.
“If apartment market conditions were to deteriorate in these inner-city areas, it is more likely that banks would experience material losses on their development lending rather than on their mortgages.
“Banks would experience losses on these exposures in default events where the value of the properties is insufficient to cover the debt outstanding.”
Home borrowers in WA and Queensland under ‘stress’
In its wide-ranging survey of the domestic housing market, the RBA also observed that the number of home borrowers unable to meet mortgage repayments was rising “substantially” throughout the mining regions of Queensland and Western Australia.
House prices in some have more than halved in the last three years, leaving many borrowers without means to repay loans.
This has triggered a significant rise in the number of homes being repossessed by banks, particularly in WA’s Pilbara mining region where the median house price has slumped to less than $400,000 from $830,000 in 2013.
Many borrowers have been left without means to repay loans. Photo: Getty
Borrowers are also under pressure in Queensland’s Central Highlands where house values have been crunched by more than 55 per cent.
“Although the household sector’s aggregate financial position has remained broadly steady, households in some parts of the country are experiencing increased financial stress,” the RBA observed.
“Housing loan performance in Western Australia and Queensland in particular deteriorated further over the first half of 2016.
“The (commercial) banks attributed this deterioration largely to declining incomes in the mining states rather than to unemployment.”
The big problem for many borrowers in mining towns is that it has become extremely difficult to repay lenders because there are simply no buyers for their properties, even when they are offered at big discounts.
The national picture: risks have ‘lessened a little’
While thousands of borrowers living in mining areas are doing it tough, the RBA believes that the overall risk profile of Australian home borrowers actually improved in the first half of the year.
The Reserve attributed the modest improvement to the slowdown in house price growth and the effect of tighter lending measures imposed by the Australian Prudential Regulation Authority on the banks.
Although the average mortgage debt of Australian home borrowers rose to a record $256,000 at the end of June, the RBA observed that a larger proportion of recent home buyers had stumped up bigger deposits compared to people who applied for loans last year.
The RBA also observed that fewer borrowers took out interest-only loans in the June quarter.
The Reserve Bank acknowledged that fewer borrowers took out interest-only loans in the June quarter. Photo: AAP
One of Australia’s leading banking industry researchers – Martin North of Digital Finance Analytics – is less sanguine about the risk profile of home loans and general lending by the banks.
He pointed to the latest loan data published by the Australian Bureau of Statistics, which showed that investment property lending was the only credit category to grow in August.
“The lack of business investment growth is hobbling overall economic outcomes, whilst our housing stock value, and bank balance sheets are artificially being inflated,” he said.
“This mix of lending and the implications, is what the RBA should be discussing.
“Ultra-low interest rates are not helping to restore productive growth.”
The RBA Financial Stability Review, released today, says
Risks to financial stability from lending to households have lessened a little over the past six months, as serviceability metrics and other lending standards have continued to strengthen and the pace of credit growth has slowed. Housing price growth is also slower than it was a year or so ago, although it has picked up a little in Sydney and Melbourne in recent months. The risk profile of new borrowing has improved further. The share of new high loan-to-valuation (LVR) lending and interest-only loans has fallen; high-LVR lending is now at its lowest share in almost a decade.
Nonetheless, the household debt-to-income ratio is still drifting higher, even after adjusting for the rapid growth of balances in offset accounts. Non-performing mortgage loans have also picked up nationally but remain low. This pick-up has been most pronounced in mining areas where housing market conditions have deteriorated sharply, though only a small share of banks’ mortgage lending is to these areas.
But, the latest release from the ABS seems to tell a rather different, and more disturbing story. I will focus in the trend series, which irons out month on month distortions.
In trend terms owner occupation loans fell 0.9% compared with the previous month, to $19.8 bn, personal finance fell 0.8% to $6.9bn and commercial finance fell 0.7% to $38.3bn. But this does not tell the full story.
Here are the month on month movements by a more granular set of categories. The only segment which rose was lending for housing investment purposes (which is reported within the commercial sector numbers). This rose 1%, t0 $11.9 bn. Other lending for commercial purposes, excluding for housing investment fell, commercial fixed loans fell 0.5% to $18.6 bn and revolving commercial credit fell 3.6% to $7.7 bn.
Therefore the total fixed commercial credit (sum of housing investment loans and other commercial fixed loans) netted off with a rise of 0.04%.
All other lending categories saw a fall in month on month movements, owner occupied housing indeed fell 0.9% $19.8 bn.
Turning to the trend analysis, the chart below shows a fall in overall lending, but the mix of lending is the main concern. The only thing holding up bank lending is growth in the investment property sector, whilst the rest of the commercial sector continues to borrow less. The ratio of fixed commercial lending for investment housing has moved up from 31% in 2012 to 39% now, whilst the proportion of lending for productive commercial investment has fallen from 69% in 2012 to 61% now. Another way to look at it is commercial lending, excluding for housing has fallen to 40% of all lending, from 46% in 2012.
So, it is momentum in investment lending which is supporting overall lending, which would have otherwise fallen significantly, but this is not a productive activity. The lack of business investment growth is hobling overall economic outcomes, whilst our housing stock value, and bank balance sheets are artificially being inflated.
This mix of lending and the implications, is what the RBA should be discussing. Ultra-low interest rates are not helping to restore productive growth.
Also, it is worth bearing in mind, interest only loans tend to be used by property investors to maximise their tax refunds, one reason why more are being written than earlier in the year.
The latest RBA Financial Stability Review includes coverage on the Banks’ Exposures to Inner-city Apartment Markets. They say banks are most exposed to inner-city housing markets through their mortgage lending rather than via their development lending. Sydney and Melbourne have the largest exposures. That said, they downplay the risks, thanks to the run-up in prices providing a buffer (though this is not true for new transactions) whilst admitting that there is no data on the geographic footprint of mortgage lending in the returns the banks provide, and not all banks would necessarily have the same level of exposures. Another area where we think better data is needed. Also, what happens if off-the-plan purchasers walk away before completion?
The large number of new apartments recently completed and currently under construction in many capital cities raises the risk of a marked oversupply in some geographic areas. The banking system’s exposure to these apartment markets arises from its financing of apartment construction as well as lending to the purchasers of the apartments once construction is complete. This box examines the banking system’s development and mortgage exposures in the inner-city areas of Brisbane, Melbourne and Sydney, where apartment construction has recently been most concentrated.
As indicated here, if apartment market conditions were to deteriorate in these inner-city areas it is more likely that banks would experience material losses on their development lending rather than on their mortgages. This is because of both a higher probability of default and higher loss-given-default on their development lending than on their mortgage lending for apartment purchases. However, while this box examines the situation for the Australian banking system as a whole, individual banks may have more concentrated exposures in certain geographic areas, including exposures to riskier or lower-quality developments, and hence it is unlikely that losses would be evenly distributed across the banking system if a downturn were to happen.
Current Market Conditions
Following the marked pick-up in apartment construction in recent years, inner-city Melbourne is forecast to have the largest number of completions (around 16 000) over the next two years, followed by Brisbane (12 000) and Sydney (10 000) (Figure B1a, Figure B1b, Figure B1c).
In Brisbane and Melbourne these new apartments will represent a far larger increase in the dwelling stock than in Sydney. Furthermore, apartment price and rental growth in Brisbane and Melbourne are relatively subdued – notwithstanding some strengthening in rents in Melbourne of late – and rental vacancy rates are higher than in Sydney (Graph B1). It is therefore foreseeable that these additions to the stock will have a greater effect on housing market conditions in these areas.
Exposures
The routine regulatory data disclosures do not require banks to report their exposures by geographic region. Nonetheless, data on banks’ total Australian mortgage and development lending – along with data on construction activity, housing prices and buyer profile in these areas – can provide some rough estimates of the magnitude of these exposures and hence a broad indication of how exposed banks are to a downturn in these markets.
Overall, these estimates suggest that, by value, banks are most exposed to inner-city housing markets through their mortgage lending rather than via their development lending (Graph B2). The data suggest that around 2–5 per cent of banks’ total outstanding mortgage lending is to inner-city Brisbane, Melbourne and Sydney, and this share is likely to grow as the apartments currently under construction are completed. At around $20– 30 billion, mortgage exposures are estimated to be larger in Sydney, reflecting Sydney’s higher apartment prices and greater number of mortgaged dwellings, than in Brisbane and Melbourne where mortgage exposures are estimated at around $10–20 billion in each inner-city area. By contrast, the available data suggest that around one-fifth of banks’ total residential development lending is to these areas. Development exposures are a little larger in Melbourne and Brisbane than in Sydney, due to the greater volume of apartment construction currently underway, though they are each less than $5 billion.
Potential Losses
Banks would experience losses on these exposures in default events where the value of the properties is insufficient to cover the debt outstanding. Australian mortgage lending has historically had very low default rates – around ½ per cent – and had high levels of collateralisation. In Sydney in particular, a very large price fall would be required before the banks would experience sizeable losses, since the rapid price growth over recent years has increased borrowers’ equity in their apartments and thereby lowered banks’ losses-given-default.
In contrast, inner-city Melbourne and Brisbane have experienced far less price growth, limiting borrowers’ accumulation of equity. To gain a broad indication of the size of potential losses to banks, one can consider a hypothetical scenario where default rates rose to between 5 and 15 per cent on inner-city mortgages, and then combine this with a range of housing price falls. Under this scenario, bank losses remain very low until price falls reach over 25 per cent or so (Graph B3).
Repeating this scenario for developer exposures is challenging, because the exposures are more idiosyncratic and the largest losses can be on incomplete developments. In addition, the average level of developer equity in their apartment projects is not readily available and anecdotal evidence suggests that it varies significantly by building. A simple way to model potential losses on developer lending is to use loss rates in line with those seen on all Australian residential development lending during the financial crisis.
In this scenario, losses still remain fairly small (Graph B4). Alternative comparisons are the Spanish and Irish financial crisis experiences, which were associated with housing price falls of more than 30 and 50 per cent, respectively, and impairment rates on commercial property of over 30 per cent.
In these situations, the losses to banks would be several times larger than the recent Australian experience. However, Australia is not facing the same economic and financial headwinds as Spain or Ireland did during the financial crisis, where the extent of overbuilding was much greater and prevalent across their entire countries, contributing to very sharp deteriorations in economic conditions. More likely, any oversupply in Australia would be more localised to certain geographic areas, and potential price falls tempered as the population moved to absorb the new (and cheaper) supply of housing in these areas over time.
When Australia’s central bank moves interest rates as part of its monetary policy, it’s not just politicians who stand to lose if banks don’t follow suit.
Retail lending markets form an integral part of the monetary policy transmission mechanism. If interest rate rises are passed on at a different rate to cuts it can adversely affect the efficacy of expansionary versus contractionary monetary policy.
In August 2016, APRA data showed the big four Australian banks held 83% of the home loan market (including both the owner occupier and investment categories).
At an individual level, the ability and willingness of lenders to pass on the official interest rate cuts to borrowers depends on many factors. These include exposure to overseas funding sources, market power, the funding mix, reserves and the extent of securitisation. But it’s also clear delaying interest rate cuts can significantly impact their bottom line.
According to my analysis, the big four banks can make approximately $A8.6 million per day as a group if they do not fully pass onto borrowers a hypothetical 0.25% cut in the RBA’s cash rate.
More specifically, if ANZ, CBA, NAB and Westpac manage to postpone lowering their mortgage interest rates say by 10 days, they can potentially make an extra A$16, A$28, A$16 and $A26 million dollars in profits, respectively.
Previous studies on mortgages, small business loans and credit card interest rates have found significant evidence for the “rockets and feathers” hypothesis. That is, when the cash rate increases, various lending rates shoot up like rockets but when the opposite occurs they go down like feathers.
In my research I used monthly data (2000-2012) for 39 bank and non-bank financial institutions including 7 building societies, 15 Australian-owned banks, 3 foreign subsidiary banks, 13 credit unions, and 1 major mortgage broker. The research found the mortgage interest rate spread of all lenders rose after the 2008 global financial crisis, albeit to varying degrees.
In general, the research shows most building societies and some credit unions can offer more competitive home loans than banks.
There is no significant relationship between lenders’ markups and the level of over the counter customer service since the 2008 financial crisis. This is an important observation as the mortgage spreads of larger lenders are typically higher than those of their smaller non-bank counterparts. This puts lie to the view that the relatively higher mortgage interest rates of the larger banks in Australia are justified by higher overhead costs associated with the running of their large branch networks.
Author: Abbas Valadkhani, Professor of Economics, Swinburne University of Technology
At its meeting today, the Board decided to leave the cash rate unchanged at 1.50 per cent.
The global economy is continuing to grow, at a lower than average pace. Labour market conditions in the advanced economies have improved over the past year, but growth in global industrial production and trade remains subdued. Actions by Chinese policymakers have been supporting growth, but the underlying pace of growth in China has been moderating. Inflation remains below most central banks’ targets.
Commodity prices have risen over recent months, following the very substantial declines over the past few years. The higher commodity prices have supported a rise in Australia’s terms of trade, although they remain much lower than they have been in recent years.
Financial markets have continued to function effectively. Funding costs for high-quality borrowers remain low and, globally, monetary policy remains remarkably accommodative. Government bond yields are near their historical lows.
In Australia, the economy is continuing to grow at a moderate rate. The large decline in mining investment is being offset by growth in other areas, including residential construction, public demand and exports. Household consumption has been growing at a reasonable pace, but appears to have slowed a little recently. Measures of household and business sentiment remain above average.
Labour market indicators have been somewhat mixed. The unemployment rate has fallen further, although there is considerable variation in employment growth across the country. Part-time employment has been growing strongly, while growth in full-time employment has been subdued. The forward-looking indicators point to continued expansion in employment in the near term.
Inflation remains quite low. Given very subdued growth in labour costs and very low cost pressures elsewhere in the world, this is expected to remain the case for some time.
Low interest rates have been supporting domestic demand and the lower exchange rate since 2013 has been helping the traded sector. Financial institutions are in a position to lend for worthwhile purposes. These factors are all assisting the economy to make the necessary economic adjustments, though an appreciating exchange rate could complicate this.
Supervisory measures have strengthened lending standards in the housing market. Separately, a number of lenders are also taking a more cautious attitude to lending in certain segments. Growth in lending for housing has slowed over the past year. Turnover in the housing market has declined. The rate of increase in housing prices is lower than it was a year ago, although some markets have strengthened recently. Considerable supply of apartments is scheduled to come on stream over the next couple of years, particularly in the eastern capital cities. Growth in rents is the slowest for some decades.
Taking account of the available information, and having eased monetary policy at its May and August meetings, the Board judged that holding the stance of policy unchanged at this meeting would be consistent with sustainable growth in the economy and achieving the inflation target over time.
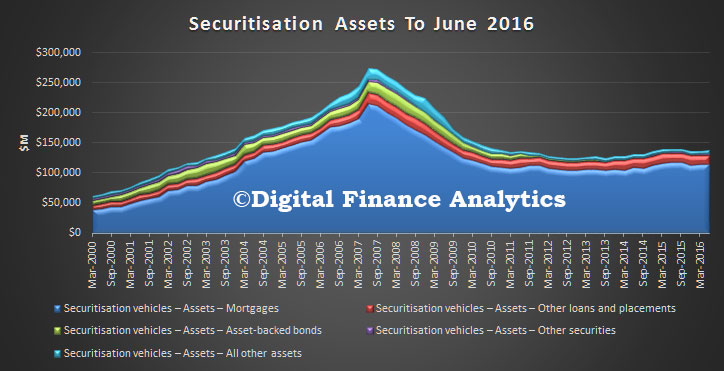
The RBA statistics gives a view of the state of play of in particular mortgage backed securitisation. Prior to the GFC this form of financing was accelerating, but since then has been less popular – due to higher regulatory requirements, lower overseas demand, and the emergence of other funding structures. The costs of issuance, which before the GFC were significantly lower than more traditional funding alternatives, has largely been negated.
As a result, total mortgage backed assets fell 0.37% month on month to $114 billion. Compare this with a peak of $215 billion in June 2007.
Remembering that bank credit has been growing significantly, the fall is, in real terms, even more stark. The chart above depreciates the total securitisation pool of ~$138 billion by credit growth, from its peak in 2007. It shows that in 2007 terms, the fall is even greater, to ~$78 billion, a significant drop from its peak of $274 billion.
The other significant fact is that now 94% of securitisation deals are being sold in Australia, of which 75% are short term, and 19% long term. Overseas issuance, which peaked in 2007, remains close to their lows, at around 1.6%.
The latest statistical release from the RBA includes data of some key household ratios. Of particular interest is the ratio between income and debt, and income to repayments.
The ratio of household debt to income has risen again now standing at 186, as high as it has ever been. The ratio of income to debt is on average 8.5, and has been tracking lower as interest rates fall.
Or to put it another way, as interest rates fall, households are borrowing more. As we saw yesterday, “other personal credit” fell in August, whilst mortgage debt rose again.
This debt to income ratio puts Australia at the top of league and highlights the potential risks which exist due to excessive leverage should rates rise, employment fall, or from some external shock (e.g. a European bank failing!).
The regulators need to start tightening credit availability, so total household debt begins to align better to income growth. Current credit growth rates, be they lower than last year, are still too high.
The latest RBA credit aggregates to end August 2016, shows that total credit grew again, thanks to higher home lending, which reached a new record of $1.584 trillion. A further $1 billion of loans were reclassified between between owner occupied and investment loans, making $44 billion in total, or 2.8% of all loans.
Seasonally adjusted owner occupied loans grew 0.62% or $6.3 billion, whilst investment lending grew $1.5 billion or $0.27%. Investment loans comprise 34.98% of all home lending, down from a high of 38.6% in June 2015. Business lending went sideways, dropping to 33.2% of all lending, continuing its drift downwards – not a good sign for real future growth. Other personal credit fell slightly.
The 12 month growth analysis shows owner occupied loans sitting at 7.6%, investment loans 4.6%, total housing at 6.5% and business lending at 5.7%. All higher than inflation and income growth. Australia is living with ever higher debt.
The RBA says:
Following the introduction of an interest rate differential between housing loans to investors and owner-occupiers in mid-2015, a number of borrowers have changed the purpose of their existing loan; the net value of switching of loan purpose from investor to owner-occupier is estimated to have been $44 billion over the period of July 2015 to August 2016, of which $1.0 billion occurred in August 2016. These changes are reflected in the level of owner-occupier and investor credit outstanding. However, growth rates for these series have been adjusted to remove the effect of loan purpose changes.
Malcolm Edey, RBA Assistant Governor (Financial System) spoke at the Australian Financial Review Retail Summit and discussed the changing face of payments, including the relative volume and costs of various payment methods. Cheques are well out of favour.
A good place to start is an observation that will not be lost on anyone here. That is that the nature of the payments we use is changing, and changing quite rapidly at the moment. Probably the clearest example to most people has been the take-up of contactless, or tap-and-go, card payments. These have taken off extraordinarily quickly in Australia, to the point where Australia is thought of as the leading contactless market in the world. This is a technology that offers a benefit to both consumers and merchants in terms of the time taken to process a payment, and as a result it has been embraced – but many merchants might also notice that their payments costs have risen because of the resulting change in their payments mix. This is a good example of the complex dynamics of competition in the retail payments system.
But the rise of contactless payments is only one of a range of changes that have been occurring to the payments system over time – some of which you might have noticed, some of which you have probably never thought about.
Possibly the most important trend we are seeing is the steady decline in the use of traditionally paper-based payments. Think of when was the last time you wrote or received a cheque. In 2000 the average Australian wrote around 35 cheques per year. In 2015/16 that was down to six. What is more, while cheque use has been declining for two decades, the decline if anything is accelerating; after falling by an average of about 13 per cent per year in the preceding five years, the number of cheques written fell by 17 per cent in 2015/16.
We have been observing the decline in cheques for many years, but more recently it has been a decline in the use of that other traditionally paper instrument – cash – that has been attracting attention. The only real way to adequately measure the use of cash is to survey the users – something the Reserve Bank does via a consumer diary once every three years. We ran the first of these surveys in 2007, when a large majority of consumer payments – 69 per cent – were made with cash. By 2010, that percentage had fallen to 62 per cent and by 2013, 47 per cent, with the decline occurring across all payment values. We will run the survey again this year, but it seems a safe bet that there will be a further, probably quite large, decline in cash use.
This trend is not all about people falling out of love with cash; a significant factor is the rapid rise in online commerce, where of course cash is not an option.
So what has filled the gap left by our paper instruments? In the retail space it is largely cards, which have grown by an average of 11 per cent per year over the past five years. This reflects cards’ large share in online commerce, as well as their having gained ground at the retail point of sale. Based on the Bank’s consumer survey, card payments made up 43 per cent of all consumer payments in 2013, and 55 per cent of those over 50 dollars. The ubiquity of card payments is one reason we care a lot about how those systems operate, as I will discuss more a bit later.
It is also worth noting that in the period measured by our survey, BPAY also gained an increasing share of the market, while the relative newcomer, PayPal showed strong growth from a low base.
The Cost of Payments
Of equal interest to these broader trends in payments usage is the cost of payments. The retail sector clearly has a strong interest in the cost of payments to merchants, and while the Reserve Bank is also interested in this, its principal focus when evaluating the efficiency of the payments system is the resource cost of payments – that is, how much it costs the economy in total to produce a payment – abstracting from the various fees that determine the cost to any single party or sector. Determining resource costs is a large job, requiring detailed information on financial institutions’ costs and things like the cost of processing time for merchants.
The Reserve Bank last went through this exercise in 2014. The most comforting news from that study was that the resource cost of consumer to business payments had declined as a percentage of GDP since the previous cost study in 2006, from 0.80 per cent to 0.54 per cent, even though the number of transactions had risen. Despite the favourable trend overall, the mix of payments within the total acted in the direction of increasing costs.
Looking across the main non-cash retail systems, we see that, unsurprisingly, the highest per-transaction resource costs were generated by the cheque system, with each cheque written costing the economy about $5.12, if account overheads are ignored. This is not surprising given the cost of shipping and processing physical cheques, although there have been some efficiency improvements in the cheque system since the time of the study.
Perhaps of more current interest to the retail sector is the cost of our card systems. Credit cards are quite costly at around 94 cents for the average sized transaction, while MasterCard and Visa debit are less costly and eftpos uses the fewest resources of any of the card systems, at around 45 cents per transaction.
The broad relativities between the resource costs of these systems is similar to those faced by merchants. Another way to think about that is that it is merchants who, by and large, bear the cost of payments. This is largely achieved by the way fees are used in these systems. I think the most telling illustration of that is to compare the actual costs faced by merchants to the costs faced by consumers once fees and benefits to consumers, like interest-free periods and reward points, are taken into account. What you will see is that, despite being more expensive to produce and more costly to merchants, on average a credit card transaction costs a consumer slightly less than a debit card transaction. These are the incentives that shape payment choices by consumers.

Australian Prudential Regulation, new mortgage loans for ADIs with greater than $1 bn of term loans
Many borrowers have been left without means to repay loans. Photo: Getty
The Reserve Bank acknowledged that fewer borrowers took out interest-only loans in the June quarter. Photo: AAP

 Therefore the total fixed commercial credit (sum of housing investment loans and other commercial fixed loans) netted off with a rise of 0.04%.
 So, it is momentum in investment lending which is supporting overall lending, which would have otherwise fallen significantly, but this is not a productive activity. The lack of business investment growth is hobling overall economic outcomes, whilst our housing stock value, and bank balance sheets are artificially being inflated.
In Brisbane and Melbourne these new apartments will represent a far larger increase in the dwelling stock than in Sydney. Furthermore, apartment price and rental growth in Brisbane and Melbourne are relatively subdued – notwithstanding some strengthening in rents in Melbourne of late – and rental vacancy rates are higher than in Sydney (Graph B1). It is therefore foreseeable that these additions to the stock will have a greater effect on housing market conditions in these areas.
Exposures
Potential Losses
Repeating this scenario for developer exposures is challenging, because the exposures are more idiosyncratic and the largest losses can be on incomplete developments. In addition, the average level of developer equity in their apartment projects is not readily available and anecdotal evidence suggests that it varies significantly by building. A simple way to model potential losses on developer lending is to use loss rates in line with those seen on all Australian residential development lending during the financial crisis.
In these situations, the losses to banks would be several times larger than the recent Australian experience. However, Australia is not facing the same economic and financial headwinds as Spain or Ireland did during the financial crisis, where the extent of overbuilding was much greater and prevalent across their entire countries, contributing to very sharp deteriorations in economic conditions. More likely, any oversupply in Australia would be more localised to certain geographic areas, and potential price falls tempered as the population moved to absorb the new (and cheaper) supply of housing in these areas over time.

 As a result, total mortgage backed assets fell 0.37% month on month to $114 billion. Compare this with a peak of $215 billion in June 2007.
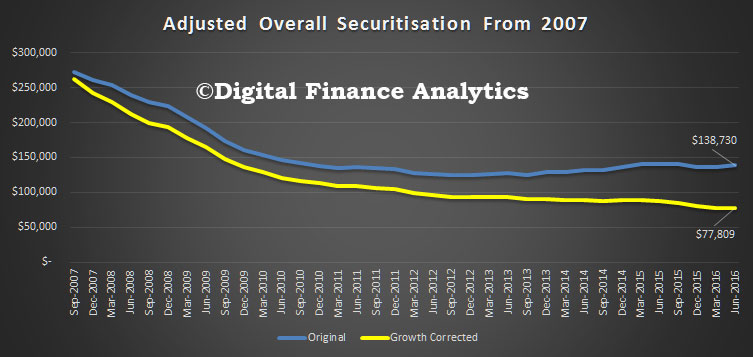 Remembering that bank credit has been growing significantly, the fall is, in real terms, even more stark. The chart above depreciates the total securitisation pool of ~$138 billion by credit growth, from its peak in 2007. It shows that in 2007 terms, the fall is even greater, to ~$78 billion, a significant drop from its peak of $274 billion.
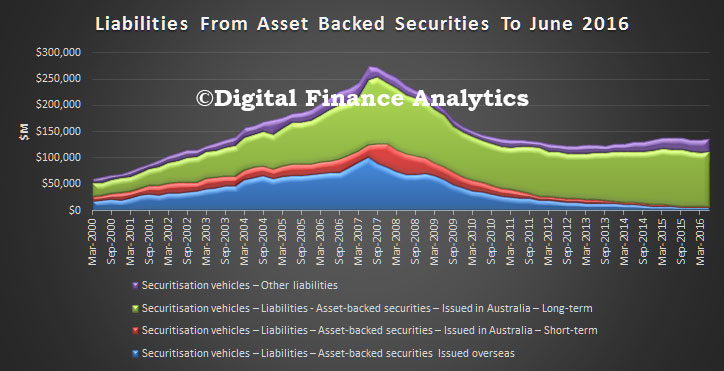 The other significant fact is that now 94% of securitisation deals are being sold in Australia, of which 75% are short term, and 19% long term. Overseas issuance, which peaked in 2007, remains close to their lows, at around 1.6%.
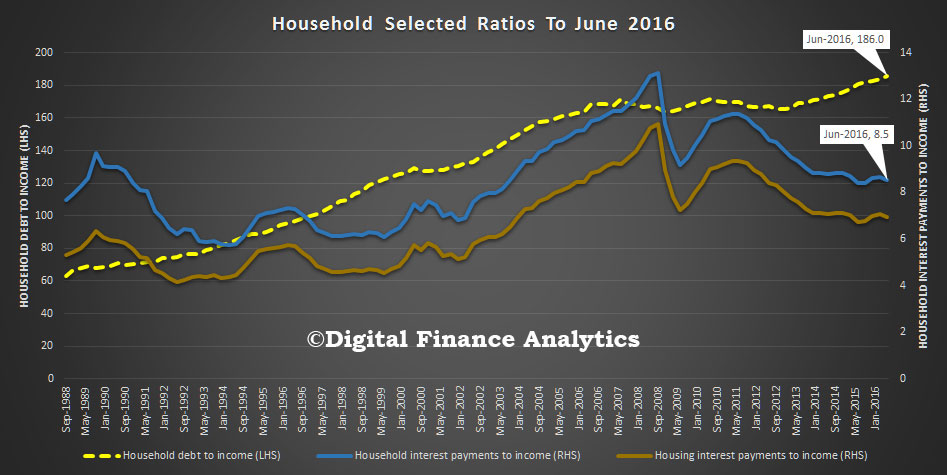 The ratio of household debt to income has risen again now standing at 186, as high as it has ever been. The ratio of income to debt is on average 8.5, and has been tracking lower as interest rates fall.
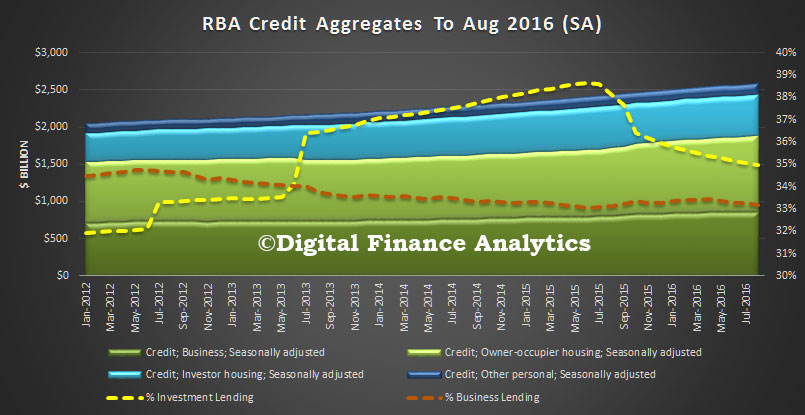 The 12 month growth analysis shows owner occupied loans sitting at 7.6%, investment loans 4.6%, total housing at 6.5% and business lending at 5.7%. All higher than inflation and income growth. Australia is living with ever higher debt.
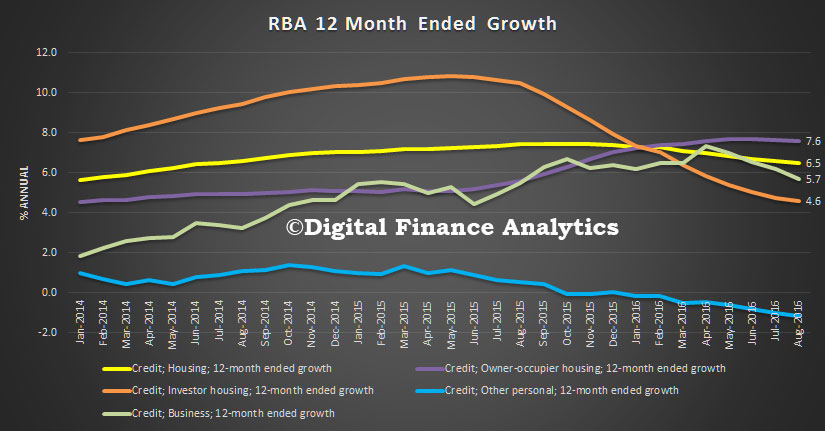 The RBA says: