Jobs Or Working Hours In The Labour Market?

Interesting paper from the RBA, released today, “Jobs or Hours? Cyclical Labour Market Adjustment in Australia.” It looks at how the labour market has adjusted over the economic cycle, and concludes that in recent times reduced job working hours, rather than job cuts have been the order of the day. One reason why measuring underemployment is so vital.

They argue this is because of the more mild downturns, and labour hoarding.

We find that, while both employment and average hours worked tend to adjust over the cycle, the share of labour market adjustment due to changes in average hours worked has increased since the late 1990s. Indeed, the contribution of average hours to the cyclical variability in total hours worked has tripled, from 20 per cent over 1978–98 to 58 per cent over 1999–2016. Such a large increase in the importance of average hours adjustment was not observed in other developed economies.

jogbs-and-hoursSince the late 1990s, a larger share of cyclical labour market adjustment in Australia has come about via changes in average hours worked, as opposed to changes in employment. While empirical evidence is inconclusive (partly due to the difficulty in modelling average hours worked), our view is that the relatively short and shallow economic downturns in the 2000s have played a role in this. Had these downturns been more severe, like the recessions in the 1980s and 1990s, firms eventually may have needed to shed more workers than they did. In other words, it is likely that both employment and average hours tend to adjust in the early stages of a downturn, but relatively more adjustment occurs through employment as the downturn persists and becomes more severe. It is also possible that labour market reforms over recent decades have provided firms with more scope to reduce their use of labour by reducing working hours rather than by redundancies.

We also find that the main driver of the adjustment in average hours during the 2008–09 economic downturn was a reduction in hours worked for employees who remained in the same job (i.e. labour hoarding). Consistent with this, a longer-run historical analysis suggests that changes in the composition of employment have not been the main driver of the decline in average hours during downturns and recessions.

The End of the Commission Remuneration Model In Financial Services?

The wind of change seems to be blowing though the financial services sector as the focus on doing the right thing for customers increases. The industry’s dirty secret is that many in the sector are rewarded on a commission basis for selling products and services, irrespective of whether they are right for the customer concerned. Recent scandals have been all about the interests of the industry coming ahead of consumers, whether employed by the firm, or an “independent” advisor.

commissionThis entrenched practice took root as players sought to boost profit by cross selling and up-selling more products to their customers, and targets, plus commissions became a pretty standard, if undisclosed, practice when working with third party advisors.

Whether a bank teller, a financial advisor, a mortgage broker, or other bank employee; behaviour is likely to be influenced by expectations of personal remuneration. This is not transparent to the consumer, who relies on the advice.

But this week we may be seeing signs of a new set of practices emerging. Westpac has said it will no longer pay sales commissions to bank tellers, but performance will be assessed by customer satisfaction. Changes are also afoot in the sales force too.

From next month we’re planning to remove all product related incentives across our 2,000 tellers in the Westpac branch network. Rather, their incentives will be based entirely on customer feedback about the quality of service they received in the branch.

We have also revisited the way we reward specialised sales roles in our network. We will no longer vary reward values based on different products; but rather our people will be rewarded for meeting the full range of our customers’ needs.

The Hansard record of the new RBA Governor’s comments this week made some interesting points about remuneration in financial services and the cultural issues arising.

Mr THISTLETHWAITE: You mentioned earlier your mandate in terms of financial systems stability. There has been a whole host of scandals in recent years with the banks, particularly with their wealth management arms. It is an issue that this committee is going to inquiry into in the coming months. This is a bit of a left-field question, but, from a regulatory perspective, if you were redesigning our financial system regulation in Australia what would you change?
Dr Lowe: I do not think a whole redesign is required.
Mr THISTLETHWAITE: Would you change anything?
Dr Lowe: APRA is the financial regulator, so it is not the Reserve Bank. And APRA has made many changes to the nature of financial regulation recently—really around capital and liquidity. So I think the finance sector feels like it has gone through a period of very accelerated regulatory change. It is best, probably, to kind of let that settle and see how the system adjusts to it. I sense that you are asking about other types of regulation that really go to the issue of bank culture.
Mr THISTLETHWAITE: Is there anything you want to say about that?
Dr Lowe: I cannot help but agree with you that there have been too many examples of poor outcomes, particularly in the wealth management and insurance industries. That is disappointing to us all.
Maybe I can make two other remarks—and, again, a broader perspective. The Australian bank system has performed well over a couple of decades. We did not have the excessive risk-taking culture in the lead-up to the financial crisis. I think that is really important. If we had a really bad risk-taking culture, we could have ended up in the same situation as many other countries did. Part of it is due to APRA’s good regulation, but the banks did not develop this culture that we saw overseas. So that has given us more stability. Again, that is a first-order point.

In terms of behavioural issues—it is hard. I think it comes down to incentives within the organisations, and that is largely remuneration structures. That is a responsibility of management. And, probably, APRA can play some constructive role in encouraging remuneration structures that create the right incentives within organisations. If there was one thing that I could focus on—it is not my responsibility; it is not the Reserve Bank’s responsibility—is making sure that the remuneration structures within financial institutions promote behaviour that benefits not just the institution but its client.
What I would like to see is, really, banking return to be seen as a strong service profession. I do not know how far away from that we are. Banking, historically, has been a profession—a profession of stewardship, custodians, service, advisory, counsellor. Is not a marketing or product-distribution business; banking is a profession.

I like the Banking and Finance Oath. I do not know whether you have seen this, but a number of people have signed up to this, including me, and I encourage others to do it as well. Its first line is: ‘Trust is the foundation of my profession.’ We have got to move beyond people just signing this oath to actually making that in practice. I do not run a commercial bank. I do not know how to embed within a commercial bank the idea that trust is the foundation of the noble profession that we do. It is largely about incentives and remuneration.

The Australian Bankers Association had previously announced a Independent Review of Product Sales Commissions and Product Based Payments

The final report is expected to provide an overview of product sales commissions and product based payments in retail banking and other industries, identify possible options for better aligning remuneration and incentives so that they do not result in poor customer outcomes and set out actions which may be considered by banks and the banking industry to implement the findings.

This puts the current ASIC remuneration review of mortgage brokers in a new light perhaps. The outcomes are expected in December. However, this review is being done in secret. As we said in an earlier post:

ASIC has evidently released the final scope of its review of remuneration in the mortgage broking industry – but only to industry insiders. According to media, the corporate regulator has confirmed it will review the remuneration arrangements of “all industry participants forming part of the value distribution chain”. This includes lending institutions, aggregation and broking entities, and associated mortgage businesses – such as comparison websites and market based lending websites – and referral and introducer businesses.

But why, we ask, was the scope not publicly disclosed? Why are ASIC seeking input only from industry participants? We agree the remuneration review is required – but the lack of transparency is a disgrace.

Our guess is that commissions will not be banned, and the findings will focus more on better disclosure.

It is worth remembering that before that the changes to FOFA were disallowed in the Senate in late 2014. The changes would have made if easier for employees to receive incentive payments for product sales.

So now the climate appears to be changing. Will other banks follow Westpac’s lead? Will the remuneration review lead to changes to commission structures (especially trails) or a ban? Could we be seeing signs of fundamental cultural change in the industry? And will consumers be better off?

Worth reflecting on the changes which have emerged in the UK.

From April 2016 investment middlemen, including financial advisers and do-it-yourself investment brokers, will no longer be able to accept commission payments from fund companies.

The changes coming into force are the final phase of a series of new rules that started to apply at the start of 2013, which stopped advisers receiving ongoing, or “trail”, commission on new investments.

This rule has applied to brokers since April 2014. Since this date brokers have not been able to receive ongoing trail commission on new businesses, due to the legislative changes.

But until April 2016 commissions could still be deducted from earlier investments. And it is that backlog of investment which, for many, will soon become cheaper.

From April, instead of taking commissions, all middlemen will have to charge an explicit fee, expressed either as an hourly rate or as a percentage of savers’ investment pot.

The new rules were ushered in to remove any potential bias. But – and this is the catch – these old-style payments will not cease for some investors, such as those who went direct to the fund provider, or invested through a bank.

How Best To Measure House Prices

Recently the RBA has been talking about house price metrics, and in their recent outings have been downplaying data from CoreLogic preferring metrics from other sources. Was this a case of selecting the data which best fits with your world view? As we said at the time:

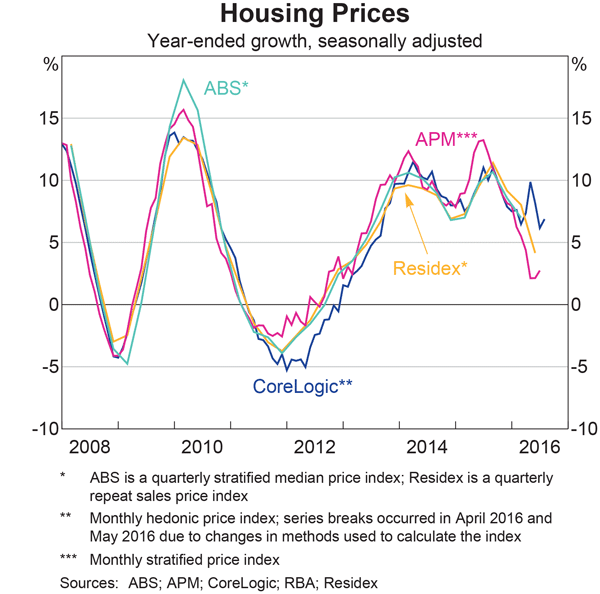
The statistical “fog of war” appears to have descended on Australian home prices, partly fueled by the RBA’s recent statements, and the latest chart pack data. Because of perceived issues with the CoreLogic data series, we see plots from a number of data providers.

housing-pricesToday Tim Lawless from CoreLogic has discussed the issue of metrics in “A refresher on housing market measurements“.  Naturally he defends CoreLogic’s work, but it is also worth reading to see how complex the question actually is. We think the trend is the important perspective. But of course the picture is complicated when metrics are rebaselined without full disclosure.

Housing is Australia’s largest asset class, worth an estimated $6.7 trillion, so it’s important to measure the performance of this very important asset class in an accurate and timely manner. Recently there has been a lot more focus on the measurements of housing market performance, so it’s timely to provide a summary of the primary methods used for measuring housing market performance from a value/pricing perspective.

The complexities of property data

Before we go into the different measures, it’s worthwhile providing a brief refresher on property data which provides some background about why measuring housing market performance is a complex undertaking.

Firstly, compared with the equites markets, housing is an illiquid asset class. Individual properties are transacted, on average, every 8-10 years. The infrequency of transactions implies that the vast majority of residential properties are excluded from most housing market measurements which are reliant on transactional activity.

Secondly, housing is fundamentally nonhomogeneous; dwellings are unique in their characteristics based on their location and attributes, which makes the measurement of price and value shifts more challenging.

Additionally, the quality and timeliness of property data varies remarkably from state to state and between the private sector data providers. State governments collect a base level set of data which needs to be cleaned and augmented with more timely data and additional data sets such as attribute information to ensure a more complete and timely measure of housing markets is derived.

Regardless of the methodology used to measure dwelling price or value shifts, having housing data that is of the highest quality possible is the first and most important step in producing a reliable and accurate measure of the housing market.

CoreLogic collects and maintains the most comprehensive and current property and mortgage database, with more than 4.2 billion decision points across Australia and New Zealand that is growing in size every day. More than 60% of housing market transactions are collected directly from the industry, which provides a much more timely view of the housing market than relying solely on government provided transaction data.

What indicators are available to measure housing market conditions?

Housing market indices range in complexity from a simple median price indicators, which is subject to large amounts of bias and revision, through to a stratified median, repeat sales index and hedonic regression models. Each of these methods will provide different results for measuring price or value shifts across the housing markets.

Outside of these methodological differences, there will be further differences in results based on the data held by each of the private and public sector index providers as well as the way the data is cleaned, the sampling method, what geographic regions are being reported and what time frames the measures are reported across.

Simple median price

The median is simply the middle sales observation across a series of transactions. The median sale price is subject to a range of biases which can skew the middle observation up or down. Bias in median price can be caused by buyer types who are more active or less active in the market (for example, if first home buyers become more active there is likely to be a downwards bias in the median observation due to more transactions occurring at the affordable end of the pricing spectrum). Bias can also be found if there are changes in the types or quality of stock transacting and the median can be very volatile in markets with low turnover or where there are dramatic differences in the quality of housing. The advantage of median price is that it is very simple to compute and is easy to understand and interpret.

Simple median price measures are generally utilised by some of the real estate institutes and are still a common way of reporting price movements at the suburb or postcode level. Simple medians are useful for understanding what the middle observation for pricing is across a particular region over a specified point in time, however they aren’t all that useful for measuring capital gains over time due to the volatility and bias associated with this measure.

Stratified median

The stratified median measure, although still a measure of the middle observation, attempts to overcome the compositional bias of median price measures by dividing the market into separate strata’s, or segments, that are more alike. The Australian Bureau of Statistics, who use a stratified median measure, bases their stratification across dwelling types, the long term median price and socio economic indicators as specified here: . The ABS index is released quarterly after a significant lag and is non-revising.

Domain also use a stratified median approach, however no documentation appears to be publically available on their method or stratification approach. The Domain index is revisionary, however there is no transparency around the level of revision between quarters. Also, Domain do not appear to release their index results in a freely available format online.

The stratified median approach is a substantial improvement over the simple median for measuring price change across the housing market. As outlined in the simple median method, despite attempts to control for bias, the stratified median approach can be affected by changes in buyer activity or inactivity and by changes in the types or quality of dwellings that are transacting in the market.

It is important to note that non revising stratified median indices will not include off the plan sales data if the sale date has occurred more than three months prior to the reporting date. The reason for this is that such data tend to be quite lagged and reported by the Valuer General after settlement, which can occur several years after the sale date.

Repeat sales

A repeat sales index relies on identifying sales pairs and measuring the capital gain across these individual resales. The repeat sales method is very useful for measuring the demonstrated capital gain across individual properties that have resold, however the method excludes all transactions that don’t have a previous sale associated with the property. Inherently, the repeat sales method excludes new properties, which is a significant weakness at a time when a record amount of new housing stock is entering the market place. Additionally, the repeat sales index can be biased by property resales that have been affected by capital works (eg renovations and subdivisions) and can also be biased by properties that are transacted more frequently such as units and investment owned properties which generally have a higher turnover rate.

Residex (which is a CoreLogic owned company) publish a repeat sales index which is revisionary and released quarterly.

Off the plan sales are not accounted for in repeat sales indices as this methodology requires at least two sales for a property to make it eligible for inclusion.

Hedonic regression

The hedonic method of measuring housing market performance aims to track the true value shifts across the overall portfolio of housing, rather than price based movements based on observations of only those properties that have transacted. The hedonic imputation technique, which is used exclusively in Australia by CoreLogic, imputes the value of every Australian dwelling each day, taking into consideration every single data point we knew about the housing market at the point in time of calculation. Factors such as lot size, the number of bedrooms and bathrooms, car spaces and whether the home has a swimming pool or view are some of the hedonic attributes factored into the analysis. Based on a flow of around 1,400 new transactions received each day as well as a constant flow of new attribute data, our most accurate view of the imputed value of the property market is updated each day.

The benefits of a hedonic regression index include the sheer timeliness of the reading (virtually a real time indicator), the lack of any bias that can push the index higher or lower, as well as the fact that the index tracks true value shifts across the entire housing asset class rather than only across those properties that have recently transacted.

CoreLogic provides free public access to a full 12 month back series of the daily hedonic index, as well as a monthly summary of the end of month index results across each capital city by dwelling type. The index is published on the first working day of each month and has been independently peer reviewed and audited, the results of which are published on the CoreLogic web site, along with full documentation of the hedonic method used to build the index.

In summary, there are a variety of measures available to track dwelling prices and values across Australia. Each method presents its own pros and cons and there will always be differences in the results based on the different methods being uitlised, but also based on the differences in data quality, cleaning and sampling techniques, data timeliness, geographic context and time frames of the calculation. Other technical differences will also play out in the data based on specific ways each method treat the underlying data sets. For example, using a settlement date rather than a contact date in the analysis will show a difference in results, particularly at a time when a great deal of off the plan unit sales are flowing into the market where the difference between the contact date and settlement date could be several years.

While there will be divergence in these measurements of price and value changes from period to period, over a longer period, each of the methods used will tend to show broadly similar results. One notable exception is the presence of off the plan transactions, which will cause the hedonic index to diverge from repeat sales and non-revising median indices from time to time. Repeat sales indices and non-revising median indices (in particular based on sales data over the prior quarter) are more likely to broadly track one another because they both exclude off the plan sales.

CoreLogic privately calculates all of the indices described above, however our primary reference for measuring the change in house and unit values is the hedonic regression index thanks to the timeliness of the measure, the absence of any bias in the measurement and the fact that the index measures value growth across the entire housing portfolio rather than only those properties that have transacted.

In order to get a complete understanding of the housing market there is a vast array of other housing market measures that need to be viewed in context with indices that measure price and value movements.  CoreLogic also provides weekly updates on auction markets and clearance rates, private treaty metrics such as average selling time and vendor discounting rates, transaction numbers, listing counts and rental information as some examples.

Additionally the performance of the housing market will vary substantially across the different product types and geographically, so it’s important to analyse the housing market at more granular levels than just capital city dwelling performance.

At CoreLogic, we place the utmost importance on our data and analytics assets.  We dedicate more than $20 million each year in acquiring and maintaining our data sets.  Our collection, analysis and research methods are audited regularly, and we are independent of any real estate, media or banking interests.  CoreLogic continues to grow with over 480 people employed in ten locations in Australia and New Zealand. Over 20,000 customers and 150,000 end users in property, finance and government use CoreLogic services and platform more than 30,000 times a day.

Mortgage Refinance Momentum Remains Strong

Continuing our examination of the latest household survey results, today we look at the refinance segment. This sector of the market is poorly understood, not least because refinance of investment loans are not separately reported in the official statistics.  However, yesterday we got some insights from the new RBA Governor’s handout pack.

It shows that currently more than 30% of all home loan approvals are for refinancing (and this data includes estimates of investor refinancing). This is an all time high.

Graph 12: Refinancing Approvals

Actually, the average term for a home loan is dropping, to below 4 years, and a quarter of the book is churning each year. Here is the reason.

Graph 11: Variable Housing Interest Rates

New loans are being deeply discounted, (compared with rates being paid by loan holders). The RBA says:

The spread between the benchmark SVRs and the lowest available advertised rates has increased in recent years. The difference reflects both advertised and unadvertised discounts. It is not unusual for the discounts to be up to 1½ percentage points. Changes in discounts only affect new borrowers (and not the existing stock of mortgages).

This discounting is supported by lower funding costs.

Graph 13: Cash Rate and Funding Costs

As a result, bank net interest margins are largely unchanged.

Graph 1: Net Interest Margin

The gap is being closed by lower deposit interest rates (other than for long-dated term deposits which the RBA says accounts for about 2% of bank funding only).

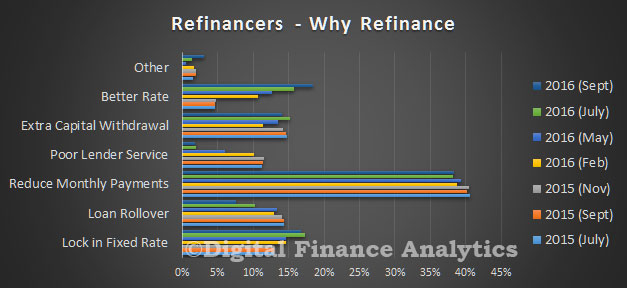
So against this backcloth, the 1.3 million households in the refinance segment are seeking to refinance, driven by the desire to reduce monthly payments (38%), better rates (18%) or to lock in an attractive fixed rate (17%). Poor service only accounts for a small proportion of the transactions.

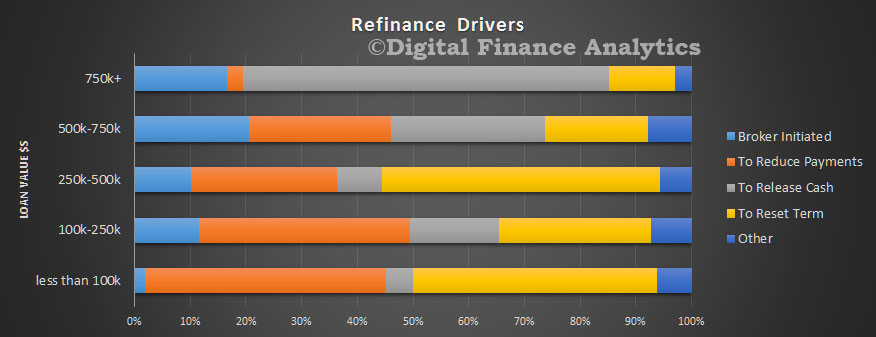
survey-sep-2016-refinanceIf we analyse the drivers by loan size, we see that brokers are tending to be more proactive when the loan is larger, and here refinance is more about releasing cash than just a lower rate. Indeed, much of this cash release is going back into the investment property sector, as we discussed yesterday.

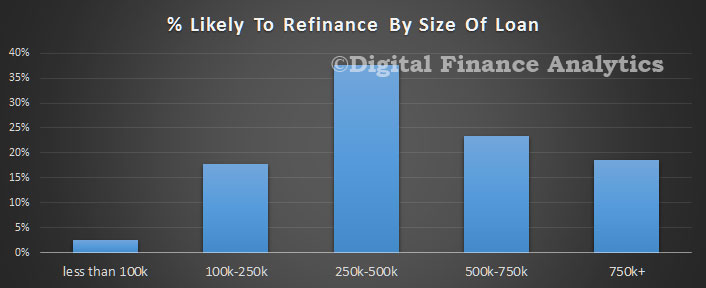
survey-sep-2016-refinance-driversOverall, households with loans in the $250-500k band are most likely to refinance.

survey-sep-2016-re-sizeLarger loans are more likely to be refinanced to an interest only loan.

survey-sep-2016-ref-rtpe So refinancing activity is supporting market momentum. Though total dwelling transfers are down, as shown by the ABS data, released this week, remember that a refinanced transaction would not necessarily be counted.

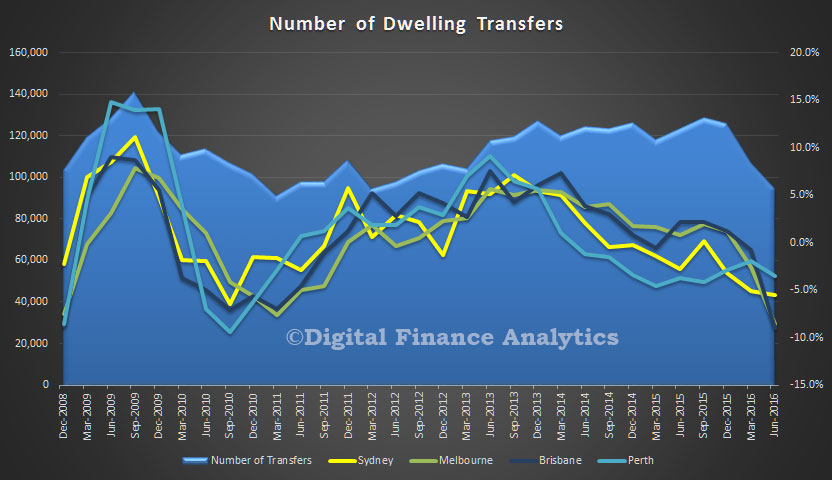
This chart, using ABS data, shows the total transfers of all dwellings (houses and other) and we see a fall in total transfers from Sept 2015, a peak of more than 120,000 to below 100,000 per quarter. Mapping the main centres, and smoothing the data a little, we see that Brisbane fell 10%, Melbourne 9% and Sydney 6%. So beware using this data to argue that housing momentum is easing, it is not that simple. The latest data may also be revised later by the ABS.

transfers-sep-2016So, refinancing is an important element in understanding the current dynamic, and there are more households in the market now for a refinanced deal than a year ago. This explains the adverts “has your home loan got a 3 in front of it?” as shown below….

ybr-advert

Services Employment Up, Economic Outcomes Down

In a CEDA speech “The Changing Nature of the Australian Workforce“, Alexandra Heath, Head of Economic Analysis Department, RBA has highlighted the rise in services sector employment. Much of this is related to a burgeoning healthcare sector, thanks to demographic shifts. Then we see growth in property, and property related sectors. Many other sectors are shrinking.

But we would stress that wages have risen little in the healthcare sector, which is one reason why household income is static, and employment in this sector, (and the property sector), whilst important, does not create new wealth, it merely transfers existing wealth. This lack of new wealth creation is why growth is under pressure. This is a the structural issue which needs to be addressed.

The decline in the share of routine manual jobs in industries such as agriculture and manufacturing as a result of technological change has had a long history (Graph 2). The offsetting increase has been in service sector jobs.

Graph 2
Graph 2: Employment by Industry

The health care & social assistance industry has made the largest contribution to employment growth over the past 15 years or so, and most of this has been in non-routine work (Graph 3). After health care, the two industries that have made the largest contributions to growth in non-routine jobs over this period are professional, scientific & technical services and education & training.

Graph 3
Graph 3: Industry Employment by Skill Type

Some of the increase in health care employment is related to the ageing of the population. Similar demographic trends are also likely to have contributed to the strong increase in employment in social assistance because it includes in-home support services. The stability of relative wages in the health sector over most of the past 15 years suggests that the expansion of demand for health care workers has been more or less met by an increase in the number of people who are able to work in the sector (Graph 4). The vocational education and training system has played an important role in providing qualifications in a range of these occupations, including child care, aged care and occupational therapy.

Graph 4
Graph 4: Changes in Relative Wage Levels

In contrast, education & training, construction and mining have all experienced a trend increase in their relative wages over the past 15 years or so. This suggests that the supply of workers with the right skills has not kept up with the increase in demand from these industries. In the case of mining and construction, the mining boom is an important part of the story (Kent 2016).

The relative wages for professional, scientific and technical services increased over the 5 years to 2013, but have since fallen. One possible explanation for this is that there was some difficulty meeting increasing demand and that supply of qualified workers responded with a lag. Another possibility is that rapid technological change has meant that some of the growth in employment in this industry has been in entirely new jobs that take some time to be captured in some wage measures.


RBA Minutes Add Little

The latest minutes from the RBA tell us very little more than we already knew about the decision to keep the cash rate steady. They did continue to stress the benefit of rate cuts to households overall, because borrowers are more leveraged than savers (as discussed in their recent outing). We think they should be more concerned about the lack of business investment than they appear to be, net of housing.

RBA-Pic2

Domestic Economic Conditions

Members commenced their discussion of domestic economic conditions by noting that the prices of Australia’s commodity exports had increased since the previous meeting and were around 30 per cent above the lows of early this year. Further reductions in production of bulk commodities by high-cost producers in China had contributed to these price increases. Reflecting the rise in commodity prices since earlier in the year, the terms of trade had increased in the June quarter.

The ABS capital expenditure survey and measures of work done on non-residential construction indicated that mining investment had continued to fall in the June quarter, in line with the forecast presented in the August Statement on Monetary Policy. The estimate of nominal investment intentions from the capital expenditure survey implied a further large decline in mining investment in 2016/17, in line with earlier expectations. However, the peak subtraction from GDP growth was still expected to have occurred in 2015/16 and members noted that there had been some signs of an improvement in sentiment in parts of the mining industry.

Members observed that developments in commodity prices and mining investment had continued to have significant effects on economic activity in resource-rich regions of the country and that the effect of the spillovers from the decline in mining investment and commodity prices would persist for some time. The regional differences had been apparent in labour market outcomes. Members noted that a decline in full-time employment since the beginning of the year had been recorded in New South Wales, Western Australia and Queensland, but that part-time employment growth had been broadly based across the country. The relative strength of part-time employment had partly reflected growth in industries that have a higher proportion of part-time jobs, such as household services, although liaison contacts had also reported that employers more generally had been taking a cautious approach to hiring. Forward-looking indicators suggested that employment growth would remain relatively subdued in Western Australia and Queensland but would be stronger elsewhere. Overall, the forward-looking indicators were consistent with little change in the unemployment rate in the coming months; the unemployment rate had fallen slightly in July to 5.7 per cent.

Growth in the aggregate wage price index (WPI) had stabilised at low levels; the private sector WPI had increased by 0.5 per cent in each of the past six quarters. Growth in the WPI had continued to be lowest in the mining-exposed industries and states, although it also looked to have stabilised in these areas.

Members noted that the June quarter national accounts, which would be released the day after the meeting, were expected to record moderate GDP growth. Net exports were expected to have made a smaller contribution to GDP growth following strong growth in resource exports in the March quarter, whereas data released during the meeting indicated that public demand had made a noticeable contribution in the June quarter. Over the first half of the year, GDP growth had been expected to have been close to estimates of potential, which was consistent with the slight change in the unemployment rate that had been observed over that period.

Growth in household consumption was expected to have remained around average in the June quarter. Household perceptions of their personal finances had continued to be above average, although growth in retail sales had declined slightly in recent months. Members discussed the effect of lower interest rates on consumption growth via the cash flow channel of monetary policy. They noted that the positive effect of lower interest rates on the disposable income of borrowing households is larger than the negative effect on the income of lender households, as the average borrower household has two-to-three times more net interest-bearing debt than the average lender household has in net interest-earning assets. In addition, on average, borrower households are likely to be significantly more responsive to changes in income that are related to changes in interest rates because they are more likely to be liquidity constrained. Members noted that, since the global financial crisis, borrower households have been likely to use more of an increase in their cash flow from any source to prepay their debt, which might imply a delay in the response of consumption spending to lower interest rates.

Private residential building approvals had increased in July, to be around the high levels observed in 2015, and there continued to be a significant amount of work in the pipeline. Members noted that this could be expected to support high levels of dwelling investment for some time.

Conditions in established housing markets had generally eased over 2016. Growth in housing prices had declined at the national level and across most capital cities over the past year, although there remained considerable variation by location. Housing prices had been declining in year-ended terms in Perth for some time. In the rental market, inflation had remained around historical lows and had also eased across most capital cities, most notably in Perth, where rents had continued to decline. The aggregate rental vacancy rate had drifted higher and was close to its long-run average.

Other indicators for the housing market had also generally pointed to weaker conditions than a year earlier. In the established housing market, the number of auctions had declined and remained lower than a year earlier, even though auction clearance rates had increased of late (particularly in Sydney). In the private treaty market – where, nationally, over 80 per cent of transactions occur – turnover had also declined since the previous year and the average number of days that a property was on the market had been on an upward trend. Members noted that sales of new properties were included in the turnover data, but that there might be measurement problems related to the long lag between purchasing and settling new properties bought off the plan, which could lead to revisions. Finally, in recent months the value of housing loan approvals had been broadly steady and housing credit growth had been lower than a year earlier, consistent with the earlier tightening in lending standards and low turnover.

Business investment had fallen further in the June quarter, driven by a decline in mining investment in line with earlier expectations. The ABS capital expenditure survey also indicated that non-mining business investment had been little changed over the past couple of years. Members noted that uncertainty about future demand growth still appeared to be weighing on non-mining business investment. The pipeline of non-residential construction work had remained low, although non-residential approvals had increased a little in recent months and survey measures of business conditions and capacity utilisation had remained above their long-run averages. Growth in business credit had eased a little, although non-mining profits looked to have increased.

Statement on the Conduct of Monetary Policy

The Treasurer and Governor of the Reserve Bank have reaffirmed the statement on the Conduct of Monetary Policy.  Both the Reserve Bank and the Government agree that a flexible medium-term inflation target is the appropriate framework for achieving medium-term price stability. They agree that an appropriate goal is to keep consumer price inflation between 2 and 3 per cent, on average, over time.

RBA-Pic2

The Statement on the Conduct of Monetary Policy (the Statement) has recorded the common understanding of the Governor, as Chair of the Reserve Bank Board, and the Government on key aspects of Australia’s monetary and central banking policy framework since 1996.

The Statement seeks to foster a sound understanding of the nature of the relationship between the Reserve Bank and the Government, the objectives of monetary policy, the mechanisms for ensuring transparency and accountability in the way policy is conducted, and the independence of the Reserve Bank.

The centrepiece of the Statement is the inflation targeting framework, which has formed the basis of Australia’s monetary policy framework since the early 1990s.

The Statement has also been updated over time to reflect enhanced transparency of the Reserve Bank’s policy decisions and to record the Bank’s longstanding responsibility for financial system stability.

Building on this foundation, the current Statement reiterates the core understandings that allow the Bank to best discharge its duty to direct monetary policy and protect financial system stability for the betterment of the people of Australia.

Relationship between the Reserve Bank and the Government

The Reserve Bank Governor, its Board and its employees have a duty to serve the people of Australia to the best of their ability. In the carrying out of their statutory obligations, through public discourse and in domestic and international forums, representatives of the Bank will continue to serve the best interests of the people of Australia with honesty and integrity.

The Governor and the members of the Reserve Bank Board are appointed by the Government of the day, but are afforded substantial independence under the Reserve Bank Act 1959 (the Act) to conduct the monetary and banking policies of the Bank, so as to best achieve the objectives of the Bank as set out in the Act.

The Government recognises and will continue to respect the Reserve Bank’s independence, as provided by the Act.

The Government also recognises the importance of the Reserve Bank having a strong balance sheet and the Treasurer will pay due regard to that when deciding each year on the distribution of the Reserve Bank’s earnings under the Act.

New appointments to the Reserve Bank Board will be made by the Treasurer from a register of eminent candidates of the highest integrity maintained by the Secretary to the Treasury and the Governor. This procedure ensures only the best qualified candidates are appointed to the Reserve Bank Board.

Objectives of Monetary Policy

The goals of monetary policy are set out in the Act, which requires the Reserve Bank Board to conduct monetary policy in a way that, in the Reserve Bank Board’s opinion, will best contribute to:

  1. the stability of the currency of Australia;
  2. the maintenance of full employment in Australia; and
  3. the economic prosperity and welfare of the people of Australia.

These objectives allow the Reserve Bank Board to focus on price (currency) stability, which is a crucial precondition for long-term economic growth and employment, while taking account of the implications of monetary policy for activity and levels of employment in the short term.

Both the Reserve Bank and the Government agree on the importance of low and stable inflation.

Effective management of inflation to provide greater certainty and to guide expectations assists businesses and households in making sound investment decisions. Low and stable inflation underpins the creation of jobs, protects the savings of Australians and preserves the value of the currency.

Both the Reserve Bank and the Government agree that a flexible medium-term inflation target is the appropriate framework for achieving medium-term price stability. They agree that an appropriate goal is to keep consumer price inflation between 2 and 3 per cent, on average, over time. This formulation allows for the natural short-run variation in inflation over the economic cycle and the medium-term focus provides the flexibility for the Reserve Bank to set its policy so as best to achieve its broad objectives, including financial stability. The 2-3 per cent medium-term goal provides a clearly identifiable performance benchmark over time.

The Governor expresses his continuing commitment to the inflation objective, consistent with his duties under the Act. For its part the Government endorses the inflation objective and emphasises the role that disciplined fiscal policy must play in achieving medium-term price stability.

Consistent with its responsibilities for economic policy as a whole, the Government reserves the right to comment on monetary policy from time to time.

Transparency and Accountability

Transparency in the Reserve Bank’s views on economic developments and their implications for policy are crucial to shaping inflation expectations.

The Reserve Bank takes a number of steps to ensure the conduct of monetary policy is transparent. These steps include statements announcing and explaining each monetary policy decision, the release of minutes providing background to the Board’s policy deliberations, and commentary and analysis on the economic outlook provided through public addresses and regular publications such as its quarterly Statement on Monetary Policy and Bulletin. The Reserve Bank will continue to promote public understanding in this way.

In addition, the Governor will continue to be available to report twice a year to the House of Representatives Standing Committee on Economics, and to other Parliamentary committees as appropriate.

The Treasurer expresses support for the continuation of these arrangements, which reflect international best practice and enhance the public’s confidence in the independence and integrity of the monetary policy process.

Financial Stability

Financial stability, which is critical to a stable macroeconomic environment, is a longstanding responsibility of the Reserve Bank and its Board.

The Reserve Bank promotes the stability of the Australian financial system through managing and providing liquidity to the system, and chairing the Council of Financial Regulators (comprising the Reserve Bank, Australian Prudential Regulation Authority, the Australian Securities and Investments Commission and the Treasury).

The Payments System Board has explicit regulatory authority for payments system stability. In fulfilling these obligations, the Reserve Bank will continue to publish its analysis of financial stability matters through its half-yearly Financial Stability Review.

In addition, the Governor and the Reserve Bank will continue to participate, where appropriate, in the development of financial system policy, including any substantial Government reviews, or international reviews, of the financial system itself.

The Reserve Bank’s mandate to uphold financial stability does not equate to a guarantee of solvency for financial institutions, and the Bank does not see its balance sheet as being available to support insolvent institutions. However, the Reserve Bank’s central position in the financial system, and its position as the ultimate provider of liquidity to the system, gives it a key role in financial crisis management. In fulfilling this role, the Reserve Bank will continue to coordinate closely with the Government and with the other Council agencies.

The Treasurer and the Governor express their support for these longstanding arrangements continuing.

Household Cash Flows and Monetary Policy

The RBA released the September 2016 edition of the Bulletin today. The article “The Household Cash Flow Channel of Monetary Policy by Helen Hughson, Gianni La Cava, Paul Ryan and Penelope Smith is interesting, but possibly flawed.

It looks at the impact of households when the cash policy rate is changed. Lower interest rates can encourage households to save less and bring forward consumption from the future to the present (the inter-temporal substitution channel).

Lower interest rates can also lift asset prices, such as housing prices, and the resulting increase in household wealth may encourage households to spend more (the wealth channel). Additionally, lower interest rates reduce the required repayments of borrowing households with variable-rate debt, resulting in higher cash flows and potentially more spending, particularly for households that are constrained by the amount of cash they have available. At the same time, lower interest rates can reduce the interest earnings of lending households, which may, in turn, lead to lower cash flows and less spending for these households. These last two channels together are typically referred to as ‘the household cash flow channel’.

The analysis in this article focuses on a fairly narrow definition of the cash flow channel. It examines the direct effects of interest rates on interest income and expenses, but abstracts from monetary policy changes that have an indirect cash flow effect by influencing other sources of income, such as labour or business income.

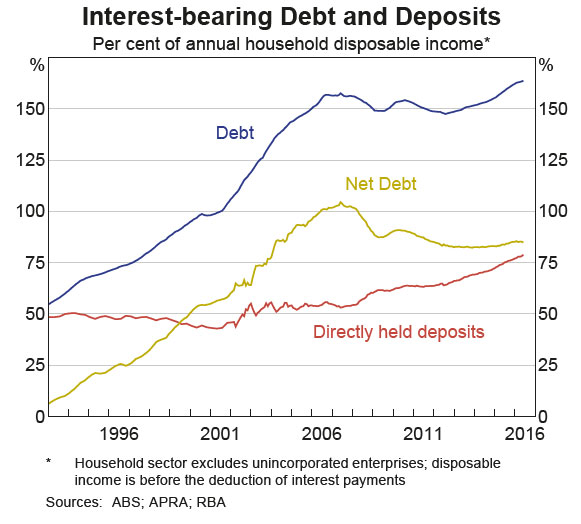
rba-sep-2016-1Household disposable income, or cash flow, comprises wages and salaries, property income (including interest paid on deposits) and transfers, less taxes and interest payments on debt. The household sector in Australia holds more interest bearing debt than interest earning assets. Indeed, households have increased their debt holdings at a rapid pace since the early 1990s, mainly due to an increase in mortgage debt. For the household sector as a whole, the level of household debt now exceeds the level of directly held interest earning deposits by a significant margin. However, since the mid 2000s, slower growth in household debt and increases in interest-earning deposit balances (including balances held in mortgage offset accounts) has led to a decline in net interest bearing debt. This means that the household sector is a net payer of interest. Household net interest payments increased through the 1990s and early 2000s, mainly reflecting the rise in net household debt, but trended down from 2007 as interest rates and net debt declined.

The data shown above do not account for interest earning assets held in managed superannuation accounts, which have increased substantially since the early 1990s. The majority of these assets cannot be accessed until retirement.

This article finds evidence for both the borrower and lender cash flow channels, but the borrower channel is estimated to be the stronger channel of monetary transmission. One reason for this is that while there are roughly similar shares of borrower and lender households in the Australian economy, the average borrower holds two to three times as much net debt as the average lender holds in net liquid assets. Another reason is that the sensitivity of spending to changes in interest-sensitive cash flow is estimated to be larger for borrowers than for lenders based on statistical analysis using household-level data.

Overall, the estimates suggest that the cash flow channel is an important channel of monetary transmission; the central estimates indicate that lowering the cash rate by 100 basis points is associated with an increase in aggregate household income of around 0.9 per cent, which would, in turn, increase household expenditure by about 0.1 to 0.2 per cent through the cash flow channel.

We have a couple of issues with their analysis. First, recent events have shown that when the cash rate is cut, the benefit is not necessarily passed through to households, thanks to weak competition in the banking sector. When it is, the benefit is often not equally shared between borrowers and savers, and not all savers benefit equally. In fact, looking at the trends in recent years, savers have been taken to the cleaners, as banks repair and protect their margins. So benefits are overstated.

The second issue is households will be impacted by the confidence surrounding a rate move. If they become less confident, they will be less likely to spend, preferring to save for later. So a rate cut often lowers household spending – this is one of the significant reversals we have seen recently – and central banks are still trying to get to grips with the implications. The link between low interest rates and household spending, yet alone broader economic growth appears broken.

So, whilst the article is a good attempt, we think it overstates the benefits of cash rate cuts in the current cycle.

The New Regulatory Framework for Surcharging of Card Payments

“Where consumers see a card surcharge, they should check to see what non-surcharged methods of payment are available. Before paying a surcharge, they should think about whether any benefits from using that payment method outweigh the cost of the surcharge; if not they should consider switching to an alternative payment method. This will not only save them money, it will help keep costs down for businesses and will put pressure on card schemes to keep their charges low”. This was Tony Richards, Head of Payments Policy Department RBA, conclusion when he  spoke at the 26th Annual Credit Law Conference and discussed the revised card payment surcharging regime.

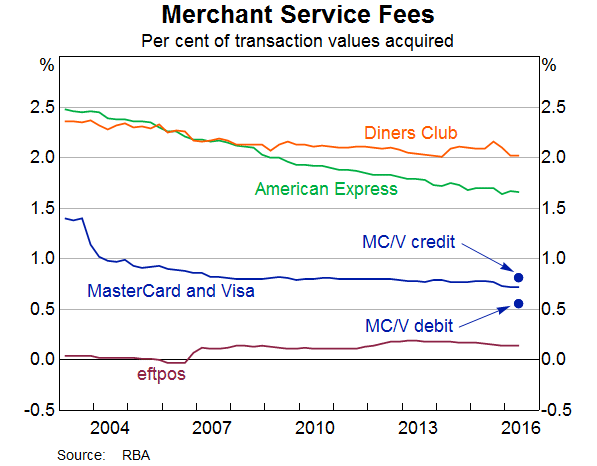
In his speech he started by looking at data on average merchant service fees (or MSFs) show that there are very large differences in the cost of different card systems for merchants. These costs ranged from an average of just 0.14 per cent of transaction value for eftpos in the June quarter to about 2 per cent of transaction value for Diners Club. For MasterCard and Visa transactions, the average cost to merchants of debit cards was 0.55 per cent of transaction value, while the average cost of credit card transactions was 0.81 per cent. The average cost of American Express cards was 1.66 per cent of transaction value.

But these averages mask significant variation across different merchants. Many merchants pay up to 1–1½ per cent on average for MasterCard and Visa credit card transactions. And it is not unusual for merchants to pay 2–3 per cent to receive an American Express card payment.

Graph 1: Merchant Service Fees

Then he discussed five key elements of the new framework contained in the Bank’s new surcharging standard and the Government’s amendments to the Competition and Consumer Act.

First, the new framework preserves the right of merchants to surcharge for more expensive cards, but it does not require them to do so. Under the framework, a merchant that decides to surcharge a particular type of card may not surcharge above their average cost of acceptance for that card type.

For example, if on average it costs a merchant 1 per cent of the value of a transaction to receive a Visa credit card payment, the merchant may apply a surcharge of up to 1 per cent for that type of card. The merchant would not, however, be able to apply the same 1 per cent surcharge if the customer chose instead to pay with a debit card that was less costly to the merchant.

Second, the definition of card acceptance costs that can be included in a card surcharge has been narrowed. Acceptable costs will be limited to fees paid to the merchant’s card acquirer (or other payments facilitator) and a limited number of other documented costs paid to third parties for services directly related to accepting the particular type of card. A merchant’s internal costs cannot be included in a surcharge.

Third, a merchant that wishes to surcharge will typically have to do so in percentage terms rather than as a fixed-dollar amount. In the airline industry, this means that surcharges on lower-value airfares have been reduced significantly.

Fourth, the Government has given the ACCC investigation and enforcement powers over cases of possible excessive surcharging.

The Bank’s standard and the ACCC’s enforcement powers apply to payment surcharges in six card systems that have been designated by the Reserve Bank – eftpos, the MasterCard debit and credit systems, Visa’s debit and credit systems, and the American Express companion card system. However, Reserve Bank staff have been in discussions with other card systems that have not been designated and we expect that those systems will all be including conditions in their merchant agreements that are similar to the limits on surcharges under the Bank’s standard. This will mean that merchants that wish to surcharge on payments in these other systems will be contractually bound to similar surcharging caps to those that apply to the regulated systems.

Fifth, surcharging in the taxi industry – which is subject to significant regulation in many other aspects – will remain the responsibility of state taxi regulators. Until recently, surcharges of 10 per cent were typical in that industry. However, authorities in five of the eight states and territories have now taken decisions to limit surcharges to no more than 5 per cent. As new payment methods and technologies emerge, the Bank expects that it will be appropriate for caps on surcharges to be reduced below 5 per cent. The Government and the Bank will continue to monitor developments in the taxi industry with a view to assessing whether further measures are appropriate.

The first stage of implementation of the surcharging reforms took effect on 1 September and covers surcharging of card payments by large merchants. Merchants are defined as large if they meet certain tests in terms of their consolidated turnover, balance-sheet size or number of employees. The framework will take effect for other, smaller merchants in September 2017.

There are a few reasons for the delayed implementation for smaller merchants. Most importantly, these merchants are less likely to have a detailed understanding of their payment costs. Since the new framework involves enforcement by the ACCC, the Bank considered it important to ensure that such merchants have simple, easy-to-understand monthly and annual statements that show their average payment costs for each of the card systems subject to the Bank’s standard. Accordingly, as part of the new regulatory framework, acquirers and other payment providers must provide merchants with such statements by mid 2017. All merchants will be required to comply with the new surcharging framework from September 2017 and ACCC enforcement will apply also to smaller merchants from that point.

Given the new framework has only been effective for two weeks, it is too early to be definitive about how the new surcharging regime applying to large merchants has affected the surcharging behaviour of those merchants. However, based on some corporate announcements and an initial survey of some websites, I think it is possible to make six initial observations.

First, and most prominently, the major domestic airlines have moved away from fixed-dollar surcharges to percentage-based surcharging. This will result in a very significant reduction in surcharges payable on lower-value airfares. The two full-service airlines have introduced surcharges for on-line payments of 1.3 per cent for credit cards and 0.6 per cent for debit cards. A passenger wishing to pay for a $100 domestic airfare by card will now pay a surcharge of $1.30 or 60 cents, as opposed to a surcharge of up to $7-8 previously. Surcharges on some high-value airfares may rise with the shift to percentage-based surcharges. However, the airlines have implemented caps on surcharges of $11 for domestic fares and $70 for international fares, indicating that they continue to prefer to not pass on their full payment costs on purchases of more expensive tickets.

Second, there does not appear to have been any increase in the prevalence of surcharging. It remains the case that companies that face relatively low merchant service fees are tending not to surcharge, while those businesses which receive a high proportion of expensive cards are more likely to surcharge.

Third, the surcharge rates for credit cards that have been announced show significant variation, which is consistent with other evidence that there is a lot of variation in the merchant service fees faced by different businesses. In the case of the Qantas group, for example, Qantas is charging a credit card surcharge of 1.3 per cent while Jetstar – which presumably receives fewer high-cost cards – is charging a surcharge of 1.06 per cent.

Fourth, as required by the Australian Consumer Law, merchants that have announced changes to their surcharges are continuing to offer non-surcharged means of payment. In the face-to-face environment, this typically includes cash, eftpos and sometimes MasterCard and Visa debit cards. In the on-line environment, it typically includes payments via BPAY, POLi or direct debit, which are typically low-cost for merchants.

Fifth, while there are still many instances of ‘blended’ credit card surcharges, there are some early signs of greater discrimination in surcharges. Blending refers to the practice of charging the same surcharge across a number of systems regardless of their cost – say across the MasterCard, Visa and American Express credit systems.

The new framework allows merchants to set the same surcharge for a number of different payment systems, provided that the surcharge is no greater than the average cost of acceptance of the lowest-cost of those systems. For example, if a merchant accepts cards from two credit card systems, which have average costs of acceptance of 1 per cent and 1.5 per cent, it can set separate surcharges of up to 1 per cent and 1.5 per cent, respectively. If it wishes to set a single surcharge, it cannot average the costs and set a 1.25 per cent surcharge for both systems, since it would be surcharging one of those systems excessively. In this example, the maximum common surcharge that could be charged would be 1 per cent.

While I think we are already seeing some reduction in the practice of blended surcharging, it is likely that we will see this trend continue from mid 2017 when new rules on the interchange fees exchanged between banks for card transactions take effect. Without wishing to go into details, the Bank will for the first time be placing a cap on the maximum interchange fee that can be paid on any card transaction. This will significantly reduce the cost of MasterCard and Visa payments for those merchants which currently receive a high proportion of high-interchange cards.

The sixth change has been in the event ticketing industry, where it was previously very difficult to avoid a card surcharge in the on-line environment. Given this, the ACCC had already required the major ticketing companies to show their surcharges as a separate component within their headline, up-front pricing. Effective 1 September, the two major companies have now removed their card surcharges and are now quoting a simple, single price for all payment methods.


RBA’s View, “After the Boom”

RBA Assistant Governor (Economic) Christopher Kent, spoke at the Bloomberg Breakfast today and gave a comprehensive, if myopic, summary of the current Australian economic position though the boom years, and into the current realignments. There was no discussion of the high household debt and the rapid rise in home prices. He concluded:

The pattern of adjustment of the Australian economy to the decline in the terms of trade and mining investment is generally consistent with what we had anticipated. However, the decline in the terms of trade was larger than expected. In response, there has been significant adjustment in a range of market ‘prices’ – including wages and the nominal exchange rate, although the exchange rate has depreciated a little less than otherwise given global developments. Monetary policy has also responded, with interest rates reduced to low levels. So while mining investment and nominal GDP growth have both been weaker than the forecasts of a few years ago and, more recently, inflation has been a bit weaker than expected, growth in the non-mining economy has picked up and been a bit better than earlier anticipated. Indeed, of late, real GDP growth has been a bit stronger and the unemployment rate a little lower than earlier forecast.

In many respects, the adjustment to the decline in mining investment and the terms of trade has proceeded relatively smoothly. The Australian economy has performed well compared to other advanced economies (Graph 11). Moreover, the drag on growth from declining mining investment is now waning and the terms of trade are forecast to remain around their current levels.

Graph 11
Graph 11: Australia’s Relative Economic Performance

Of course our forecasts are subject to the usual range of uncertainty. But, given that commodity prices have increased substantially over the course of this year, some stability in the terms of trade from here on seems more plausible than it has for some time. Developments in China are likely to continue to have an important influence on commodity prices, given China’s role as both a major producer and consumer of many commodities. For this reason the outlook for the Chinese economy is a key source of uncertainty for the Australian economy.

If commodity prices were to stabilise around current levels, that would be a marked change from recent years. Also, the end of the fall in mining investment is coming into view. The abatement of those two substantial headwinds suggests that there is a reasonable prospect of sustaining growth in economic activity, which would support a further gradual decline in the unemployment rate. There is also a good prospect that the growth in wages and the rate of inflation will gradually lift over the period ahead. That’s what’s implied by our central forecasts.