RBA cash rate unchanged at 1.75 per cent

Today’s RBA note highlights that inflation will remain low for some time. This is a problem lodged firmly in many economies with ever lower cash rates. Assuming the RBA  sticks to their 2-3% target, this leaves the door open for another rate cut. However, we should also question whether even lower rates would have a net positive impact on growth, as savers would take another hit, businesses would be no more willing to borrow, whilst home lending would be stimulated further and it could also stoke investor housing as capital growth is still in play. All up, not a nice cocktail, when incomes are static or falling in real terms. Perhaps some latitude on the inflation target would make more sense.

At its meeting today, the Board decided to leave the cash rate unchanged at 1.75 per cent.

The global economy is continuing to grow, at a lower than average pace. Several advanced economies have recorded improved conditions over the past year, but conditions have become more difficult for a number of emerging market economies. China’s growth rate has moderated further, though recent actions by Chinese policymakers are supporting the near-term outlook.

Commodity prices are above recent lows, but this follows very substantial declines over the past couple of years. Australia’s terms of trade remain much lower than they had been in recent years.

Financial markets have been volatile recently as investors have re-priced assets after the UK referendum. But most markets have continued to function effectively. Funding costs for high-quality borrowers remain low and, globally, monetary policy remains remarkably accommodative. Any effects of the referendum outcome on global economic activity remain to be seen and, outside the effects on the UK economy itself, may be hard to discern.

In Australia, recent data suggest overall growth is continuing, despite a very large decline in business investment. Other areas of domestic demand, as well as exports, have been expanding at a pace at or above trend. Labour market indicators have been more mixed of late, but are consistent with a modest pace of expansion in employment in the near term.

Inflation has been quite low. Given very subdued growth in labour costs and very low cost pressures elsewhere in the world, this is expected to remain the case for some time.

Low interest rates have been supporting domestic demand and the lower exchange rate since 2013 is helping the traded sector. Financial institutions are in a position to lend and credit growth has been moderate. These factors are all assisting the economy to make the necessary economic adjustments, though an appreciating exchange rate could complicate this.

Indications are that the effects of supervisory measures have strengthened lending standards in the housing market. Separately, a number of lenders are also taking a more cautious attitude to lending in certain segments. Dwelling prices have risen again in many parts of the country over recent months. But considerable supply of apartments is scheduled to come on stream over the next couple of years, particularly in the eastern capital cities.

Taking account of the available information, the Board judged that holding monetary policy steady would be prudent at this meeting. Over the period ahead, further information should allow the Board to refine its assessment of the outlook for growth and inflation and to make any adjustment to the stance of policy that may be appropriate.

Home Lending Accelerates In May To Another Record

The RBA released their Financial Aggregates for May 2016. Total housing grew by 0.5% in May, compared with 0.4% in April. Business lending grew by 0.3%, compared with 0.8% in April. Personal credit fell again by 0.1%. Housing lending overall lifted by $7.5bn, of which $6.5 bn was for owner occupation and $0.9bn for investor loans. Total housing loans are now $1.56 trillion, another record and comprise 61% of all loans outstanding.

May-Credit-Agg-2016Annual growth rates for home lending is 6.5%, compared with 6.2% in May 2015, Business was 7.1%, compared with 5.3% last year, and Personal lending was down 1.1% to May 2016, compared with up 1.1% this time last year.

May-Credit-Agg-Growth--2016A further $1.1 bn of loans were switched between owner occupied and investment housing loan categories.

Following the introduction of an interest rate differential between housing loans to investors and owner-occupiers in mid-2015, a number of borrowers have changed the purpose of their existing loan; the net value of switching of loan purpose from investor to owner-occupier is estimated to have been $41 billion over the period of July 2015 to May 2016 of which $1.1 billion occurred in May. These changes are reflected in the level of owner-occupier and investor credit outstanding. However, growth rates for these series have been adjusted to remove the effect of loan purpose changes.

Charging for credit and debit card use may become the norm under new rules

From The Conversation.

New standards on how much businesses can surcharge their customers for credit or debit card purchases start in September. However, it’s not clear how the rules will be policed and whether this will lead to all businesses enforcing a surcharge, rather than just those who choose to.

The Reserve Bank of Australia (RBA) has revised the regulations, aiming to limit the amount merchants can surcharge customers for paying by credit or debit cards. The new rules will initially apply to large merchants, defined as those employing over 50 staff, as these businesses are seen to be overcharging the most.

Businesses have been able to add on surcharges to these type of purchases in Australia since January 2003. This was part of RBA regulatory interventions in the first place, as it originally allowed merchants to surcharge in order to recover the costs of accepting card payments. The surcharges can be ad valorem (in proportion to the value of the transaction) or a fixed dollar amount.

A current example is that taxi fares using a Cabcharge terminal, whether they be paid by charge, credit or debit card, are surcharged at the same ad valorem level of 5%, as a processing fee. Not all the goods and services suppliers who accept card payments chose to impose surcharges on their customers, but a significant and seemingly ever increasing of them do surcharge.

The Australian airlines are well known for their fixed dollar surcharges. Qantas charges a card payment fee (per passenger, per booking) of $2.50 for debit and $7.00 for credit, on domestic flights and $10 for debit and $30 for credit, on international flights.

JetStar charge a booking and service fee (per passenger, per flight) of $8.50 domestic and up to $12.50 for international, whilst Virgin charges a Fee of $7.70 for payments made by credit or debit card. These examples of surcharging have caused much angst amongst consumers and the recent Financial System Inquiry had over 5,000 submissions to its final report, complaining about surcharging, particularly by airlines.

But how will the new standards be enforced? In February, The Australian Competition and Consumer Commission (ACCC) was given the power to issue infringement notices worth up to just over $100,000 to listed corporations who charge their customers excess payment card surcharges

These are defined as charges that exceed the costs of acceptance of payment cards. It remains to be seen if the size of these penalties deters merchants from excessive surcharging.

In May, the RBA published new standards as to the average cost a merchant is permitted to charge for accepting credit or debit cards. These apply to the following so-called card schemes, EFTPOS; MasterCard credit and debit; Visa credit and debit and American Express companion cards, issued by Australian banks.

Under the new rules the average cost of accepting a debit or credit card is defined in percentage terms of cost of the transaction. This will vary by merchant, but it means that merchants will not be able to levy fixed dollar surcharges.

The permitted surcharge for an individual merchant will be based on an average of their card costs over a 12 month period. In the interests of transparency, the financial institution who processes each merchant’s transactions, will be required to provide regular statements of the average cost of acceptance for each of the card schemes.

This information will of course also be important for the ACCC in any cases where enforcement is required if merchants are surcharging excessively.

Now that surcharges are well defined by the RBA, the risk is that surcharging will become a normal extra charge like GST, an unintended consequence of the new rules. Also why should merchants be allowed to charge their customer a surcharge for such payments, which are surely just another cost of doing business, just as is their utility bills and employee wages?

The ACCC is currently finalising guidance material for consumers and merchants which will provide further information on the ACCC’s enforcement role and how consumers can make complaints if they believe that a surcharge is excessive.

Surcharges on card payments have certainly already provoked rage amongst consumers, the final question is, will the next iteration of surcharge standards make surcharging the norm?

Author: Steve Worthington, Adjunct Professor, Swinburne University of Technology

Is The Root Cause Of High House Prices What You Think It Is?

A snapshot of data from the RBA highlights the root cause of much of the economic issues we face in Australia. Back at the turn of the millennium, banks were lending relatively more to businesses than to households. The ratio was 120%. Roll this forward to today, and the ratio has dropped to below 60%. In other words, for every dollar lent now it is much more likely to go to housing than to business. This is a crazy scenario, as we have often said, because lending to business is productive – this generates real productive growth – whilst lending for housing simply pumps up home prices, bank balance sheets and household balance sheets, but is not economically productive to all.

Lending-MixThere are many reasons why things have changed. The finance sector has been deregulated, larger companies can now access capital markets directly and so do not need to borrow from the bank, generous tax breaks (negative gearing and capital gains) have lifted the demand for loans for housing investment, and the Basel capital ratios now make it much cheaper for banks to lend against secured property compared to business. In fact the enhanced Basel ratios were introduced in the early 2000’s and this is when we see lending for housing taking off.

So how much of the mix is explained by tax breaks for investors? If we look at the ratio of home lending for owner occupation, to home lending for investment, there has been an increase. In 2000, it was around 45%, now its 55% (with a peak above 60% last year). This relative movement though is much smaller compared with the switch away from lending to business.  Something else is driving it.

RBA-Mix-HousingWe therefore argue that whilst the election focus has been on proposed cuts to negative gearing and capital gains versus a company tax cut, the root cause issue is still ignored. And it is a biggie. The international capital risk structures designed to protect depositors, is actually killing lending to business, because it makes lending for housing so much more capital efficient. Whilst recent changes have sought to lift the capital for mortgages at the margin, it is still out of kilter. As a result, banks seek to out compete for mortgages and offer discounts and other incentives to gain share, whilst lending to business is being strangled. This is exacerbated by companies being more risk adverse, using high project hurdle thresholds (despite low borrowing rates) and smaller businesses being charged relatively more – based on risk assessments which are directly linked to the Basel ratios. Our SME surveys underscore how hard it is for smaller business to get loans at a reasonable price.

The run up in house prices is a direct result of more available mortgage funding, and this in turn leaves first time buyers excluded from the market. But it is too simple to draw a straight line between negative gearing and first time buyer exclusion. The truth is much more complex.

We are not convinced that a corporate tax cut, or a further cut in interest rates will stimulate demand from the business sector. Nor will reductions in negative gearing help that much. We need to re-balance the relative attractiveness of lending to business versus lending for housing.  The only way to do this (short of major changes to the Basel ratios) is through targeted macro-prudential measures. In essence lending for housing has to be curtailed relative to lending to business. And that is a whole new box of dice!


Income, Credit and Home Prices Out of Kilter

In this post we combine the latest data from the RBA and ABS, and our own analysis to look at the relationship, at a state level, between income growth, home price growth and credit growth. These three elements should logically be closely meshed, yet in the current environment, they are not. We think this is an important leading indicator of trouble ahead as these three factors will come back eventually to a more normal relationship, signalling potential falls in home values and credit volumes in a low income growth environment.

The latest data from the ABS shows that home prices fell slightly in the past quarter. The Residential Property Price Index (RPPI) fell 0.2 per cent in the March quarter 2016, the first fall since the September quarter 2012. Attached dwellings, such as apartments, largely drove price falls in the RPPI.  The attached dwellings price index fell 0.8 per cent in the March quarter 2016. Falls were recorded in Melbourne (-1.3 per cent), Sydney (-0.6 per cent), Perth (-1.1 per cent), Canberra (-1.1 per cent) and Adelaide (-0.4 per cent). Brisbane (+0.7 per cent), Hobart (+2.3 per cent) and Darwin (+0.1 per cent) recorded rises. Established house prices for the eight capital cities was flat (0.0 per cent).  The total value of Australia’s 9.7 million residential dwellings increased $15.4 billion to $5.9 trillion. The mean price of dwellings in Australia is now $613,900.

The RBA minutes also out today had a couple of interesting comments.

Dwelling investment had continued to grow strongly over the year, consistent with the substantial amount of work in the pipeline noted in previous meetings. Members observed that private residential building approvals had increased strongly in April, to be close to peaks seen earlier in 2015. Although these data are quite volatile from month to month, the trend for building approvals had been stronger than expected of late and the pipeline of residential work yet to be done had remained at high levels. This implied that growth in new dwelling investment would continue to add to the supply of housing over the next year or so, particularly in the eastern capitals.

In established housing markets, prices increased significantly in Sydney and Melbourne over April and May and, to a lesser extent, in a number of other capital cities. Auction clearance rates and the number of auctions increased in May, but remained lower than a year earlier. At the same time, the monthly data available for April showed that there had been a further easing in housing credit growth and the total value of housing loan approvals, excluding refinancing, had fallen in the month. Members noted that the divergence in the trends in housing price and credit growth was not expected to persist over a long period of time.

We already know that income growth is static.

So this got us thinking about the relationship between income, home price growth and credit growth. To look at this, we drew data from our surveys, and also the ABS and RBA data-sets, to map the relative cumulative growth of average household income, home price growth and credit growth. The results are interesting. We used 2006 as a baseline and measured the relative cumulative growth since then, by state.

First, here is the average across Australia. The growth of credit since 2006 (the yellow line) is significantly stronger than home prices and income. Income is notably the slowest. This is course confirms what we know, households are more leveraged (highest in the western world), and home prices are higher relative to income, supported by credit availability and more recently low interest rates. Note also the recent slowing in credit growth.

Credit-Price-and-Income-Trends---AllLooking at the state variations is really insightful. In the ACT credit growth is very strong, but home prices and incomes are moving at a similar trajectory. This is partly because of the micro-economic climate supported by well paid public servants.

Credit-Price-and-Income-Trends---ACTIn NT, home price growth is higher than credit and income growth, but the growth is beginning to slow, in response to the mining slow down. Home prices are significantly extended relative to incomes.

Credit-Price-and-Income-Trends---NTIn TAS, home prices are tracking incomes, whilst credit has been growing more slowly, thanks to lower price growth and local demographics.

Credit-Price-and-Income-Trends--TASIn WA, we see significant home price momentum through the mining boom years, but it is now adjusting, and credit which has been strong has been easing in the past 12 months. Home price growth is now tracking income growth.

Credit-Price-and-Income-Trends---WAIn SA, credit is quite strong now, and we are seeing home prices moving ahead of incomes, as they did in 2010, but only slightly.

Credit-Price-and-Income-Trends---SAIn QLD, credit is growing faster now, and home prices are moving faster than incomes, there is an interesting dip in 2011-12, thanks to some “local political difficulties!”

Credit-Price-and-Income-Trends---QLDVIC holds the award for the strongest credit growth in recent time, and as a result we see home prices moving ahead of income growth, a trend which can be traced back to before the GFC.

Credit-Price-and-Income-Trends---VICFinally, in NSW, we see a dramatic run up in credit and home prices, especially since 2013. Both are growing faster than incomes. Prior to this, income growth and home prices were more aligned.

Credit-Price-and-Income-Trends---NSWSo a few observations. Incomes and home prices, and credit are disconnected, significantly. This is a problem because credit has to be repaid from income, in some way, at some time. Next, there are strong correlations in some states between credit growth and home prices, in other states it is less clear. NSW and VIC have the largest gaps between income and prices. So it reconfirms the property markets are not uniform. Finally, and importantly, we think that home price and credit growth will have to come back to income growth – and as incomes will be static for some time, downward pressure on home prices and credit will build, especially if the costs of borrowing were to rise.

What sort of Reserve Bank governor will Philip Lowe be?

From The Conversation.

Glenn Stevens’ ten year stewardship of the Reserve Bank of Australia has been characterised by remarkable challenges. Yet, if the Australian economy has shown considerable resilience over this troubled decade, particularly during the global financial crisis, part of the credit certainly goes to the RBA.

When Stevens’ deputy, Philip Lowe succeeds him in September, he will need to continue to shepherd Australian prosperity through the challenges of global deflation and faltering global economic growth.

What direction will he take with the country’s monetary policy?

Glenn Stevens’ Legacy

Under Stevens, inflation has remained relatively stable and predictable, which is the main target for a central bank like the RBA. The repercussions of the financial crisis in North America and Europe have been mostly avoided thanks to the solidity of the Australian financial system, which is also a key responsibility of the RBA.

Sure enough, the exchange rate has experienced some wide fluctuations. But in an economy where the central bank targets inflation and there is no external anchor, these fluctuations are inevitable. In fact, the flexibility of the exchange regime has been another important factor driving Australia’s resilience.

Finally, the RBA has maintained its strong reputation and credibility both domestically and internationally; and in the current context where central banks in many industrial countries are blamed for poor macroeconomic management (well beyond their actual faults), this is no little achievement.

A solid background

A graduate from the University of New South Wales, Lowe holds a PhD from the Massachusetts Institute of Technology. He began his career with the RBA in 1980 and, until 1997, occupying a various positions in the International Department and Economic Group, before becoming Head of the Economic Research Department in 1997-98 and then the Financial Stability Department in 1999-2000.

In 2000-02 he was Head of Financial Institutions and Infrastructure Division at the Bank for International Settlements. After returning to the RBA, he headed the Domestic Markets and Economic Analysis Departments.

In 2004 he was appointed Assistant Governor (Financial System), then Assistant Governor (Economic) from 2009 until 2012, when he assumed his current position as Deputy Governor. This already impressive curriculum is enriched by several academic publications.

Lowe’s on monetary policy and financial stability

The RBA operates with an inflation target; that is, its objective is to use monetary policy to stabilise inflation at around 2%-3% on average over the business cycle. The pursuit of the inflation target requires the RBA to respond to demand pressures that can eventually lead to undesirable fluctuations in inflation and consumer prices.

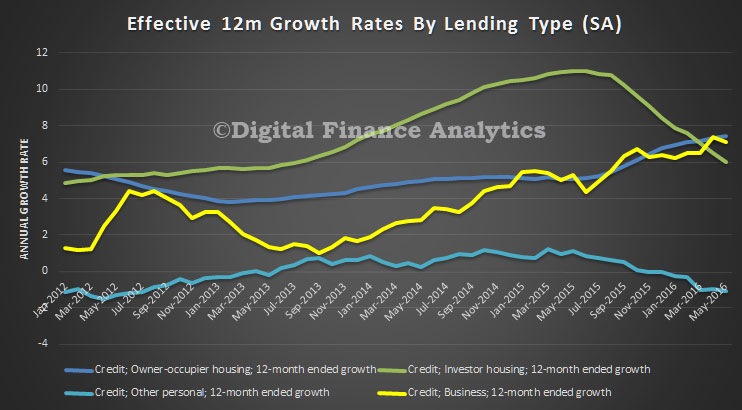
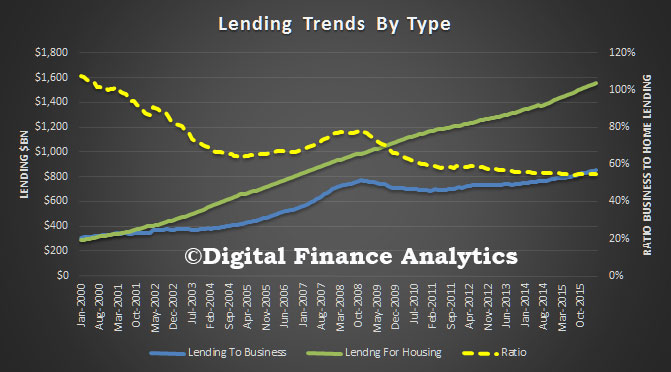
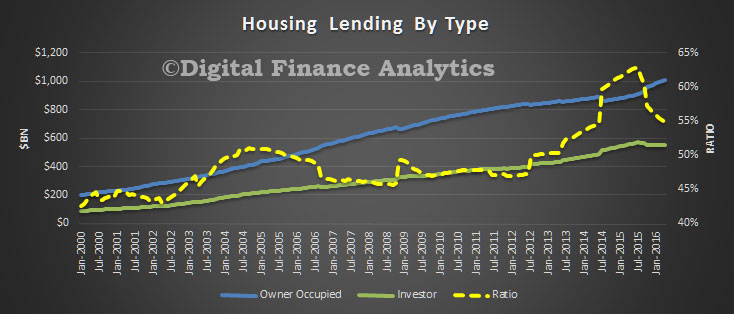
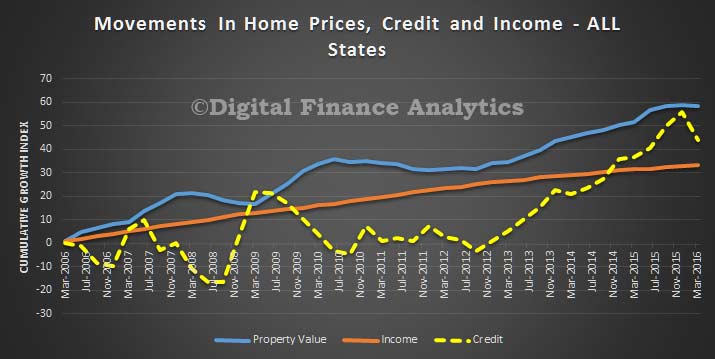
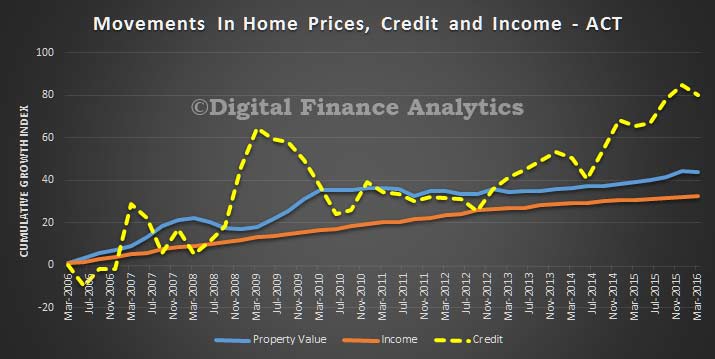
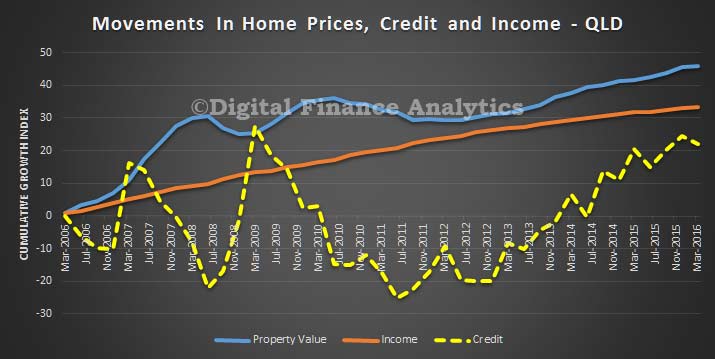
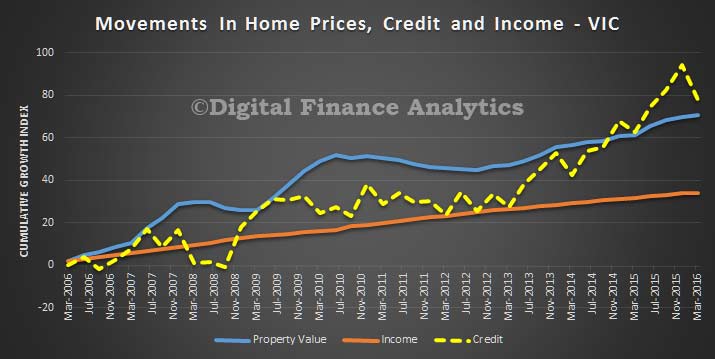
In a low inflation environment such as Australia, these demand pressures can manifest themselves in rapid credit and asset prices growth, which in turn trigger episodes of financial instability.

In some of his academic work, Lowe has documented these links, showing that inflationary pressures are likely to become evident in asset prices before they show up in goods and services prices.

Taken to the operational level, this means that the emergence of an asset-price bubble calls for a deflationary intervention of the RBA before the further enlargement of the bubble threatens financial and monetary stability.

We can therefore expect Lowe’s RBA to be watching credit and asset markets closely and be prepared to respond to fluctuations on such markets as a way to prevent a more general increase in consumer prices. To use an economist’s jargon, credit and asset markets become part of the monetary policy reaction function of the RBA.

But even under an inflation target regime, monetary policy should concern itself with the cycles of the “real” economy (that is, cycles of gross domestic product and employment). Provided that the inflation target is not compromised, monetary policy should be adjusted to stabilise cyclical changes in production and labour market conditions.

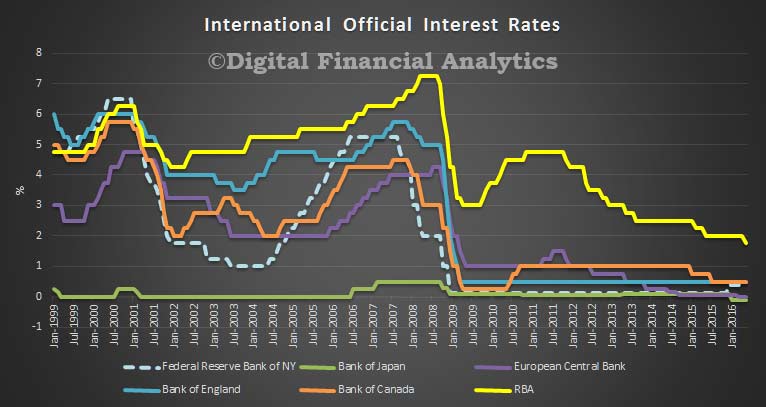
In fact, the RBA has never been the type of excessively hard-nosed central bank that exclusively pays attention to monetary stability. Even recently, monetary policy has been significantly accommodating, meaning that interest rates have been kept low as a way to support the cyclical recovery of the Australian economy.

This approach to monetary policy is very likely to continue under Lowe. For instance, in a recent address to Urban Development Institute of Australia (UDIA), he indicated that “[this] low inflation outlook provides scope for easier monetary policy should that be appropriate in supporting demand growth in the economy.”

In this regard, the challenge for him will be twofold. For one thing, as interest rates continue to decline, the effectiveness of further interest rate cuts in stimulating the real economy is likely to weaken. For another, a debt-obsessed government might end up relying too much on monetary policy and too little on fiscal policy to stimulate the economy.

This would then place the RBA in a difficult position, with Lowe having to protect the independence and autonomy of his institution.

Lowe’s on the long term prosperity of Australia

What else can monetary policy do for Australians? Someone might be tempted to argue that monetary policy should deliver long-term growth and prosperity.

In a sense, any public policy should aim at the greater good of the community. Monetary policy does that by delivering stable financial and monetary environment and by helping the economy to recover from short-term cyclical fluctuations.

But beyond that, prosperity becomes a matter of long term productivity growth and innovation, which in turn call for actions that fall largely outside the realm of monetary policy.

Sustaining productivity requires reforms to enhance competition, investment in transport infrastructure and in high quality education. Similarly, innovation stems from interventions that specifically support new entrepreneurial activities while preventing the distortions of old-school import substitution policies.

Active labour market policies are required to support the process of structural transformation of the economy and to guarantee that workers can relocate from declining to emerging sectors.

The RBA, or any central bank for that matter, is not meant to provide all that. In fact, expecting the RBA to do all (or even only some) of the above would tantamount to compromising its fundamental functions, throwing the Australian economy towards an era of financial and monetary instability and low economic growth.

In his October address to the CFA’s Australia Investment Conference, Lowe explicitly acknowledged that, ultimately, the rate at which living standards improve is unlikely to be driven by the actions of the central bank.

The hope is that the government will listen to him and take responsibility for bringing the Australian economy into a new era of prosperity.

Author: Fabrizio Carmignani, Professor, Griffith Business School, Griffith University

The Rise of High Rise

The recent RBA Bulletin included a section on apartment construction in Australia. They conclude that apartments have become an increasingly important contributor to new dwelling construction over recent years and in 2015 accounted for more than one-third of all residential building approvals. The majority of recent apartment construction has been located in Sydney, Melbourne and Brisbane.  Buyers come from all segments – owner occupiers, investors and foreign investors. Across these cities there have been differences in geographical concentration, the types of buyers purchasing the dwellings and supply-side factors such as planning frameworks. The increase in apartment construction has reflected a range of factors, including the nature of land supply constraints and affordability considerations, together with a desire to reside in close proximity to employment centres and amenities. Given that these factors are likely to persist, apartments are expected to continue to play an important role in providing new housing supply.

Initially, approvals for apartments increased in Melbourne in 2010, followed by Sydney, and then Brisbane more recently. Apartment approvals in Perth also increased in recent years, but from a relatively small base. The effect of this increase on the stock of apartments in each city has varied. Cumulative approvals since 2011 in Melbourne and Brisbane have added around one-third to the stock of apartments in those cities compared with an addition of around one-fifth of the 2011 stock for Sydney and Perth.

Bul-Appartments1The location of activity within each of the cities has varied. This has been determined by a variety of factors, including proximity to employment centres and transport infrastructure, planning frameworks and the availability of suitable sites for apartment projects. In Sydney, approvals have been relatively spread out across the inner and middle suburbs – a large area ranging from Parramatta in the west to Chatswood in the north and Mascot in the south. In contrast, a relatively large share of apartment approvals in Melbourne has been in the city (which includes the CBD, Southbank and Docklands – an area of around 30 square kilometres), although construction activity in the middle-ring suburbs has picked up more recently. In Brisbane, activity has been concentrated in the city and in a few of the surrounding inner suburbs, as has been the case in Perth.

Alongside this strong construction activity, competition among developers for suitable sites for apartment projects has intensified and led to increases in site prices. Australian developers account for the majority of apartment projects, though foreign developers have become more active in acquiring sites and developing projects, mostly in Melbourne and Sydney. In addition to competing over the acquisition of suitable new sites and residential land, developers have also sought to purchase lower-grade office and industrial buildings for conversion into apartment projects, thereby supporting prices for these assets.

Turning to buyers, there are a variety of factors that have contributed to increased demand for new apartments from prospective owners and tenants. Employment opportunities and population growth are fundamental drivers of demand for new housing; sustained population growth in Australia’s largest cities has led to increased demand for all dwellings, including apartments. Population growth was strongest in Perth for much of the past decade, in part owing to migration associated with the mining investment boom. That growth has slowed over the past couple of years. In the eastern cities, land supply constraints have led to increased prices for blocks of land and detached houses. This is likely to have driven demand for apartments relative to other dwellings, as apartments use land more intensively than detached houses and are therefore relatively more affordable. A desire to reside close to CBD employment centres is also likely to have stimulated demand for apartments, as residents in increasingly populated cities value the convenience and reduced travel time associated with the proximity to amenities in these areas.

Three types of buyers can be distinguished – owner-occupiers, domestic investors and foreign buyers (‘non-residents’). Liaison with industry contacts suggests that, in recent years, the relative importance of these three groups has varied across different cities. Foreign buyers have played a relatively significant role in the inner city of Melbourne. In the inner suburbs of Brisbane, domestic investors (particularly from interstate) have underpinned demand, driven in part by the higher yields available relative to Sydney and Melbourne. In contrast, sales in Sydney have been more evenly spread across the three groups of buyers.

Whether buyers are owner-occupiers or investors can influence the composition of the net supply of housing. Purchases of new apartments by domestic investors are most likely to lead to an increase in the supply of rental properties. For owner-occupiers, the net effect will depend on the location and size of the existing property from which the purchaser is moving and whether there is a change in the rate of household formation. For example, if the owner-occupier is a first home buyer moving out of their parents’ home, total demand for housing increases alongside the increased supply of housing, whereas if they are moving from a rented property this will create a rental vacancy elsewhere.

Similarly, owner-occupiers who are downsizing will leave an established property that can possibly accommodate a larger household. The net impact from foreign buyers on housing demand will depend on the relative mix of those buyers who plan to occupy their dwelling (or leave it vacant) and those who plan to rent out their property. All foreign buyers, other than temporary residents, are generally  restricted to purchasing newly constructed dwellings. The observations on foreign buyer activity in this article are sourced from liaison with property developers and other industry contacts.

Developers must record the residency of buyers to ensure that they do not exceed Australian banks’ caps on pre-sales to foreign buyers (if funded by an Australian lender). Non-residents and temporary residents must apply to purchase Australian property – the Foreign Investment Review Board records data on approvals for these purchases, though these data are limited and partial.  Industry contacts have often reported that many foreign buyers, especially those who reside in East Asia, have additional motivations for buying apartments in Australia. It is commonly reported that foreign buyers purchase Australian property to diversify their wealth and intend to hold the property for a long period. Contacts also suggest that foreign buyers’ motivations can include the prospect of future migration, providing housing for children while they study in Australia, or acquiring holiday apartments. The interest from foreign buyers of property, particularly those from Asia, is not unique to Australia; such buyers are also active in the property markets in other countries, such as the United States, the United Kingdom, Canada and New Zealand. Other features that have been cited as attracting foreign buyers include the lower prices of apartments in Australia in recent years relative to major cities in some other countries (particularly following the depreciation of the Australian dollar), geographic proximity to Asia and a stable political and regulatory environment.

Apartments have driven the increase in new dwelling construction in Australia since 2010 and have provided an important contribution to economic growth and employment. The increase in apartment construction has reflected a range of factors, including land supply constraints, affordability considerations and a desire to reside in close proximity to established amenities and employment centres. This has delivered many new dwellings to the market, which has had an effect on housing prices and rents, with growth in these indicators slowing of late. The majority of recent activity has been located in areas with existing links to transport, infrastructure and services, particularly the inner suburbs of Sydney, Melbourne and Brisbane, and, to a lesser degree, Perth. The increase in apartment construction in these cities has been characterised by differences in the geographical concentration of activity, the proportional increase in the apartment stock, the types of buyers purchasing the new dwellings and the planning frameworks, which can affect the behaviour of developers and the supply response. Apartments are likely to continue to play an important role in providing new housing as land supply constraints motivate prospective home owners to purchase higher-density dwellings (which use land more intensively and are therefore less expensive relative to larger, lower-density houses), and as tenants and residents choose to live closer to employment centres and amenities for convenience.

Bank Fees Rose More than 3% Over The Year

According to the Australian Bankers Association, total bank fees paid by households and businesses were $12.5 billion in 2015. This is an increase of 3.4 per cent over the year, (which is significantly higher than inflation). The ABA report, Fees for banking services, was released, on the same day as the latest analysis from the RBA.

The mix of fees has changed, with more drawn from loans and payments, whilst fees on transaction accounts – a product used by virtually every household – are now at the lowest level in 15 years. Fees have fallen by $1 billion or 51 per cent since the peak in 2008, yet the number of transactions has increased by around 60 per cent over that same time.” “Households are paying an average of $9 a week in bank fees – the same as what we were paying in 2004”

The ABA highlighted the increased volumes of products and services accessed. “Banks provide around six million housing loans and last year alone approved more than 900,000 new home loans. The number of credit card accounts also increased last year by more than half a million to 13.5 million. So, the growth in fees paid on home loans and credit cards is low given many more of these products are in the market”

The RBA data, contained in the latest Bulletin, shows overall growth of 3.5%.

Bank-Fees-2016Banks’ fee income from households grew by 2.9 per cent in 2015, the third consecutive year of positive growth. Higher fee income largely reflected growth in fee income from credit cards, which grew strongly for the second consecutive year. Growth in housing and personal lending fees was moderate, while fee income from deposit products declined in 2015. Fee income from credit cards, the largest single source of fee income from households, increased strongly in 2015. The increase in fee income from credit cards was due to both more instances of fees being charged and an increase in unit fees on some products. An increase in currency conversion fees incurred by households for overseas purchases was largely a result of an increase in the number of foreign currency transactions, with only a small increase in average unit fees. Banks increased some unit fees during 2015, in particular those relating to credit card annual fees and cash advances. Several banks also increased fee income from credit cards through the acquisition of existing credit cards from other providers.

Bank-Fees-2016-2The main drivers of modest growth in fee income on personal lending were higher unit fees and increased turnover. Some banks also increased lending volumes, resulting in higher establishment and loan registration fee income. Exception fees and transaction fees on personal lending declined. Growth in fee income from housing loans was consistent with housing credit growth during 2015. Higher fee income was due to a higher volume of new loans, more instances of early repayment fees and, to some extent, higher unit fees on home loan packages. The major banks and large regional banks recorded the highest growth in housing loan fee income, while some smaller regional banks reported declines in fee income as a result of lower volumes of loans.

Fee income from deposit accounts declined further over 2015. The decline in fee income was broad based across most types of deposit fees, but there were notable declines in fee income relating to non-transaction accounts such as term deposits and online savings accounts.

Total fee income from businesses increased by 3.9 per cent, primarily reflecting higher fee income from small businesses. By product, growth in fee income from businesses continued to be driven by merchant fees and business loans. Fee income from bank bills declined sharply in 2015, similar to previous years. Fee income from other business products was little changed. The increase in loan fee income was mainly due to increases in unit fees for small business loans, although lending volumes also increased. Loan fee income from large businesses declined over 2015 as several banks lowered their unit fees due to increased competitive pressures.

Bank-Fees-2016-3Growth in merchant fee income over 2015 was evenly spread across small and large businesses. The increase in income from merchant fees was largely a result of growth in the number and value of transactions, resulting from a higher number of merchant terminals on issue and increased use of contactless payments. This partially offset a decline in fees earned on cash payment services, via ATM and deposit account withdrawals. A few banks also increased unit fees on merchant services, although the ratio of merchant fee income to the value of credit and debit card transactions continued to decline during 2015. Fee income from business deposit products also declined slightly. This was mainly due to a reduction in deposits held by these customers; however, the decline in fee income was also the result of customer switching between deposit accounts in order to make use of lower fee products.

Will Rates Fall Further?

The RBA statistical release shows the relative policy rates in US, UK, Canada, Japan, ECB and Australia.  Looking at the rates from 1999, we see that since the GFC rates have been lower, thanks to unconventional monetary policy. In contrast to other countries, the Australian cash rate has remained higher, for longer, but is at a record low.  Will it fall further?

Rates-Comp-to-2016Yahoo7News reports that according to 1300HomeLoan managing director John Kolenda, who last year accurately warned banks would lift their mortgage rates out-of-sync with the Reserve Bank, said the current official rate of 1.75 per cent would be the “new norm”.

The Reserve sliced rates to 1.75 per cent – the lowest level on record – last month over fears about the level of inflation. Prices have been dropping for several months across the country with deflation a real threat in Perth.

Mr Kolenda said consumers were now more sensitive to the impact of higher interest rates which meant taking them back to what was once considered normal was unlikely.

“We are unlikely to see official interest rates move to pre-global financial crisis (GFC) levels and the standard norm of the future will be lower than historical levels for the next decade,” he said.

“The monetary policy game has changed and the RBA has found cutting its cash rate is not necessarily an instant remedy for economic stimulus.

“Conversely, any time the RBA increases official rates in the future could have a disastrous impact on consumer confidence and the economy. Consumers are now very rate sensitive and when they rise they are likely to stop spending and revert to saving.”

Markets are pricing in another interest rate cut by the end of the year although economists believe the Reserve’s next move will be a rate increase.

Mr Kolenda said there was a real prospect the Reserve would cut rates again.

This despite stronger than expected GDP growth, reported recently. Inflation is below the RBA’s lower bounds.

Currently, lenders are heavily discounting their mortgage rates for new loans and refinanced transactions. Property transaction momentum appears to be increasing after a slow few months, and house prices are rising in most states.

So, on one hand, there are good reasons to expect the RBA to cut further, and keep rates low for a long time. On the other, the property market is alive and well, and will be a handbrake on further cuts.

We expect out of cycle rate hikes for many mortgage holders, once the election is passed as lenders attempt to repair their margins, and we are less convinced the RBA will cut again anytime soon, give the current property trends – in fact, we need more macroprudential controls, not lower interest rates. That said, the medium term outlook is for rates to stay low for a long time, and this does mean large mortgages will continue to be serviced as current levels. But any hike in rates would have significant negative impact on households and the economy, given the sky-high debt levels in place at the moment.


Household Debt Ratio Grinds Higher And Mortgage Discounts Rise

The latest RBA chart pack, just released, shows that household debt, as a percentage of disposable income continues to rise. Also from our analysis, banks are offering larger discounts again.

RBA data shows interest payments are below their peak, but are also rising (though the May cash rate cut will have an impact down the track as mortgage rate cuts come home).  However, given static incomes (which are for many falling in real terms), this debt burden is a structural, and long term weight on households and the economy, and is dangerous.  However low the interest rate falls, households will still have to pay off the principle amount eventually.

household-financesWe are also seeing some relaxing of lending standards now, as banks chase investor loans well below 10% growth rates, and continue to offer cut price loans for refinance purposes.  Average discounts on both investment loan have doubled.

Discounts-May-2016