Securitised Loan Pools Tells Us Something

Guy Debelle Assistant Governor (Financial Markets), spoke at the 28th Australasian Finance and Banking Conference – “Some Effects of the New Liquidity Regime“. During his speech he revealed some significant data drawn from Australian securitised mortgages. With the caveat that securitised loans are somewhat cherry-picked, and may not represent the entire market profile, there are some interesting observations. Of note is the higher level of default in WA, and the proportion of loans above 80% and 90% LVR.

To enhance the information available to us, since the middle of 2015, mandatory reporting requirements came into effect for asset-backed securities to be repo eligible with the Reserve Bank and also to be eligible collateral for the CLF.

The required information includes key transactional level data, detailed tranche information, and the relationships between trusts and service providers including who is providing various facilities such as a fixed to floating swap. At the loan level, required data for RMBS include: 62 loan fields such as loan balances, interest rates, arrears measures; 18 borrower fields such as borrower income, employment type, whether they are an investor or owner-occupier, whether they are a first home-buyer; and 13 collateral fields (that is, detail on the collateral underpinning the mortgage) including postcode and property valuation.

These requirements include data that are commonly used by ratings agencies and RMBS investors, but the data go beyond that to also include some useful information that has not been commonly compiled before, such as offset balances and borrower income at origination. This allows us, along with other investors in asset-backed securities, to undertake a richer analysis of such securities and more accurately assess their risk and pricing than may have been possible before. In our case, it allows us to undertake our own risk assessment and not be dependent on rating agencies.

In addition to these data fields, issuers are also required to provide a working cash flow waterfall model of the security which can provide useful information about structural aspects of ABS in some cases only previously obtainable through a detailed reading of legal documentation. This innovation has been very useful in standardising information across securities, allowing us to verify structural features of deals and provide more granular haircuts and pricing than was the case previously.

These reporting requirements are standardised for all repo-eligible asset-backed securities, meaning that the same information is required for all securities. As a result, going forward, it will be easier to compare securities. We see this as being of great benefit to the industry as a whole, as does the industry itself, as evidenced by the support of the Australian Securitisation Forum (ASF) through the whole process of introducing these new standards.

The repo-eligibility requirements also direct issuers to make the information available to investors and other permitted users, not just to the Reserve Bank. By and large, the information provided to these groups is the same as that provided to the Reserve Bank; however, there have been some fields where the information provided posed a potential risk to privacy. Hence issuers may redact some particular fields and provide aggregated de-individualised data about these fields instead.

Since the middle of this year, we have received into our securitisation system around 1 600 submissions, covering around $400 billion in assets, including around two million individual housing loans. The information is updated on a monthly frequency so we are gaining not only a much richer view of the ABS market at any point in time, but also a rich time series. With this very large panel data set we can examine how the market, and the underlying collateral, evolves through time.

With the caveat that the data reporting is still in its infancy, it’s already apparent that there are many potential benefits of the data. Let me illustrate some of the summary information that we can glean from the first few months of reporting. As noted earlier, these data cover around 2 million housing loans of the total of the approximately 6 million such loans on issue currently.

Graph 4 shows the loan to value ratio (LVR) at origination and currently. The largest share of loans had an LVR at origination of between 70 and 80 per cent. While that is still the case in terms of the current LVR, the share is noticeably lower. Similarly, there are almost no loans with an LVR greater than 90 per cent, even though around nearly 10 per cent had an LVR greater than 90 at origination. That said, it should be borne in mind that securitised loans tend to be more seasoned than non-securitised loans and are therefore amortising more quickly. The seasoning (time since loan origination) of the securitised loans is shown in Graph 5. It shows that 95 per cent of the value of loans is more than one year old, and nearly 75 per cent is more than three years old.

Graph 4

sp-ag-2015-12-16-graph4

Graph 5

sp-ag-2015-12-16-graph5One issue which is of some interest currently is the extent of the repayment buffer that has been built up by borrowers. This is shown in Graph 6 which shows that two-thirds of borrowing is covered by a repayment buffer of at least one month’s worth of required mortgage payments, and for half of this, that buffer is more than one year. As the time series on this loan feature accumulates it has the potential to be useful information for monetary policy as well as financial stability considerations. Graph 7 shows the level of documentation for loans securitised by different types of lender. It shows that the major banks have a minimal share of low doc loans in their pools, whereas for the non-bank issuers the share is considerably larger.

Graph 6

sp-ag-2015-12-16-graph6Graph 7

sp-ag-2015-12-16-graph7Finally, in terms of credit risks, Graph 8 shows arrears rates by states and shows that the current distribution of arrears are consistent with the variation in economic conditions across the states, though at the same time all arrears rates are relatively low.

Graph 8

sp-ag-2015-12-16-graph8Of course, credit risk is not so much about the averages but the distributions. Having the loan level data enables an insight into the characteristics of the loans in the various tails of the distribution that warrant closer attention. It will also allow an assessment of the correlations between the various drivers of risk that may lead to credit deterioration.

In sum, there is very rich potential in these data for many purposes for the RBA and other market participants. From our point of view, the data provide us with a great deal of insight into the contingent risk that might at some point reside on our balance sheet. But clearly, the data are also very useful for financial stability and monetary policy considerations too.

RBA Minutes From December Signals Little

The latest minutes suggest no early change to the cash rate is likely, given on one hand spare capacity in the economy, slowing investment housing lending, some slippage in house prices, and yet also some momentum in the non-mining business sector.

The available data suggested that dwelling investment had increased in the September quarter. Building approvals remained at high levels, despite having eased somewhat since the start of the year. This was consistent with the expectation of further increases in dwelling investment in coming quarters, albeit at a gradually declining rate.

In the established housing market, auction clearance rates and housing price growth had declined over recent months in Sydney and to a lesser extent in Melbourne. Prices were declining in Perth and rising moderately in much of the rest of the country. Members observed that the growth of total housing credit had been little changed. The easing in housing price growth in Sydney and Melbourne and apparently lower growth in lending for the purpose of investor housing had followed an earlier tightening in lending terms, partly in response to supervisory measures announced by the Australian Prudential Regulation Authority. It was still too early to assess the effect of the modest increase in lenders’ mortgage rates in November (for both investors and owner-occupiers) on the housing market.

Mining investment was estimated to have fallen in the September quarter and further declines were expected in the period ahead, with the largest subtraction from growth expected to occur in the current financial year. Non-mining investment was estimated to have been little changed over the year to the September quarter. Investment intentions reported in the ABS capital expenditure survey – which covers only around half of non-mining investment – continued to point to a decline in non-mining investment in 2015/16, and non-residential building approvals had remained at relatively low levels. In contrast, survey measures of business conditions continued to improve and were clearly above average, in particular for the household services and business services sectors, whose output was generally less capital intensive than other sectors. Business credit had increased further in October.

In considering the stance of monetary policy, members noted that the available data suggested that the global economy continued to record moderate growth. Continued softness in demand growth in Asia had been associated with a further fall in commodity prices. At the same time, there had been further growth in the United States and a continued recovery in Europe. Monetary policy was accommodative in most economies, which, combined with the low level of oil prices, was expected to support growth in Australia’s major trading partners over the next couple of years. Core inflation rates remained stable, but generally below central banks’ targets.

Members noted that recent domestic data had generally been positive. There continued to be evidence that very low interest rates were supporting growth in household consumption and dwelling investment, and the exchange rate was adjusting to the significant declines in key commodity prices and boosting demand for domestic production. This had translated into stronger employment growth and was consistent with surveys suggesting that business conditions were above average. Resource exports had continued to make a significant contribution to growth.

Overall, the forecasts for the Australian economy were for output growth to strengthen gradually over the next two years as the drag on GDP growth from falling mining investment gradually diminished and activity progressively shifted to non-mining sectors of the economy. Business surveys suggested that there had been an improvement in conditions in non-mining sectors over the past year, which had been accompanied by stronger growth in employment and a steady rate of unemployment. Even so, members recognised that there was still evidence of spare capacity in the economy, including in the labour market. Wage growth remained low and underlying inflation was expected to be consistent with the target over the next one to two years.

Credit growth had increased a little over recent months, as a result of business credit growth increasing. Growth in lending to investors in the housing market appeared to have eased, with a moderation in the pace of growth in housing prices in Sydney and Melbourne over recent months. Housing price growth had mostly remained subdued in other cities. While the recent changes to some lending rates for housing would reduce demand slightly, overall conditions remained quite accommodative. Members observed that supervisory measures had been helping to contain risks that may arise from the housing market.

Based on the available data and the forecasts, the Board decided that leaving the cash rate unchanged at this meeting was appropriate. Members judged that the outlook for inflation may afford some scope for a further easing of monetary policy should that be appropriate to lend support to demand. The Board would continue to assess the outlook, and hence whether the current stance of policy would most effectively foster sustainable growth and inflation consistent with the target.

RBA Consults on Changes to Card Payment Systems

In March, the Reserve Bank commenced a review of the regulatory framework for card payments. As part of this process, the Bank released an Issues Paper that noted some developments in the payments system that raised concerns given the Bank’s mandate to promote competition and efficiency in the payments system. Bank staff have since consulted extensively with stakeholders on these matters.

At its meeting of 20 November, the Payments System Board agreed to consult on changes to the standards for card payment systems. The Bank has today released a Consultation Paper containing amended draft standards. A summary of the proposed reforms is provided below and in some Q&A on the Bank’s website. Stakeholders are invited to make submissions on the draft standards by 3 February.

The draft standards include changes to the regulation of surcharges on card payments and interchange payments in card systems. In preparing the draft changes to the surcharging standard, Reserve Bank staff have consulted with staff from the Treasury and the Australian Competition and Consumer Commission (ACCC) regarding the Government’s plans to ban excessive surcharging and give enforcement powers to the ACCC. The Government has today announced draft legislation that will insert a ban on surcharging in excess of merchant costs into the Competition and Consumer Act (2010).

Changes to the Bank’s Surcharging Standard

Merchants incur costs when they accept a payment from a customer, and different payment methods can have very different payment costs; cards that provide significant rewards to consumers are typically significantly more expensive for merchants. When merchants have the right to surcharge on more expensive payment methods they are able to provide price signals to consumers and encourage the use of less expensive payment methods. By helping to hold down payment costs, the right to surcharge helps to hold down the price of goods and services charged to all consumers and reduces the extent of subsidisation between those who pay with cheaper payment methods and those who use more expensive methods.

It is important, however that merchants do not impose surcharges in excess of their actual payment costs. The Bank has had concerns about excessive surcharging in some sectors for some time. Accordingly, and consistent with the Government’s draft legislation, the Board is proposing to change the Bank’s surcharging standard with the aim of ensuring that customers cannot be surcharged any more than the cost of accepting cards. The proposed standard preserves the right of merchants to surcharge for more expensive payment methods but includes changes to enhance transparency and improve enforcement in cases where merchants are surcharging excessively.

The draft standard envisages the following framework for surcharging of card payments:

  • Card schemes will not be permitted to make rules that prevent merchants from recovering part or all of the costs of accepting card payments.
  • However, card acceptance costs will be defined more narrowly than in the Bank’s current guidance note, as the merchant service fee and other fees paid to the merchant’s bank (or other payment service provider).
  • Statements provided by banks to merchants will be required to contain easy-to-understand information on the average cost of acceptance for each payment method, which will constitute the maximum permissible surcharge if the merchant chooses to surcharge.
  • These statements will express acceptance costs in percentage terms, except where a merchant’s cost of acceptance for a particular payment method is fixed across all transaction values. This should ensure that merchants – including in the airline industry – who wish to surcharge will typically do so in percentage terms rather than as a fixed dollar amount.

Reserve Bank staff will continue to consult with the ACCC and will be working with banks, other payment service providers and the merchant community to develop templates for providing information on payment costs to merchants. The Bank expects that the more specific definition of the cost of acceptance and the transparency measures that are being proposed will result in enhanced enforcement of the surcharging framework in cases where merchants may be surcharging excessively.

Changes to the Bank’s Interchange Standards

Interchange fees are fees set by card schemes such as MasterCard, Visa and eftpos that require payments from the merchant’s bank to the cardholder’s bank on every transaction. While there may be a useful role for interchange fees when a card network is first established, the case for significant interchange fees in mature card systems is much less clear. Where merchants do not feel able to decline cards, the incentive is for schemes to raise interchange rates to induce banks to issue their cards and for banks to then use these fees to pay rewards to consumers to take and use the cards. Evidence from a range of countries suggests that competition between well-established payment card networks can lead to the perverse result of increasing the price of payment services to merchants (and higher retail prices for consumers).

Accordingly, in 2003 the Bank introduced benchmarks intended to prevent the significant upward pressure on interchange rates seen in many markets. Contrary to predictions by the international schemes at the time of the initial regulations, the Australian cards market has continued to grow very strongly since then and innovation has thrived. The Bank’s reforms have been supported by the leading Australian consumer and merchant organisations. Following the Bank’s reforms, a number of other jurisdictions have also regulated interchange fees.

The Bank’s Issues Paper drew attention to a number of issues related to interchange fees:

  • the decline in transparency for some end users of the card systems, which is partly because interchange fees have become increasingly complicated and the range of interchange fee categories has widened
  • the question of whether there is scope for average interchange fees to fall further, consistent with falls in overall resource costs in the card systems and as was contemplated in both the conclusions to the Bank’s 2007–08 Review of Card Payment System Reforms and the Final Report of the Financial System Inquiry
  • the possibility that the growth of companion card arrangements may indicate that the current regulatory system is not fully competitively neutral.

Following consultation on these issues with a wide range of stakeholders, the Board is proposing some changes to the Bank’s interchange standards that will improve competition and efficiency in the card payments market and in the broader payments system.

The Bank is proposing to modify the credit card interchange standard so that issuance of American Express companion cards will be subject to the same interchange fee regulation that applies to the MasterCard and Visa systems. In particular, interchange fees will be defined to also include fees paid by schemes to card-issuing banks as incentives to issue cards. In addition, both companion card issuance and traditional ‘four-party’ card issuance will be subject to rules on ‘other net payments’ to issuers, so as to prevent any circumvention of the interchange standards.

The Bank is not proposing to replace the current system of weighted-average interchange benchmarks with hard caps. The weighted-average benchmark for credit cards will remain at 0.50 per cent. However, the Bank is proposing to reduce the weighted-average benchmark for debit cards from 12 cents to 8 cents, consistent with the fall in average transaction values since the debit benchmark was introduced.

The weighted-average benchmarks will be supplemented by caps on any individual interchange fee within a scheme’s schedule. It is proposed that no credit card interchange fee will be able to exceed 0.80 per cent and no debit interchange fee will be able to exceed 15 cents if levied as a fixed amount or 0.20 per cent if levied as a percentage amount. These changes are expected to significantly reduce the extent to which small and medium-sized merchants are disadvantaged relative to a group of preferred merchants in the MasterCard and Visa interchange systems.

There are some other proposed changes to the system of benchmarks including a shift from three-yearly compliance to quarterly compliance. In addition, it is proposed that all transactions at Australian merchants will be included in calculations for observance of the benchmarks, with transactions on foreign-issued cards treated equivalently to transactions on domestic cards. Transactions on prepaid cards will be included with debit cards in the observance of the debit benchmark.

Next Steps

The Board seeks views on the draft surcharging and interchange standards as well as on other issues discussed in the Consultation Paper. The Consultation Paper also seeks industry views on appropriate implementation dates for any revised standards. Formal written submissions on these issues are requested by 3 February 2016.

Given the complexity of issues involving interchange fees and companion cards, it is unlikely that the Board will take any formal decision on changes to the interchange standards before its May 2016 meeting. In the case of surcharging, depending on consultation responses, it is possible that the Board may be in a position to make an earlier decision on changes to its standards.

IMF Updates Global and National Housing Outlook, Australian Property Overvalued

In the latest release, the IMF have provided data to October 2015, and also some specific analysis of the Australian housing market. We think they are overoptimistic about the local scene, and we explain why.

But first, according to the IMF, globally, house prices continue a slow recovery. The Global House Price Index, an equally weighted average of real house prices in nearly 60 countries, inched up slowly during the past two years but has not yet returned to pre-crisis levels.

chart1_As noted in previous quarterly reports, the overall index conceals divergent patterns: over the past year, house prices rose in two-thirds of the countries included in the index and fell in the other one-third.

house prices around the world_071814Credit growth has been strong in many countries. As noted in July’s quarterly report, house prices and credit growth have gone hand-in-hand over the past five years. However, credit growth is not the only predictor for the extent of house price growth; several other factors appear to be at play.

house prices around the world_071814For OECD countries, house prices have grown faster than incomes and rents in almost half of the countries.

chart2_House price-to income and house price-to-rent ratios are highly correlated, as documented in the previous quarterly report.

chart2_ Turning to the Australia specific analysis, Adil Mohommad, Dan Nyberg, and Alex Pitt (all at the IMF) argue that house prices are moderately stronger than consistent with current economic fundamentals, but less than a comparison to historical or international averages would suggest. Here is just a summary of their arguments, the full report is available.

Argument: House prices have risen faster in Australia than in most other countries, suggesting, ceteris paribus, overvaluation.

OZ-House-Prices-to-GDPCounter argument 1: House prices are in line on an absolute basis – Price-to-income ratios have risen in Australia and now near historic highs. However, international comparisons suggest that Australia is broadly in line with comparator countries, although significant data comparability issues make inference difficult.
Counter argument 2: The equilibrium level of house prices has also risen sharply – Lower nominal and real interest rates and financial liberalization are key contributors to the strong increases in house prices over the past two decades. The various house price modeling approaches indicate that house prices are moderately stronger (in the range of 4-19 percent) than economic fundamentals would suggest.
Counter argument 3: High prices reflect low supply – Housing supply does indeed seem to have grown significantly slower than demand, reducing (but not eliminating) concerns about overvaluation.
Counter argument 4: It is just a Sydney problem, not a national one – The two most populous cities, Sydney and Melbourne, have seen strong house price increases, including in the investor segment. A sharp downturn in the housing market in these cities could be expected to have real sector spillovers, pointing to the need for targeted measures—including investor lending—to reduce risks from a housing downturn.
Counter argument 5: There are no signs of weakening lending standards or speculation – While lending standards overall seem not to have loosened, the growing share of investor and interest-only loans in the highly-buoyant Sydney market, is a pocket of concern.
Counter argument 6: Even if they are overvalued, it doesn’t matter as banks can withstand a big fall – While bank capital levels are likely sufficient to keep them solvent in the event of a major fall in house prices, they are not enough to prevent banks making an already extremely difficult macroeconomic situation worse.

Let us think about each in turn.

Thus, DFA concludes the IMF initial statement is correct, and despite their detailed analysis, their counterarguments are not convincing. We do have a problem.

No Change to the RBA Cash Rate

At its meeting today, the Board decided to leave the cash rate unchanged at 2.0 per cent.

The global economy is expanding at a moderate pace, with some softening in conditions in the Asian region, continuing US growth and a recovery in Europe. Key commodity prices are much lower than a year ago, reflecting increased supply, including from Australia, as well as weaker demand. Australia’s terms of trade are falling.

The Federal Reserve is expected to start increasing its policy rate over the period ahead, but some other major central banks are continuing to ease monetary policy. Volatility in financial markets has abated somewhat for the moment. While credit costs for some emerging market countries remain higher than a year ago, global financial conditions overall remain very accommodative.

In Australia, the available information suggests that moderate expansion in the economy continues in the face of a large decline in capital spending in the mining sector. While GDP growth has been somewhat below longer-term averages for some time, business surveys suggest a gradual improvement in conditions in non-mining sectors over the past year. This has been accompanied by stronger growth in employment and a steady rate of unemployment.

Inflation is low and should remain so, with the economy likely to have a degree of spare capacity for some time yet. Inflation is forecast to be consistent with the target over the next one to two years.

In such circumstances, monetary policy needs to be accommodative. Low interest rates are acting to support borrowing and spending. While the recent changes to some lending rates for housing will reduce this support slightly, overall conditions are still quite accommodative. Credit growth has increased a little over recent months, with credit provided by intermediaries to businesses picking up. Growth in lending to investors in the housing market has eased. Supervisory measures are helping to contain risks that may arise from the housing market.

The pace of growth in dwelling prices has moderated in Melbourne and Sydney over recent months and has remained mostly subdued in other cities. In other asset markets, prices for commercial property have been supported by lower long-term interest rates, while equity prices have moved in parallel with developments in global markets. The Australian dollar is adjusting to the significant declines in key commodity prices.

At today’s meeting the Board again judged that the prospects for an improvement in economic conditions had firmed a little over recent months and that leaving the cash rate unchanged was appropriate. Members also observed that the outlook for inflation may afford scope for further easing of policy, should that be appropriate to lend support to demand. The Board will continue to assess the outlook, and hence whether the current stance of policy will most effectively foster sustainable growth and inflation consistent with the target.


Banks Continue the Mortgage Lending Party In A Fog

The latest data form APRA on the banks (ADI’s) portfolios for October 2015 tells us a little, but much is lost in the fog of adjustments which continue to afflict the dataset. In fact, APRA now points to the “corrected” numbers which the RBA publish.

Some banks have reclassified housing loans that originated as investment loans to owner-occupied based on a review of customers’ circumstances or as advised by customers. See the Monthly Banking Statistics Important Notice for more information. These reclassifications will affect growth rates for investment and owner-occupied housing loans for October 2015. Questions about specific data should be directed to the relevant bank.

The Reserve Bank of Australia publishes industry-level housing loan growth rates in Growth in Selected Financial Aggregates. Table D1 in particular contains investment and owner-occupied loan growth rates, which have been adjusted for these reclassifications. Table D1 is available on the RBA website athttp://www.rba.gov.au/statistics/tables/index.html”

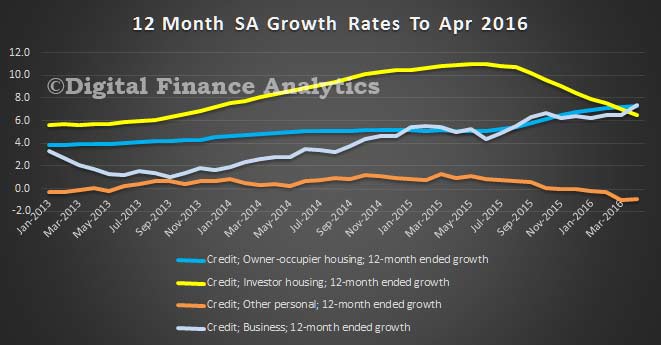
The RBA data shows that investment loans are probably growing a little below 10%, and owner occupied loans at about 6%.

RBA-HL-Growth-D1-Oct-2015The monthly banking stats do not contain these adjustments, so cannot be directly reconciled. However, some interesting points are worth noting nevertheless. First is that total lending for housing rose by 7.5 bn to 1.4 trillion in the month. The RBA lending figure for the whole market (including the non-banks) was 1.5 trillion.  This is another record.  Investment lending sits at 37% on these numbers.  Net movements for OO loans was up 2.73%, whilst investment loans fell 2.95%.

Beyond that, if we take the APRA data at face value, then Westpac continues to reclassify loans. In the monthly movements we see more than $15bn swung into the owner occupied category, with an adjustment to the investment side of the ledger. There were smaller movements in the other banks, but some of this looks like further adjustments.

APRA-MBS-Oct-2015-1So the current market shares are revised to:

APRA-MBS-Oct-2015-2In our modelling of the monthly movements, based on the APRA data, where we sum the monthly movements for the past year (and include adjustments where we can), it appears Westpac is now in negative territory for investment loans, and that the growth rates for the other majors is slowing. The imputed annual market movement is 4.4% against the RBA data above of just under 10%.

APRA-MBS-Oct-2015-4For completeness we also show the owner occupied movements. These too are impacted by reclassifications, and the imputed growth rate is 10%, compared with 6% from the RBA.

APRA-MBS-Oct-2015-3 The net effect of all this is that there is no true information about what individual banks are doing in their loan portfolios. Having tried to talk to a couple of them to clarify the story, I discover they are not willing to share additional data and refer back to the [flawed] APRA data.

The convenient “fog of war” will continue for some time to come. There is also no way to cross-check the RBA adjusted data, and no underlying detailed explanations. We are just supposed to trust them!


Housing Lending Up Again In October to $1.5 trillion.

The latest RBA credit aggregates for October 2015, released today are not easy to interpret because of the myriad of adjustments.   Housing loans have more reached $1.5 trillion, another record.  But are these numbers trust-worthy?

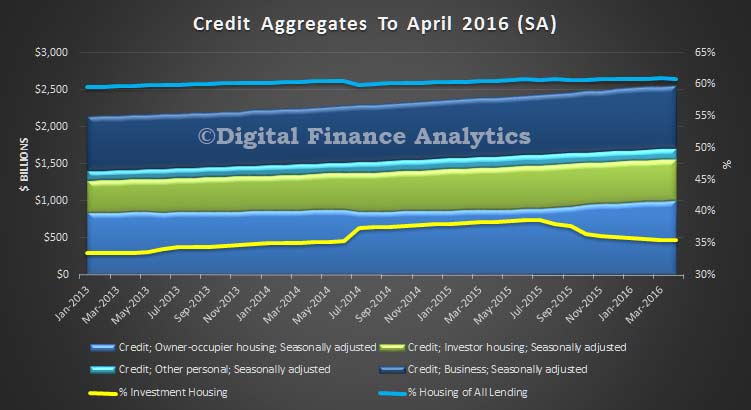
At the aggregate level, total credit rose a seasonally adjusted 0.61% in the month, or 6.11% in the past year. Lending to business grew 0.84% in the month, and 5.88% in the last year. Business lending as a proportion of all lending sits at 33.2%, from an all-time low of 32.9% in July, but clearly business investment continues to be constrained. Housing grew 0.58% in the month, and 7% in the past year, whilst personal credit fell 0.89% in the month and 0.27% in the year, a sign that households remain cautious.

Credit-Aggregates-Oct-2015Turning to housing finance in more detail, and this is where it get complex; lending for owner occupied loans rose 2.62% in the month, representing 9.41% growth in the past year, while investment lending fell 2.8% in the month, and grew 3.03% in the year. But there are so many adjustments in these numbers, as the banks reclassify more loans, thanks to a combination of internal review, and customer request. Specifically, the differential movement in investment loans is making people check their loans are correctly classified, and RBA estimates $30bn of loans have been switched. Investor loans on book comprise 36.35% of all housing, down from its recent heights of 38.55% in July. The only thing we can be sure of is the numbers will move again next month. I discussed the recent RBA comments on this issue recently.

Housing-Aggregates-Oct-2015The RBA makes the following caveats:

All growth rates for the financial aggregates are seasonally adjusted, and adjusted for the effects of breaks in the series as recorded in the notes to the tables listed below. Data for the levels of financial aggregates are not adjusted for series breaks. Historical levels and growth rates for the financial aggregates have been revised owing to the resubmission of data by some financial intermediaries, the re-estimation of seasonal factors and the incorporation of securitisation data. The RBA credit aggregates measure credit provided by financial institutions operating domestically. They do not capture cross-border or non-intermediated lending.

Following the introduction of an interest rate differential between loans to investors and owner-occupiers a number of borrowers have changed the purpose of their existing loan; the net value of switching of loan purpose from investor to owner-occupier is estimated to have been $30.6 billion over the period of July 2015 to October 2015. These changes are reflected in the level of owner-occupier and investor credit outstanding. However, growth rates for these series have been adjusted to remove the effect of loan purpose changes.

The APRA ADI data is also out today, and we will look at this later.

Glenn’s Crystal Ball Gaze

RBA Governor Glenn Stevens, spoke about the “Long Run” tonight, and made some interesting predictions in the context of changes in both demography and the digital landscape.

It is not very controversial to suggest that China will grow more slowly on average than in the past decade, but it will still be a big deal given its overall size and the extent of transition required in its growth strategy. China’s financial weight will be increasingly apparent in markets. Those days, like in late August this year, when US and global markets are roiled by some event in China, will probably become more common. The growth transition towards services will have implications not just for the value of resource shipments from Australia, but for the Asian regional manufacturing chain.

But China’s demographics are not favourable. To be sure, the continuing process of urbanisation means that the labour available for manufacturing or services production may grow for a while. But, overall, China’s total working-age population will be shrinking over the years ahead. Contrast this with India, another large country, but with vastly different demographics. India’s population of working age will exceed China’s within a decade and continue to grow.[5] So India should become much more prominent in our conversation about the global economy and our own. Are we intellectually prepared for that?

The United States will still be a very large economy and, perhaps more important, still a leading source of innovation and dynamism. It will probably retain its current position of global leadership in international economic governance, though much depends on how two political establishments – the US’s and China’s – behave, including towards each other.

There are no prizes for guessing that the share of services in most economies will continue to increase. Health and aged care are obvious areas for expansion – another effect of demographics. It may be that jobs will be ‘robotised’. But on the other hand, in the long run we may need that to some extent. Demographic factors suggest strongly that, all other things equal, the problem isn’t going to be a shortage of jobs, but instead a shortage of workers.

‘Digital disruption’ will continue. Some of this will be faddish and no great aid to productivity. But other elements will mean fundamental changes to business models. It’s already obvious that models that rely on having an information advantage over a customer are struggling as information becomes ubiquitous. Models that can profit by using more information about the customer will be advantaged – up to the point at which customers decline to reveal any more about themselves. The issue of trust will be key.

On that note, I suspect the already-considerable resources devoted to IT security will grow further as awareness increases of cyber risk and its consequences. Maybe IT security will need to get as inconvenient as airport security and more costly – a whole new meaning of the term ‘digital disruption’. It remains to be seen whether, at some point, the potential risks of further connectedness might be judged to outweigh the benefits. There are, for example, some organisations sufficiently concerned about cyber risk that they construct a duplicated IT architecture – one connected to the world, the other sealed off. The issue of trust in cyber space may turn out to be every bit as problematic as that of trust in the financial system.

My guess is that global interest rates are still going to be very low for a good part of the decade ahead. Clearly there is a likelihood that the Federal Reserve will raise the fed funds rate next month or, if not then, pretty soon. Once it does, intense speculation will begin about a question much more important than the timing of the first increase, namely the timing of the second (and, by extension, the future path of the funds rate). But it seems likely that the pace of increase will be very gradual. The ECB and the Bank of Japan are a long way from even thinking about higher interest rates; the ECB is openly contemplating further easing. So the average policy rate in major money centres may be very low for quite a while.

In a low interest rate world, the problems of providing retirement incomes will become ever more prominent. The very low level of yields on fixed income assets means that it is very expensive today to purchase a secure stream of future income, which is what someone who is retiring is usually seeking. And there are more of such people, living longer.

The retiree can of course respond to this by holding more of her portfolio in dividend-paying stocks – accepting more risk. She may hope for a dividend stream that is fairly stable from year to year but that tends to grow over time. It certainly seems that many Australian listed corporates feel the pressure from shareholders to deliver that, even some whose earnings are inherently volatile.

Can the corporate sector realistically promise growing dividends over a long period? Not without being prepared to take the risk on investment in new products, processes and markets. How much of that risk an older shareholder base will allow boards and managements of listed entities to take is an important question.

Overall, in a world where a higher proportion of the population wants to be retired and living (even if only in part) off the return on their savings, those returns are likely, all other things equal, to be lower. Part and parcel of the same adjustment may be higher real wages for the smaller proportion of the population that is working. These changes, driven by demographics, may require some adjustment to our collective thinking about what is ‘normal’, not just for rates of return on assets but also for returns to labour.

Can We Trust The BBSW?

RBA’s Guy Debelle, Assistant Governor (Financial Markets) has been speaking about benchmark currency and interest rates. Benchmarks only work if they are trusted, and transparent. Of note are his comments on the local market, where the primary interest rate benchmark is the bank bill swap rate (BBSW).

As you may be aware, a few weeks ago, the Council of Financial Regulators issued a consultation paper on possible reforms to BBSW. I will run through the motivation for doing so as well as the possible options we canvassed in the consultation paper.

Given its wide usage, BBSW has been identified by ASIC as a financial benchmark of systemic importance in our market. Hence it is important there is ongoing confidence in it.

As you may know, BBSW was calculated for a number of years by, each day, asking a panel of banks to submit their assessment of where the market was trading in Prime Bank paper at a particular time of the day. While it was a submission-based process, it was different from LIBOR in that it was the assessment of the borrowing cost of a notional Prime Bank, informed by observable transactions, rather than an assessment of a submitting bank’s own borrowing costs.

In response to the prospect of a large number of the banks on the submission panel no longer being willing to provide submissions, the calculation of BBSW was reformed in 2013 in line with the International Organization of Securities Commissions’ (IOSCO) Principles for Financial Benchmarks, which were issued in July 2013.

Since 2013, the Australian Financial Markets Association (AFMA) calculates BBSW benchmark rates as the midpoint of the nationally observed best bid and best offer (NBBO) for Prime Bank Eligible Securities, which are bank accepted bills and negotiable certificates of deposit (NCDs). Currently, the prime banks are the four major Australian banks. The rate set process uses live and executable bid and offer prices sourced from interbank trading venues approved by AFMA, which are currently ICAP, Tullett Prebon and Yieldbroker. The bids and offers are sourced from three times around 10am each day.

While the outstanding stock of bills and NCDs issued by the Prime Banks has increased since 2013 to around $140 billion, trading activity during the daily BBSW rate set has declined over recent years. The consultation paper illustrates how low the turnover currently is. There are quite a number of days were there is no turnover at all at the rate set. The low turnover in the interbank market raises the risk that market participants may at some point be less willing to use BBSW.

This is the motivation for the CFR’s consultation to ensure that BBSW remains a trusted, reliable and robust financial benchmark.

Some preliminary data collected from the four major Australian banks indicate that there is substantially more activity in the NCD market than is being measured at the rate set, with the activity mainly occurring outside the interbank market. At least $100 million in NCDs were bought or sold on almost all business days, with activity almost entirely at the 1-, 3- and 6- month tenors. However, the non-bank participants that buy and sell NCDs tend to transact bilaterally with the issuing bank, with the price struck at the (yet to be determined) BBSW ahead of the actual rate set, rather than at a directly negotiated rate. If these participants could be encouraged to buy and sell NCDs at outright yields, then these transactions may have the potential to underpin the BBSW benchmark.

Hence the consultation paper proposes one option for reform which would be to continue with the current NBBO calculation methodology, but to underpin the executable prices with a broader set of NCD market transactions contracted up to the time of the rate set. By more firmly anchoring the BBSW benchmark to observable transactions entered into at arm’s length between buyers and sellers in the market, this may ensure that the benchmark remains a credible indicator of rates in the market.

For this option to be feasible, it would be necessary for the banks to directly negotiate the interest rates on their NCDs with third parties, rather than linking the rate to BBSW. This would require a change to the existing market practice. (In this regard this option has some similarities with the FX benchmark reforms where prior to the reforms, participants also agreed to transact at a yet to be determined price and at the midpoint of the fix.)

Another option for reform, akin to the proposed methodology for LIBOR, would be for the banks to submit to the benchmark administrator their assessment of their aggregate cost of wholesale funding, based on their transactions in a particular window. That is, the banks would do the aggregation and the administrator would only need to average the (currently) four submissions. An alternative option would be for the banks to submit all their transactional data to the benchmark administrator who would then itself do the aggregation. Both of these options would need to provide for circumstances in which the Prime Banks had not executed any transactions in the relevant window.

The final option would be to accept the current system as it is, notwithstanding the very low turnover at the rate set.

The consultation is open until 3 December.


RBA Minutes – Still Accommodative

The RBA minutes for November do not tell us much that is new, other than confirming again the categorisation of loans by the banks is likely to continue, and monetary settings are considered to be accommodative, despite recent mortgage rate hikes.

The major banks in Australia continued to raise equity to meet the changes to minimum capital requirements announced by APRA around mid year, which would take effect from July 2016. Equity as a source of funding for banks had increased by around ½ percentage point to 8 per cent of total funding. The largest banks had increased standard variable housing rates in October by 15–20 basis points. Members noted that widening margins on mortgage lending were in part offsetting lower margins on lending to larger businesses, for which lending rates had continued to decline in the face of strong competition. Deposit rates had been lowered and funding costs more generally had declined.

Over the course of 2015 to date, Australian financial institutions had made substantial revisions to the data used to categorise housing, business and personal credit. The revisions were particularly large for the split of housing credit between owner-occupation and investment, with the share of housing credit extended to investors revised from 35 to 40 per cent. More recently, as a result of the increase in lending rates to investors in housing, a significant amount of housing lending had been reclassified from investment to owner-occupation. Further switching was expected in coming months. The revisions had resulted in discrete breaks in the level of the two components of housing credit, complicating the assessment of the rate of growth in these two components. Members noted that the stock of total lending for housing as well as its growth rate were not materially affected by the revisions.

At the time of the meeting, pricing in financial markets reflected around a 50–50 expectation of a reduction in the cash rate at the present meeting.

Considerations for Monetary Policy

In considering the stance of monetary policy in Australia, members noted that the global economy was expanding at a moderate pace, with some further softening in conditions in the Asian region, continuing growth in the United States and a recovery in Europe. The slowdown in Asia had been more persistent than earlier anticipated and had contributed to lower commodity prices, along with increased supply of commodities, including from Australia. The terms of trade for Australia had declined further. Monetary policy was accommodative in many economies and the low level of oil prices was expected to support growth in Australia’s major trading partners over the next few years. Inflation rates remained low and below central banks’ targets.

Members noted that recent data on economic activity in Australia suggested that the moderate economic expansion had continued. The very low level of interest rates was supporting growth in household consumption and dwelling investment. In addition, the Australian dollar was adjusting to the significant declines in key commodity prices and boosting demand for domestic production. This had been most evident in the services sector, which had experienced strong employment growth over the past year. While measures of non-mining investment intentions had remained subdued, surveys of business conditions had strengthened to above-average levels. These factors suggested that the prospects for an improvement in economic conditions had firmed a little over recent months.

Overall, the forecast for the Australian economy remained for growth to strengthen gradually over the next two years as the drag on GDP growth from falling mining investment waned and activity progressively shifted to non-mining sectors of the economy. However, members recognised that there was still evidence of spare capacity, including the relatively high unemployment rate, low wage growth and the lower-than-expected inflation outcome in the September quarter. The gradual nature of the pick-up in domestic growth suggested that spare capacity would persist for some time. Inflation was forecast to be consistent with the target over the next one to two years, but somewhat lower than earlier expected.

In these circumstances, members judged that monetary policy needed to be accommodative. While the recent changes to some lending rates for housing would reduce the support to demand from low interest rates slightly, overall conditions were still accommodative. Credit growth had increased a little over recent months and housing prices had risen further in Melbourne and Sydney, though the pace of growth had moderated and housing prices were steady in other cities. Members noted that supervisory measures were helping to contain risks that may arise from the housing market.

Taking the above information into consideration, members decided that leaving the cash rate unchanged at this meeting was appropriate. They judged that the inflation outlook may afford some scope for further easing of monetary policy, should that be appropriate to lend support to demand. The Board would continue to assess the outlook, and whether the current stance of policy would most effectively foster sustainable growth and inflation consistent with the target.