Households Necks In The Debt Noose

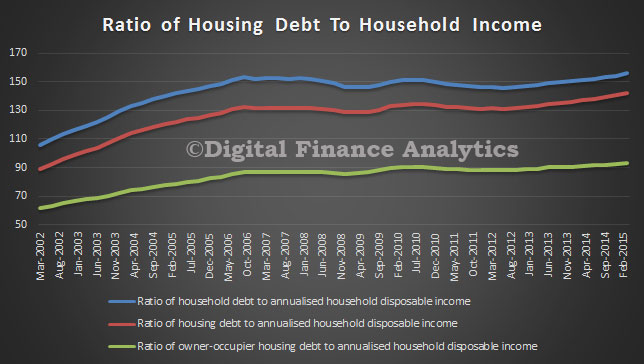
The ABS data released yesterday, highlights that overall household debt is sky high, much of it linked to mortgage borrowing. Whilst household net worth is over $8 trillion, its mainly thanks to house price inflation (and stock market holdings inflated by ultra low interest rates and QE). The RBA data tells the story. Using their data, (E2 HOUSEHOLD FINANCES – SELECTED RATIOS) we see that the ratio of housing debt to income is rising, in fact both the ratio covering owner occupied housing, and that covering both owner occupied housing and investment housing has risen significantly.

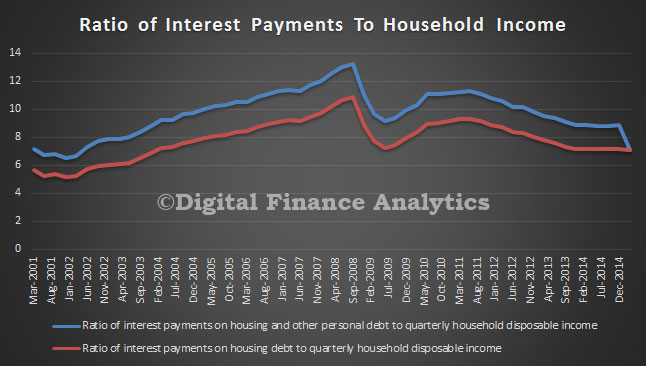
Household-Debt-Ratio-1Of course, interest rates are low, so the ratio of interest payments to income are lower than when interest rates were at their peak in 2008. So the common assumption is that whilst debt is high, households can service it, and those with higher incomes have the greatest debt exposure.

Household-Debt-Ratio-2 In addition, banks are now “required” by APRA to use an interest rate of 7% when considering a loan application, higher than the common practice of a number of banks. APRA highlighted recently the range of rates banks were using for serviceability testing.

Chart 4: Existing mortgage debt shows interest rate used in investor serviceability assessment between 4%-9%

Some banks were underwriting loans with a very small serviceability buffer, so will have loans on book at greater risk, but at the moment serviceability is not required to be marked to market on an ongoing basis (though that may change under Basel IV).

This takes us to mortgage stress. Now, DFA has been tracking mortgage stress for year. Low interest rates have got many out of difficulty.

Mortgage stress is a poorly defined term. The RBA tends to equate stress with defaults (which remain at low levels on an international basis). A wider definition is 30% of income going on mortgage repayments (not consistently pre-or post tax). This stems from the guidelines of affordability some banks used in 1980’s and 1990’s, when economic conditions were different from today. This is a blunt instrument. DFA does not think there is a good indicator of mortgage stress, so we use a series of questions to diagnose mortgage stress focusing on owner occupied households. Through these questions we identify two levels of stress – Mild and Severe.

  • Mild = households maintaining repayments, but by reprioritising expenditure, borrowing more on loans or cards, and refinancing
  • Severe = households who are behind with their repayments, or are trying to sell, or are trying to refinance, or who are being foreclosed

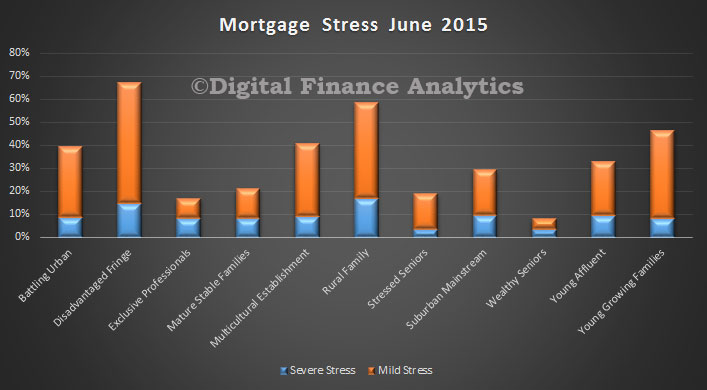
In our latest data on stress we have noted some concerning trends. Despite the ultra-low interest rates, the proportion of households in some degree of mortgage stress is rising. This is because incomes are static, household expenses are rising and the average mortgage is larger, especially in some centres like Sydney. So if we look at segmented data we see that for some borrowing households, as many as 10% are registering in the severe category, and many more in the mild category. Many are just, and only just keeping their heads above water. Larger loans means they are more leveraged.

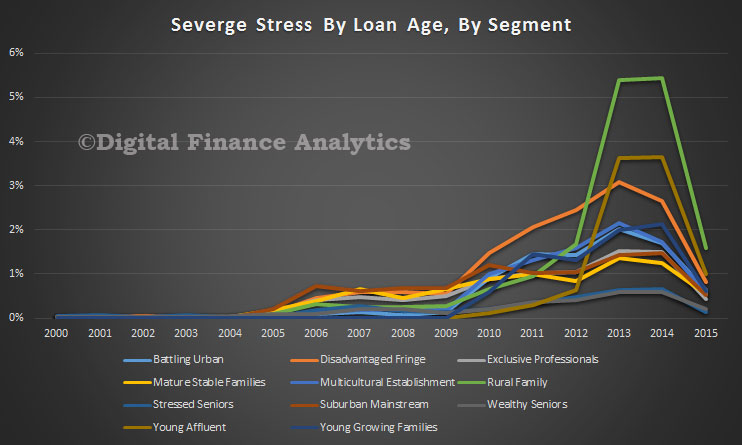
Stress-June-2015If we look at the severe stress by segment, by when the loan was last drawn down, we see significant peaks in more recent years (when loans were larger) than older loans. Typically in in years 2 and 3 of a loans life that stress is highest.

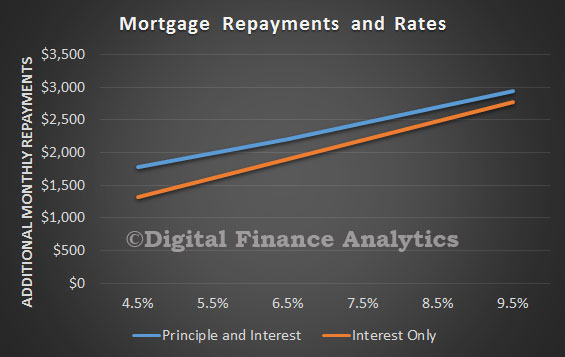
Loan-Age-and-StressNow consider this. Assuming an average $350,000 mortgage over 30 years, if rates were to rise 1%, the average monthly costs for a p&i loan would rise by $220 and for an interest only loan $291. Such a rise would likely lift the proportion of households with mortgage stress from 35% of all borrowing households to close to 50% in our modelling.  Interest only loans are more sensitive to rises.

We conclude that many households are a hair’s breadth away from difficulty. Another way of asking a similar question is how much free cash is available at the end of the month. For many households with large mortgages and average incomes, the short answer is nothing. No flex. No safety net.  Whilst in the early 2000’s incomes were rising fast there is not easy exit this time. Many households are in the debt noose. Let’s hope no-one pulls the rope.

Repayment-Table

When monetary policy reaches its limits, what of fiscal policy?

From The Conversation. In a recent address to the Economic Society of Australia, the Reserve Bank Governor Glenn Stevens hit the nail on the head when he remarked that “monetary policy alone can’t deliver everything we need and expecting too much from it can lead, in time, to much bigger problems”.

What was particularly important in this address was the (implicit) suggestion that the answer goes hand in hand with another question; what should we expect from fiscal policy?

Though at first sight it might appear to be a rather tenuous link, a decent review of the taxation system and more generally of the revenue side of the fiscal equation, may be a big help in taking some of the burden off monetary policy from its current constraints.

Stevens is not alone in suggesting that too much might be being expected of central bankers in promoting growth and reducing unemployment. Similar sentiments have come from former Federal Reserve Chairman, Ben Bernanke.

It is useful to distinguish two aspects to the question of whether we expect too much of monetary policy. The first is whether we can expect it to work when the economy is on the downswing in the same degree as when it is on the upswing. In particular, can we expect an easing of monetary policy to stimulate growth as effectively as a tightening of monetary policy can choke it off.

Central banks for the most part have a brief of keeping inflation within a certain range and, with that done, to assist in keeping the economy’s growth rate near to trend; in the best of worlds, consistent with full employment.

Expectations about what more accommodating monetary policy can do for a sluggish economy have at times had to take a reality check here and in other parts of the world. Bringing interest rates down and making the assets side of bank balance sheets more liquid via “quantitative easing” can stimulate the real economy only to the extent that the binding constraint on spending by consumers and business is a financial one.

But in an environment where producers expect sluggish or even falling domestic or export demand, one would also expect to see sluggish investment demand, regardless of interest rates or the willingness of banks to lend. In other words, slow growth in demand may well mean expected rates of return from investment in new plant are revised down as much as interest rates.

As Stevens noted in his address, lower interest rates may not help consumption expenditure much either in present circumstances, since household sector’s debt burden means that it “has the least scope [compared with government and corporations] to expand their balance sheets to drive spending”.

And, as plenty of commentators have noted, injections of liquidity and easing credit conditions may be channelled into financial assets which don’t have significant stimulatory effects on the real side of the economy, which is where we need it for growth and reduced unemployment.

Some have even argued that a lengthy period of easy monetary policy has adverse distributional effects benefiting owners of stock and property. However the precise distributional effects of seem rather complex and less than clear cut, and will depend in part on whether or not accommodatory monetary policy stimulates the economy and hence employment growth.

The second and perhaps broader aspect related to expectations about what monetary policy can and should do is that it is often asked to effectively make use of a limited toolbox to deal with conflicting objectives. One could be forgiven for thinking that in this country we have only one macro policy instrument – interest rates – to both control inflation and manipulate growth in economic activity.

The obvious elephant in the room here is fiscal policy.

In his address Stevens actually raises an old and interesting idea about fiscal policy: that it can have a stimulatory role perfectly consistent with “sound financing” (to borrow a perverted phrase with which Keynes’ was forced to do battle); where stimulatory expenditure and any increased debt are on the capital or investment side of the budget.

Such fiscal stimulus may even have what some economists refer to as a “crowding-in” effect: a positive impact on expectations about growth, as Stevens notes. This idea also provides a bulwark against the nonsense about fiscal contraction or consolidation (as it’s euphemistically called) being necessary to stimulate the economy.

The caution here from the Governor is also sound it seems; that capital expenditure is not overnight, so the confidence boost is probably more important for the short-term than the actual direct impact on government expenditure.

In any case, if fiscal policy in general and government expenditure in particular is to come back into its own as a macro policy instrument, reform of the revenue base and thus the tax system is paramount.

But note here, a significant driver of tax reform should be the sustainable funding of an expenditure side which fulfils its macro economic role as a generator of demand growth and its social role in generating infrastructure.

Tax reform should not be seen exclusively as code for a lower taxes, this being an end, the means to which to point of is government withdrawing from its expenditure responsibilities. Unfortunately, this latter view seems to dominate much discussion in this country.

From a macro policy standpoint, looking at tax or more appropriately at the revenue side of the fiscal equation may well have a positive spin-off for monetary policy, leaving it to focus, if that is the continued wish of the political masters, on inflation.

And if one is worried about complex adverse distributional effects of monetary policy, expenditure on infrastructure, done properly, would surely help redress inequality by lifting the social wage.

Author: Graham White, Associate Professor, School of Economics at University of Sydney

Low Interest Rates Not Connected With Business Investment Decisions

The RBA today published a paper on business investment decisions and their relationship to interest rate settings. They are clearly trying to understand why, when interest rates are in absolute terms low, business investment is still flat. Indeed in real terms, non-mining business investment in Australia has been little changed for several years.

“Firms typically evaluate investment opportunities by calculating expected rates of return and the payback period (the time taken to recoup the capital outlay). Liaison and survey evidence indicate that Australian firms tend to require expected returns on capital expenditure to exceed high ‘hurdle rates’ of return that are often well above the cost of capital and do not change very often. In addition, many firms require the investment outlay to be recouped within a few years, requiring even greater implied rates of return. As a consequence, the capital expenditure decisions of many Australian firms are not directly sensitive to changes in interest rates. Furthermore, although both the hurdle rate of return and the payback period offer an objective decision rule on which to base expenditure decisions, the overall decision process is often highly subjective, so that ‘animal spirits’ can play a significant role.”

“Analysis of the investment decision process helps to explain the subdued growth of non-mining business investment. First, there is some evidence of a tightening in investment criteria since the global financial crisis. For example, some firms have reduced their maximum payback period, suggesting implied discount rates for investment decisions may have increased even as long-term interest rates declined.

Second, identifying investment opportunities with returns exceeding the typical hurdle rate of around 15 per cent may be difficult for many firms given their expectations for the growth of their sales.

It is clear from discussions with liaison contacts that the overall decision process is highly subjective, which in turn allows ‘animal spirits’ to play a role. As noted, firms frequently reject investment decisions that satisfy self-imposed quantitative criteria on other grounds, such as concerns about the economic outlook, the availability of capital within the company, or shareholders’ preferences. Some managers have noted that they have taken a more cautious approach to capital expenditure since the financial crisis, either because there is more uncertainty about the future or they are more averse to taking risks. As a consequence, firms with a range of opportunities may only be willing to pursue the most profitable projects in the current economic environment.

Although changes in interest rates may not have a direct effect on investment decisions for many firms, interest rates will still have a powerful indirect influence on firms’ investment decisions. For example, a reduction in interest rates may improve firms’ cash flows through reductions in interest payments, freeing up cash for other purposes. More broadly, interest rates affect economic activity via a number of channels, including the saving and spending behaviour of households, the supply of credit, asset prices and the exchange rate, all of which affect the level of aggregate demand.

“Detailed discussions with managers and survey evidence indicate that the lack of direct interest rate sensitivity partly arises because Australian firms typically use effective discount rates that are high and sticky to evaluate capital expenditure opportunities. This reflects the use of hurdle rates that are considerably higher than the weighted average cost of capital and are adjusted infrequently, or a requirement that any outlay must be expected to be recouped within a few years”.

We think it may have something to do with the hurdle rate to assess projects, but it has more to do with levels of confidence. Many firms are still in hunker down and survive mode, not one which is conducive to encourage investment for future growth. Lack of demand of course becomes self-fulfilling.

Structural Features of Australian Residential Mortgage-backed Securities

The RBA has published a paper on Structural Features of Australian Residential Mortgage-backed Securities. It provides a useful overview of the securitisation market in Australia, which is one important element in product funding. We have summarised some of the key points.

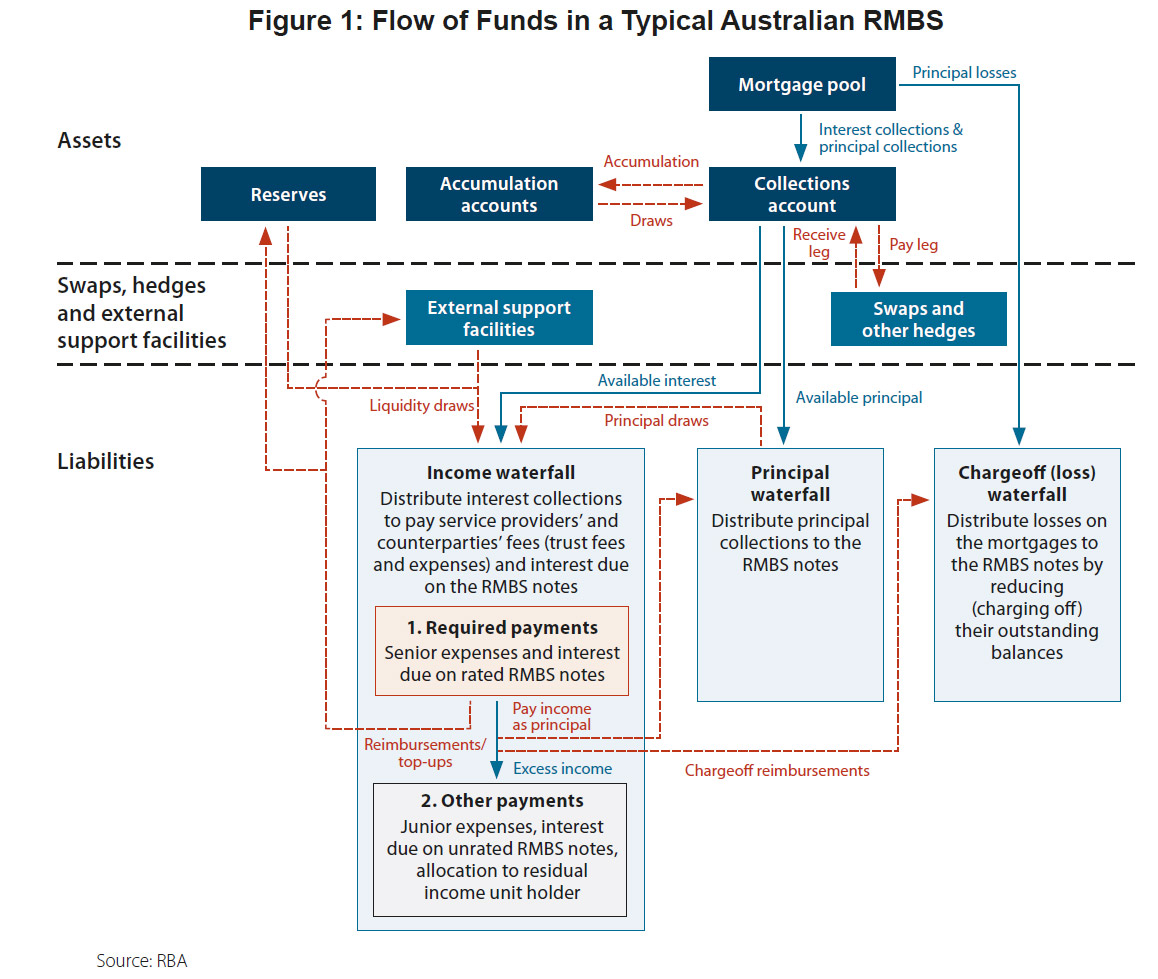
A residential mortgage-backed security (RMBS) is a collection of interrelated bonds that are secured by a dedicated pool of residential mortgages (the ‘mortgage collateral pool’). The payments of principal and interest on these bonds are funded from the payments of principal and interest made on the underlying mortgage collateral by the mortgagors. Historically, RMBS have provided an alternative to bank deposits as a source of funding for residential mortgages. This has been particularly important for smaller authorised deposit-taking institutions (ADIs) and non-ADIs that have limited access to deposit funding or term funding markets.

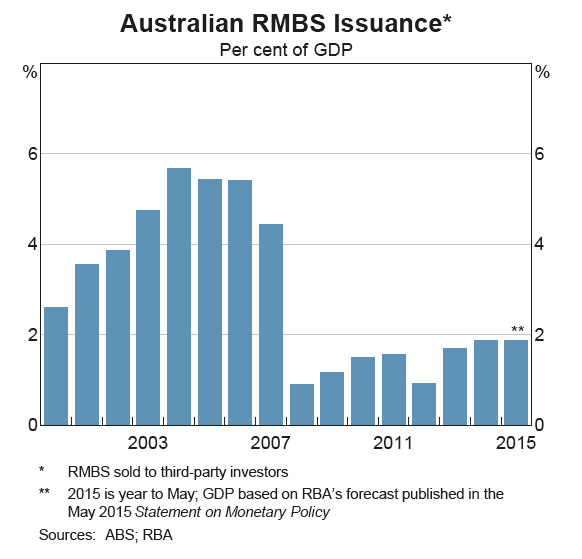
Securitisation-SchematicBy allowing smaller institutions to raise funding in the capital markets, RMBS promote competition between lenders in the residential mortgage market. After increasing steadily in the early 2000s, issuance of Australian RMBS to third-party investors fell in the wake of the global financial crisis when these securities were adversely affected by a loss of confidence in the asset class globally despite the low level of mortgage defaults in Australia. The market has recovered somewhat over the past couple of years.

RMBS-June-2015RMBS have been an eligible form of collateral in repurchase agreements (repos) with the RBA since 2007. During the height of the global financial crisis, RMBS formed a significant part of the RBA’s repo collateral and hence played an important role in the RBA’s response to the crisis. Currently, RMBS form the largest class of securities held under the RBA’s repos, although unlike the earlier episode, this has been in response to innovations in the payments system. From 1 January 2015, the RBA has provided a Committed Liquidity Facility (CLF) to eligible ADIs as part of Australia’s implementation of the Basel III liquidity standards. In total, the CLF provides ADIs with a contractual commitment to $275 billion of funding under repos with the RBA, subject to certain conditions. Given that RMBS are eligible collateral that could be provided to the RBA were the CLF to be utilised, they represent a substantial contingent exposure for the RBA and, hence, understanding RMBS is particularly important in terms of managing the RBA’s balance sheet.

While discussions of RMBS often focus on the mortgage collateral pool, as all payments to investors are made from the cash flows generated from this pool, the structural features of RMBS play an equally  important part in determining the risks facing the holders of these securities. The ‘structure’ of an RMBS refers to the number and size of the interrelated bonds of the RMBS, the rules that determine how payments are made on these bonds and various facilities that support these payments.

This article provides a summary of the structural features typically found in Australian RMBS and how these have evolved over the past decade.

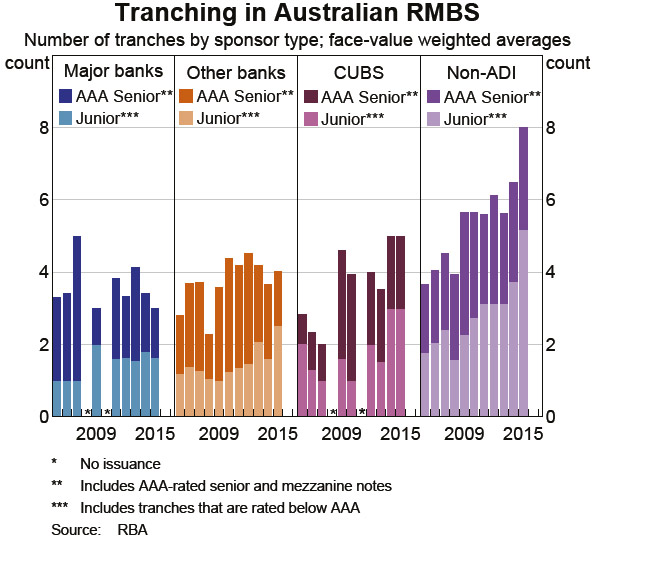
One element of note is tranching.

Securitisation-Tranching-June-2015In summary, tranching enhances one part of the RMBS liability structure at the expense of another, by reducing credit and prepayment risk on the senior notes, while increasing these risks for the junior notes. Since 2005, there has been an increase in the degree of tranching in Australian RMBS. The average number of notes in an RMBS has increased from three in 2005 to four in 2015, with most of the increase occurring after 2008. The increase has been concentrated in the junior notes (which are typically rated below AAA), with the average number of such notes increasing by 1.5 per RMBS. The increase has been more pronounced in RMBS issued by non-ADIs.

The higher number of tranches for RMBS issued by non-ADIs reflects the need for non-ADI sponsors to fund their mortgage lending fully through RMBS issuance. This has led RMBS issued by non-ADIs to be structured with a larger number of tranches with different characteristics that appeal to a broad range of investor risk appetites.

The structures of Australian RMBS have evolved over time. Australian RMBS have generally become more structured over the past 10 years, especially since the global financial crisis: the tranching of both credit and prepayment risk has increased; the use of principal allocation mechanisms that vary over the life of the RMBS has become more widespread; bullet notes have been added; and various external and internal support facilities have continued to be used.

The increased structuring, which has developed to address changing market conditions, does not necessarily create more risk for investors, especially if they are provided with transparent and complete information about RMBS structures. Indeed, there has been a significant increase in the size of the credit enhancement provided to the most senior notes through the subordination of junior notes, with the increase in excess of the requirements of the credit rating agencies. The reliance on external credit support from LMI has also declined.

Understanding RMBS structures is essential to the effective risk management and valuation of RMBS because the RMBS structure determines how the risks generated from the securitised mortgages are borne by each particular RMBS note. Given the importance of RMBS as collateral in the RBA’s repurchase agreements, the RBA has a keen interest in understanding RMBS structures.

The RBA’s reporting requirements for repo-eligible asset-backed securities, which come in effect from 30 June 2015, will provide standardised and detailed information, not only on the mortgages backing RMBS, but also on the RMBS structures, including their cash flow waterfalls.


Wage Growth Decline

The RBA published a paper on The Decline in Wage Growth. In real terms wages are static or falling for many, and we note from our own surveys that as a result, households are under increasing stress, because costs of living continue to rise. In fact the recent cuts in the mortgage rate as the cash rate has fallen, as effectively got people off the hook. This would reverse quickly if rates started to rise, because the average mortgage is bigger now, and held for longer. But whats behind the decline? We summarise the discussions.


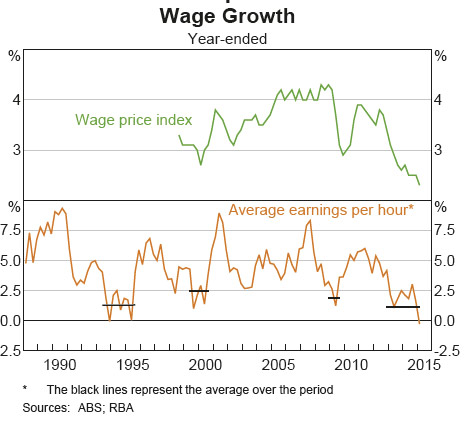
The rate of wage growth has important implications for the macroeconomy. Wages are the largest source of household income and the largest component of business costs, and so have significant implications for consumer price inflation. Wage growth has declined markedly in recent years to the lowest pace since at least the late 1990s, according to the wage price index.

Wage-Price-Trend-2015Wage measures with a longer history suggest that this has been the longest period of low wage growth since the early 1990s recession. Across these measures, the rate of annual wage growth has declined to around the pace of inflation, about 2–3 per cent. The slowing in wage growth has occurred alongside faster growth in labour productivity. This has also helped to moderate growth in labour costs for firms, beyond the impact of lower wage growth. Accordingly, growth in the labour cost of producing a unit of output (unit labour costs, or ULCs) has also declined markedly since 2012. Indeed, the level of ULCs has been little changed for more than three years – the longest such period since the early 1990s.

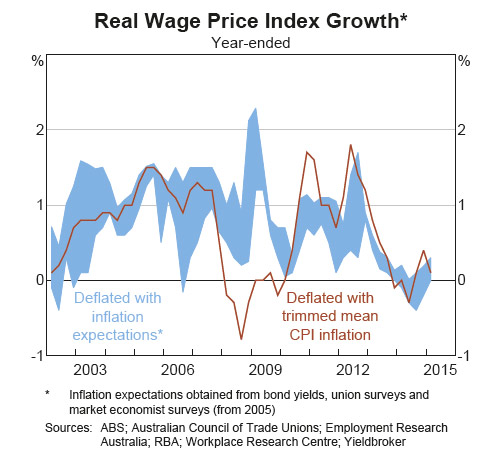
Even accounting for temporarily lower inflation expectations, real wage growth from the perspective of consumers has declined markedly, to around zero.

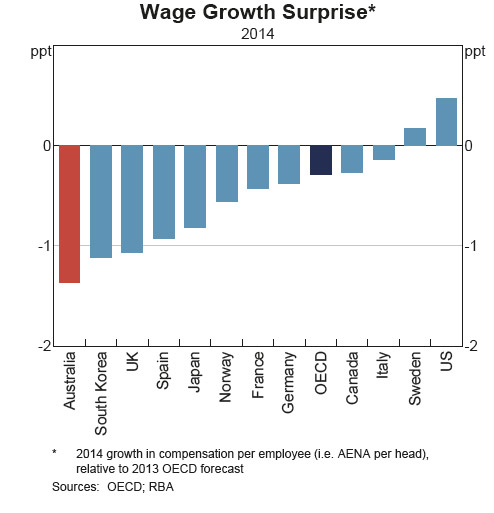
Real-Wage-Growth-2015The recent low wage growth has not been unique to Australia. Internationally, wage growth has been lower than forecast for several developed economies in recent years, including some where labour markets have tightened considerably. Various factors have been proposed to explain this weakness, including secular trends that have been in place for some time and have also resulted in a general decline in the labour share of income. However, the decline in wage growth in Australia stands out, with the extent of the forecast surprise for Australia particularly large in the context of OECD countries in recent years

Wage-Growth-OECD-2015Several factors appear to explain much of the decline in Australian wage growth. There has been an increase in spare capacity in the labour market, and expectations of future consumer price inflation have declined to be a bit below average. Inflation in output prices in recent years has been particularly subdued, in large part owing to the lower terms of trade. More generally, the decline in the terms of trade and fall in mining investment in recent years mean that the economy requires a lower ‘real’ exchange rate, which has been in part delivered by low wage growth. A statistical model indicates that these factors do not fully explain the extent of decline in wage growth, suggesting that other factors, such as an increase in the flexibility of wages to market conditions, may also have contributed.


A range of related factors appear to explain much of the decline in wage growth in Australia in recent years. Below-average growth in economic activity has translated into subdued growth in labour demand, which has resulted in an increase in spare capacity in the labour market. At the same time, expectations for consumer price inflation have moderated to be below average. The decline in the terms of trade and falls in mining investment appear to have played a particularly important role, weighing on economic activity and placing pressure on firms to contain costs. This has partly unwound the relatively strong inflation in Australian unit labour costs over the period of the mining boom, which was part of the economy’s adjustment to the domestic income boost from the higher terms of trade. Altogether, the result has been an adjustment in Australia’s relative labour costs, improving cost competitiveness against other advanced economies. In effect, this has assisted in bringing about some adjustment of the real exchange rate. Statistical estimates suggest that these factors explain much, but not all, of the episode, meaning there may also have been some other forces at play including an improvement in the flexibility of wages.

While a large wage adjustment has taken place, wage growth is widely expected to remain low. Evidence from the Bank’s liaison with businesses, alongside surveys of firms and union officials, suggest that the general pace of wage growth is not expected to pick up over the year ahead. One further factor that may continue to weigh on wage growth is a ‘pent-up’ adjustment. Reports through the Bank’s business liaison in recent years have indicated that many firms and employees have been reluctant to bargain for wage growth below expected inflation of 2–3 per cent. Accordingly, wage outcomes of 2–3 per cent have been relatively common over the past couple of years among liaison contacts. Outcomes lower than this, which would imply a fall in real consumer wages, are generally seen to have a negative effect on worker morale and productivity, as well as on the retention of quality staff. So while the decline in wage growth has been large, it might have been larger still if not for this element of rigidity in real wage growth. Accordingly, a degree of ‘pent-up’ downward pressure on wage growth might remain for a time, even if labour market conditions more generally were to improve.

Bank Fees $12 Billion in 2014

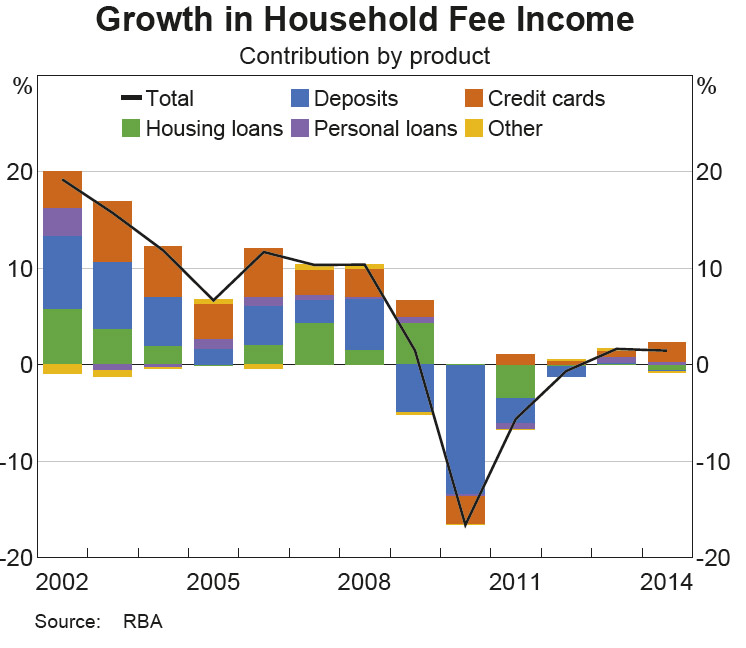
The RBA just published the results of its annual bank fee survey, based on data from 16 institutions covering 90% of the Australian banking sector. Last year, overall fees rose 2.8% to $12 billion compared with 2.6% the previous year. The rise is a combination of rises in unit prices, and volumes. Households fees rose 1.5% to $4,141 million, and business grew 3.5% to $7,791 million. The data does not include wealth management, broker, loan mortgage insurance, or other fees across financial services and the non-bank sector.

Looking in more detail at households, higher fee income reflected growth in credit card and personal lending fees, whereas fee income from housing lending and deposit accounts declined.

Household-Fees-2014Fee income from credit cards, which represents the largest component of fee income from households, increased by 5.9 per cent. You can read our previous analysis of the credit card business here.

Total deposit fee income decreased slightly in 2014, following a modest increase in 2013. The decrease in fees from household deposits was broad based across most types of fees on deposit accounts. In particular, account-servicing and transaction fee income, as well as some fee income on other non-transaction accounts (e.g. break fees on term deposit accounts) declined notably. This decrease was the result of fewer customers incurring these fees rather than a decrease in the level of fees, as well as customers shifting to lower fee products. However, this was partially offset by an increase in income from more frequent occurrences of exception fees (such as overdrawn fees and dishonour fees) and foreign exchange conversion fees being charged on deposit accounts involving such transactions.

Total fee income from housing loans decreased in 2014, with all components of housing loan fee income decreasing, including exception fees. This was due to a combination of fewer instances of penalty fees being charged, and lower unit fees as a result of strong competition between banks in the home lending market. Similar to 2013, there was a decrease in fee income from housing lending despite strong growth in such lending. Several banks again reported waiving fees on this type of lending for some customers.

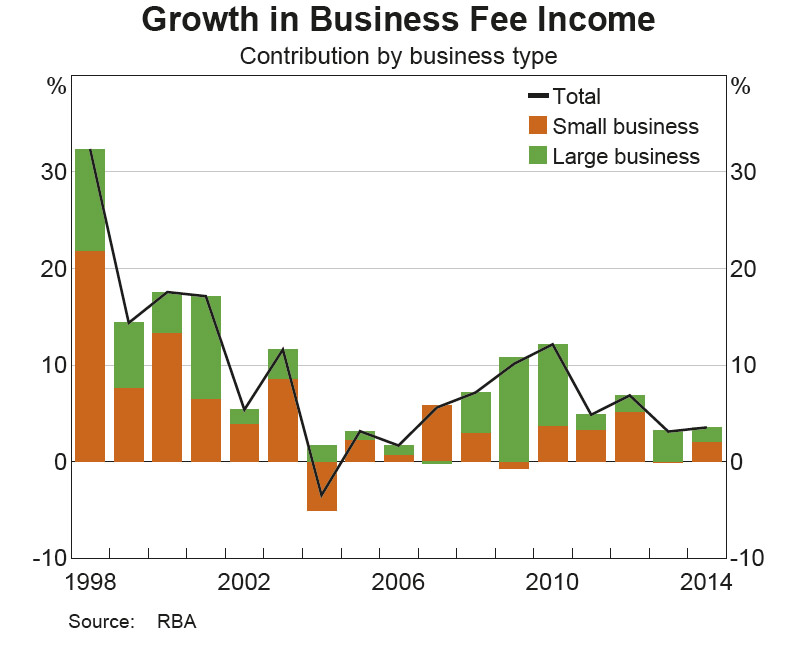
Fees to business rose, across both small and large businesses.

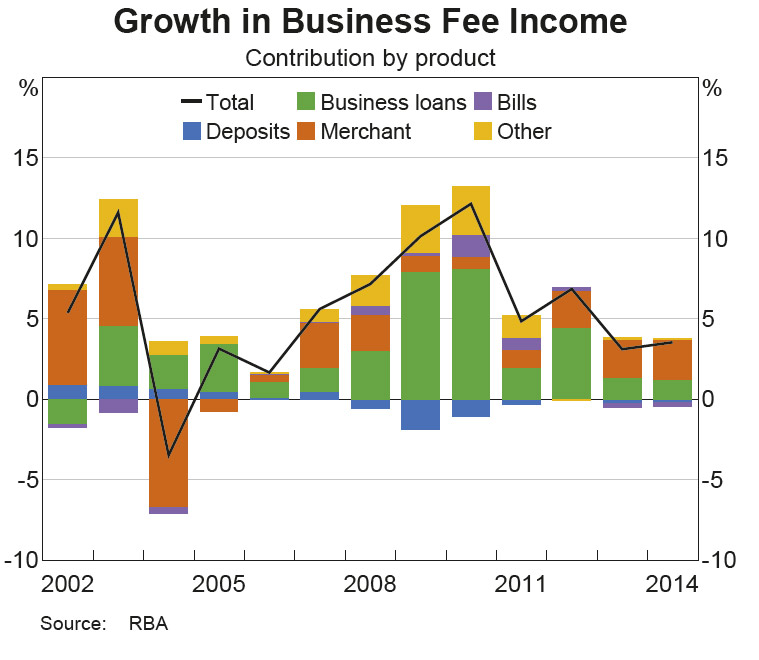
Business-Fees-By-Coy-Size-2014Growth was driven by increases in merchant service fee income and, to a lesser extent, fee income from loans. Business fee income from deposit accounts and bank bills declined over 2014.

The increase in merchant service fees was mainly attributable to an increase in utilisation of business credit cards and a slight increase in some merchant unit fees. Merchant fee growth was approximately evenly spread across both small and large businesses. The increase in loan fee income was mainly from an increase in account-servicing and exception fees from small businesses, which was a result of higher lending volumes (including through the introduction of some new lending products). Fee income from loans to large businesses increased slightly due to a higher volume of prepayment fees (though this was mostly offset by declines in other fee income from large businesses).

The increase in exception fee income from business loans was also mainly from small businesses, mostly in the form of honour fees (fees charged in association with banks honouring a payment despite insufficient funds in the holder’s account).

Fee income from business deposits continued to decline in 2014, with most of the decrease resulting from lower account-servicing and transaction fees, particularly for small businesses (small businesses account for the majority of business deposit fee income). The decrease was the result of a combination of lower volume growth and customers shifting to lower fee products.

Business-Fees-By-Type-2014  We observe that the “fee wars” appears to be over now (triggered by NAB a few years ago), and we expect to see subtle rises in fees as bank margins come under increasing pressure. Also, small business bears the brunt of the charges across a number of categories, and we expect this to continue, because the sector is under less pressure from a bank competitive standpoint, and many SME’s have no where else to go.

RBA Minutes For June Meeting Released

The latest minutes tells us little about future prospects for rate changes, the RBA is waiting to see what happens but with overall growth expectation weak. They recognise risks in the housing sector in some centres, but also see slow business investment and spare capacity in the system. Between a rock and a hard place!

International Economic Conditions

Members noted that data released over the past month confirmed that growth of Australia’s major trading partners had eased a little in the March quarter and were consistent with around-average growth in the period ahead. Measures of global headline and core inflation rates had remained subdued in April.

Following a moderation in growth in the March quarter, some of the recent Chinese data had been more positive. Growth of industrial production and retail sales had picked up a little and conditions in the property market had improved somewhat, particularly in the larger cities. However, growth of fixed asset investment, particularly in the real estate sector, had eased further. While the production of steel had increased over recent months, its rate of growth remained significantly lower than earlier trends. The Chinese trade data had indicated weakness in both exports and imports in recent months, although imports of Australian iron ore had continued to rise. Members noted that the Chinese authorities had eased a number of policies and announced initiatives intended to support growth.

In Japan, national accounts data for the March quarter showed that economic activity had grown at a moderate pace. Wage growth had increased over the past year and the unemployment rate had declined to its lowest level in almost 20 years. For the remainder of east Asia, GDP had grown slightly below its average pace of recent years in the March quarter and both headline and core inflation had eased. In India, economic conditions had improved over the past year or so.

In the United States, indicators of activity had been mixed, though more positive than suggested by the weak March quarter GDP data, which had largely reflected temporary factors. Labour market conditions had continued to improve and consumption growth had remained relatively strong. Business activity indicators had generally remained positive, though they were a little weaker than late in the preceding year.

Economic conditions in the euro area had continued to improve, but the recovery remained modest and inflation continued to be well below the European Central Bank’s target.

Overall, commodity prices had been little changed since the previous meeting. The prices of coal and base metals had fallen, while the price of iron ore had increased.

Domestic Economic Conditions

Members noted that the March quarter national accounts would be released the day after the meeting. The data available prior to the meeting suggested that GDP growth had been close to average in the quarter, although below average on a year-ended basis. Growth in household consumption for the March quarter was expected to have been around average, while both dwelling investment and resource exports appeared to have been growing strongly. In contrast, business investment was likely to have contracted. There continued to be spare capacity in product and labour markets, despite some improvement in labour market conditions over the past six months or so.

Members observed that the Australian Government Budget for 2015/16 had outlined a number of years of slightly larger deficits than had been forecast in the Mid-Year Economic and Fiscal Outlook update in December 2014. This mainly reflected lower commodity prices and weaker-than-expected growth of incomes. Members were informed that the budget policies were little different from what had been assumed for the forecasts presented in the May Statement on Monetary Policy. Members discussed the importance of including the fiscal positions of the states and territories in any assessment of the effect of fiscal consolidation on the aggregate economy.

Growth of retail sales volumes had been around average in the March quarter. Measures of consumer sentiment had picked up noticeably in May to be a bit above average. Much of this had been attributed to the Australian Government Budget and, in particular, the announcement of tax concessions for small businesses. Liaison suggested that there had been little change in the year-ended growth of the value of retail sales in April and May.

Dwelling investment looked to have grown strongly in the March quarter and forward-looking indicators of construction activity pointed to a further pick-up. Members noted that conditions in the established housing market had continued to vary across the country. Although housing price inflation had remained high in Sydney and, to a lesser extent, in Melbourne over recent months, there had been some divergence in price developments for different segments of these markets; price inflation of detached houses had increased, whereas price inflation for units had eased in both cities. Noting that housing price growth in other cities and regional areas had declined over recent months, members discussed the strength and composition of underlying supply and demand conditions in different parts of the housing market. They also observed that there was a relatively low stock of dwellings for sale in Sydney and Melbourne and that dwellings took only a short time to sell.

Members noted that housing credit growth overall had been broadly steady at around 7 per cent (on a six-month-ended annualised basis), though the latest data on loan approvals had showed a pick-up. Over the past six months or so, growth in investor credit had eased back to be running at an annualised pace of a bit above 10 per cent. However, over more recent months there had been solid increases in housing loan approvals to both owner-occupiers and investors, particularly in New South Wales, following earlier declines.

The available data suggested that private business investment had declined further in the March quarter, consistent with the forecast presented in the May Statement on Monetary Policy. Mining investment appeared to have fallen further, while non-mining investment looked to have been little changed over recent quarters. Members observed that there were diverging trends within the non-mining sector. Investment in some sectors, such as real estate and retail trade, had picked up in response to stronger growth in domestic demand, but investment had continued to fall in other sectors, such as manufacturing, where the rate of investment had been lower than the rate of depreciation in recent years. Members noted that a lower exchange rate would have an immediate beneficial effect on some sectors, such as tourism, but that it would need to be lower for a sustained period to have a significant effect on large investment decisions in other trade-exposed sectors.

Surveys of business conditions remained a bit above their long-run averages in April. In contrast, an economy-wide measure of business confidence had remained below its long-run average level, along with various measures of capacity utilisation. Also, the second reading from the ABS capital expenditure survey of businesses’ investment intentions for 2015/16 implied a fall in non-mining investment.

Trade data suggested that export volumes had increased strongly in the March quarter across most categories, including bulk commodities. Import volumes also appeared to have increased strongly, though capital imports had remained lower than their peak in 2012.

The labour force data continued to suggest that growth in employment and hours worked had been stronger over the past six months or so than the preceding period and the unemployment rate had been relatively stable at around 6¼ per cent. In April, employment had been little changed, the participation rate had ticked down and the unemployment rate had increased slightly to 6.2 per cent. Forward-looking indicators suggested that employment growth would be only modest in the coming months and most measures of job advertisements and vacancies were little changed since mid to late 2014.

Wage growth had declined a little further in the March quarter and remained lower than suggested by the historical relationship between wage growth and the unemployment rate. The rise in the private sector component of the wage price index had been the lowest outcome for many years (with the exception of the September quarter 2009) and wage growth over the year to March was below its decade average in all industries. Wage growth in the public sector had also remained low, in part because of delayed negotiations over enterprise bargaining agreements. Members considered several possible explanations for the slow growth of wages, including a more flexible labour market, the relatively long period of gradually rising unemployment over recent years and below-average levels of inflation expectations generally.

Financial Markets

Financial markets continued to focus on the current negotiations between Greece and its official sector creditors and the likely timing of interest rate rises in the United States. A sharp rise in 10-year bond yields was the main development across the major financial markets over the past month.

Members noted that the global rise in sovereign bond yields had been led by longer-maturity German Bunds, with those yields rising by as much as 65 basis points after reaching a historic low in mid April. The rise in yields was viewed primarily as a correction from unduly low levels, rather than a reaction to economic developments, and the sell-off only returned yields to their still low levels of late last year.

Longer-term sovereign yields in most other developed countries, including Australia, also rose significantly, while increases in yields on emerging market sovereign debt were generally smaller. Following the release of the Australian Government Budget, the Australian Office of Financial Management announced updated financing requirements for 2015/16, with net issuance of Australian Government Securities expected to be around $40 billion and net debt peaking at around 18 per cent of GDP in 2016/17.

In relation to the continuing negotiations between Greece and its official sector creditors, members observed that sizeable differences remained regarding the most substantive issues, including pensions and labour market reforms. Greece had been able to meet its scheduled payments to the International Monetary Fund (IMF) in May, but Greek officials had cautioned that payments due to the IMF in June would be difficult to make without an agreement being reached with the official sector creditors. Members also noted that, consistent with reports of deposit outflows, Greek banks’ use of emergency liquidity assistance had increased further during April and May.

In the United States, expectations about the timing of the first increase in the federal funds rate had changed little over the past month, with market pricing suggesting it would happen around the end of 2015, even though comments from the Federal Reserve suggested that the first increase would occur a little sooner than that. The People’s Bank of China had moved to ease monetary policy further in May when it announced another reduction in both benchmark lending and deposit rates in response to low inflation and slower growth in economic activity.

Turning to foreign exchange markets, members noted that the US dollar had reversed its recent modest depreciation against most currencies, reaching its highest level against the yen since December 2002. The Chinese renminbi was little changed against the US dollar over the past month, although it had appreciated further on a trade-weighted basis and had been assessed by the IMF as being no longer undervalued. The Australian dollar had depreciated over May to be a little above its trough in early April on a trade-weighted basis.

Equity prices in the major markets had shown little net change since the previous meeting. The broad index for Chinese equities had increased by 2 per cent over the past month, although the index had been volatile. Members also noted the high-profile collapses in the prices of two Hong Kong-listed Chinese companies in mid May. Australian equity prices had underperformed the major markets over May.

Pass-through of the reduction in the Australian cash rate target in May to lending and deposit rates had varied across domestic financial institutions and products. At the same time, a number of banks were reported to have tightened conditions on new loans to property investors and imposed restrictions on the extent of interest rate discounts. Members noted that it would take some time for the full effects of such changes to be evident in the housing loan approvals and credit data.

Market pricing indicated that the cash rate target was expected to remain unchanged at the present meeting.

Considerations for Monetary Policy

Members noted that information becoming available over the past month had not led to any material change to the global outlook, which was for growth of Australia’s major trading partners to be around average over the period ahead. After somewhat weaker-than-expected economic conditions in China earlier in the year, the authorities had eased a range of policies and announced initiatives to support growth, and some of the recent data had been slightly more positive. The Federal Reserve was expected to begin the process of raising its policy interest rate later this year, but some other major central banks were continuing to ease policy. Commodity prices had been mixed over the month and little changed overall, and were significantly lower than a year earlier.

Domestically, the available data suggested that output growth had continued at a below-trend pace over the past year and would remain a little below trend in the period ahead before picking up to around trend in the latter part of 2016. The national accounts data for the March quarter were expected to show that the key forces operating on the economy were much as they had been for some time. After picking up late last year, growth of household expenditure was expected to have remained strong, supported by low interest rates and strong population growth. Conditions in the housing market in Sydney and parts of Melbourne had remained very strong, though trends were more mixed in other cities. Survey-based measures of business conditions had remained around average levels. There continued to be spare capacity in labour and product markets, although there had been some improvement in labour market conditions over the past six months or so. Inflationary pressures remained well contained and were likely to remain so in the period ahead.

The exchange rate was close to the lowest levels seen earlier in the year, but members noted that the current level of the exchange rate, particularly on a trade-weighted basis, continued to offer less assistance than would normally be expected in achieving balanced growth in the economy. A further depreciation therefore seemed both likely and necessary, particularly given the significant declines in commodity prices over the past year.

Overall, in assessing domestic conditions and the international environment, the Board’s assessment was that the stance of monetary policy should be accommodative. Having eased policy at the previous meeting, members judged that it was appropriate to leave the cash rate unchanged and to assess information on economic and financial conditions as it became available. These data would inform the Board’s assessment of the state of the economy and the outlook and hence whether the current stance of policy would most effectively foster sustainable growth and inflation consistent with the target.

The Decision

The Board decided to leave the cash rate unchanged at 2.0 per cent.
Monetary Policy Transmission

Christopher Kent, Assistant Governor (Economic), gave a speech in Canberra at the Australian National University entitled “Monetary Policy Transmission – What’s Known and What’s Changed“. In the speech he dissects the way in which changes to monetary policy flows on through the economy to households and firms.  Its a relevant discussion because the recent monetary easing has not so far translated into the desired outcomes in the current cycle. We think he is correct to assert that segmented analysis of households needs to be incorporated into the thinking, as based on our surveys we see that different household groups, are behaving in very different ways.

In responding to cyclical developments and inflation pressures, monetary policy has a significant influence on aggregate demand and inflation. The transmission of interest rates through the economy can be roughly described as follows. I’ll focus on an easing of monetary policy.

  1. The Reserve Bank lowers the overnight cash rate.
  2. Financial markets update expectations about the future path of cash rates and the structure of deposit and lending rates are quickly altered.
  3. Over time, households and firms respond to lower interest rates by increasing their demand for credit, reducing their saving and increasing their (current) demand for goods, services and assets (such as housing and equities).
  4. Other things equal, rising demand increases the prices of non-tradable goods and services. The price-setting behaviour of firms depends on demand conditions and the cost of inputs, including of labour. Higher aggregate demand leads to increased labour demand and a rise in wages.

The transmission mechanism depends crucially on how monetary policy affects households’ and firms’ expectations. Expectations about the future path of the cash rate will affect financial market prices and returns, asset prices and the expected prices of goods, services and factors of production (including labour). Expectations of more persistent changes in the cash rate will have larger effects.

The extent to which lower interest rates lead to extra demand will depend on how households and businesses alter their behaviour regarding borrowing and investing, as well as consuming and saving. These responses are often described as occurring via a number of different channels.

He concludes that monetary policy is clearly working to support demand, although it is working against some strong headwinds. These include the significant decline in mining investment, fiscal consolidation at state and federal levels and the exchange rate, which continues to offer less assistance than would normally be expected in achieving balanced growth in the economy. Model estimates that control for these and other forces provide tentative evidence that the monetary policy transmission mechanism, in aggregate, is about as effective as usual. However, it may be too early to pick up a statistically significant change using such models.

As usual, dwelling construction is growing strongly in response to low interest rates, and this is making some contribution to the growth of aggregate demand and employment. It may be that in parts of the country, any further substantial increases in residential construction activity might run up against some supply constraints, putting further upward pressure on housing prices. As the Bank has noted for some time now, large increases of housing prices, if accompanied by strong growth of credit and a relaxation of lending standards, are a potential risk for economic stability. Accordingly, the Bank is working with other regulators to assess and contain such risks that may arise from the housing market.

Consumption growth has picked up since 2013. But it is still a little weaker than suggested by historical experience. This may reflect a number of factors including some variation in the ways that the different channels of monetary policy are affecting households according to their stage in life. Some indebted households appear to be taking advantage of low interest rates to pay down their debts faster than has been the norm, perhaps in response to weaker prospects for income growth. Those relying on interest receipts may feel compelled to constrain their consumption in response to the relatively long period of very low interest rates. Meanwhile, the search for yield is no doubt playing a role in driving the strong growth of investor housing credit. This might provide some indirect support to aggregate demand, but this channel is not without risk.

In short, monetary policy is working. The transmission mechanism may have changed in some respects, and this could help to explain lower-than-expected growth of consumption and debt of late. But it is hard to be too definitive. To know more about this, it would be helpful to better understand the behaviours of different types of households using household-level data. To use a botanical analogy, to know more about a plant, it’s helpful to observe how its different types of cells work.

Aligning Growth Policy Levers

Glenn Stevens gave an address to the Economic Society of Australia in Brisbane where he discussed the need to align policy levers to drive growth and the limits of monetary policy.

The latest edition of the Australian National Accounts, released last week, shows the picture. The quarterly growth figure was stronger than what had been embodied in our forecasts in the May Statement on Monetary Policy, though that comes after a weaker-than-expected outcome in the previous quarter. Some of the strength resulted from unusually high export shipments of resources, which were less disrupted by weather conditions in the ‘cyclone season’ than has often been the case in the past. Indications are that this pace of growth wasn’t repeated in the June quarter, when shipments of coal in particular were affected by weather disruptions on the east coast.

Taking the results over the past four quarters, growth was ‘below trend’. Export volume growth contributed strongly, while domestic final demand increased by a bit under 1 per cent, which is quite a weak result. Housing construction rose strongly, and consumer spending over the year rose by more than real household income (that is, the saving rate fell). Both these results owe a good deal to low interest rates and rising asset values.

But other components of demand were weak. Business investment fell substantially, with mining investment falling quickly and, as best we can tell, non-mining capital spending also weak. Public final spending didn’t grow at all. Public investment spending fell by 8 per cent over the past year.

Overall, these outcomes are weaker that what, two years ago, we expected would be happening by now. Back then, the two-year-ahead forecast was for annual GDP growth to be in a range of 2½ to 4 per cent by mid 2015. The width of that range reflected the normal size of error margins, coupled with the inevitable uncertainty about the timing of when some components of demand outside of mining might strengthen, and the judgement that if accommodative monetary policy really was held in place for several years (which was a key assumption behind those forecasts), activity could at some point start to pick up quite quickly. It will be three months before we get the national accounts data for the June quarter, but at this point, with three of the four quarters available for the year to June 2015, it would appear that the outcome will be either right at the bottom of the range predicted two years ago or, more likely, a bit below it.

Of course, forecasts are hardly more than educated guesswork and two-year-ahead forecasts are even less reliable. That there are inevitably forecast errors is neither surprising nor new, and it is not any more concerning per se now than it always has been. This is far from the biggest forecast error I’ve seen over my three decades in this game.

But it is nonetheless useful to see what we can learn from those errors.

The following points are prominent:

  • The terms of trade, which two years ago were assumed to fall, have in fact fallen further – they are about 12 per cent lower than the assumed path. That means national income is lower, which means spending power is lower.
  • The exchange rate, which at that time was above parity against the US dollar, and was assumed to stay there, is now about 25 per cent lower. It has moved in the same direction as the terms of trade, which is normal.
  • The lower exchange rate has helped to produce a contribution to growth from ‘net exports’ much greater than earlier forecast, while that from domestic demand has been much weaker. The latter is mainly spread across non-mining business investment and weaker government spending, together with softer consumption on account of lower incomes. One thing which is not very different from the forecast from two years ago is that mining sector capital spending is falling sharply.
  • Because the net effect of the above factors is that GDP growth has been on the weaker side of expectations, the unemployment rate is about half a percentage point higher than forecast two years ago. Consistent with that, growth in wages is, as you would expect, lower than forecast.
  • Headline inflation is lower than forecast, largely because of the recent fall in oil prices. Underlying inflation is within the 2–3 per cent range that had been forecast. Again, the depreciation of the exchange rate has been a factor here.
  • The cash rate is 75 basis points lower than assumed two years ago, as monetary policy has used the room provided by contained inflation to try to do more to help growth. Lending rates have fallen on average by about 100 basis points over that period. This has produced a stronger result for housing construction than forecast and will also have contributed to the rise in dwelling prices.

In summary, the economy has in several important respects followed a different track from the one expected a couple of years ago. That is partly because conditions in the world economy were different from what had been expected and partly because several domestic factors were different.

Some in-built responses have been in evidence. For example the decline in the exchange rate, even if not by as much as we might have expected, has had the effect of supporting growth and keeping inflation from falling as much as it might have done. And, of course, monetary policy has also responded to the evolving situation, consistent with the Reserve Bank’s mandate. These responses have had the effect of lessening the extent to which growth and inflation have differed from the outcomes expected two years ago, but haven’t managed to eliminate those differences entirely, at least in the case of output growth.

The slowing in wage growth in response to soft labour market conditions has also undoubtedly helped to hold employment up. In fact wage growth appears to be somewhat lower than previous relationships between wages and unemployment would suggest. This may be a sign of increased price flexibility in the labour market and could help to explain why employment recently has looked a little higher relative to estimated GDP than might have been expected. These hypotheses can be advanced only tentatively, though, until we have more data.

Looking ahead, the most recent forecasts suggest that growth rates will be similar to those we have observed recently for a while yet. Residential investment will reach new highs over the period ahead. Household consumption is expected to record moderate growth. With national income growth reduced by a falling terms of trade, this requires a modest decline in the saving rate. It doesn’t seem reasonable to expect much more from consumption growth than that.

Resources sector investment has a good deal further to fall yet over the next two years. Other areas of investment seem very low and while I would have expected that by now these would have been showing signs of strengthening, the most recent indications are for, if anything, a weakening over the year ahead. Public final spending has not been growing and fiscal consolidation still has some way to run. Under the current macroeconomic conditions, it would seem inappropriate for governments to seek additional restraint here in the near term.

Inflation is likely to remain low. Growth in labour costs is very low and some of the forces that were pushing up certain administered prices have started to reverse. So even if the exchange rate were to fall further, which in my view it needs to, we seem unlikely to have a problem with excessive inflation.

Putting all that together, as things stand, the economy could do with some more demand growth over the next couple of years.

Of course, these are forecasts. They might be wrong. In fact, they will be wrong, in some dimension or other. Our published material goes to some lengths to articulate a range of ‘risks’. It is easy to think of ‘downside’ ones in the current mood of determined pessimism.

But it is not entirely impossible to think of upside ones as well. A further fall in the exchange rate, which is not assumed in the forecasts, would add both to growth and prices. If one thinks that such a decline at some point is likely, that constitutes an ‘upside’ risk. Of course, the list of countries that would prefer a lower exchange rate is a long one and we can’t all have it.

That being so, we might give some thought to trying to create some upside risks to the growth outlook through policy initiatives. The Reserve Bank will remain attuned to what it can do, consistent with the various elements of its mandate – including price stability, full employment and financial stability. We remain open to the possibility of further policy easing, if that is, on balance, beneficial for sustainable growth.

The temptation, of course, is to presume outcomes can be fine-tuned by policy settings and that we can simply dial up more or less demand in short order to avoid deviations from some ideal path. Reality is inevitably more messy than that and has not always been kind to such fine-tuning notions. As it is, some observers think monetary policy has done too little, while others think it already has done way too much. I think it has been about right for the circumstances.

But the bigger point is that monetary policy alone can’t deliver everything we need and expecting too much from it can lead, in time, to much bigger problems. Much of the effect of monetary policy comes through the spending, borrowing and saving decisions of households. There isn’t much cause from research, or from current data, to expect a direct impact on business investment. But of all the three broad sectors – households, government and corporations – it is households that probably have the least scope to expand their balance sheets to drive spending. That’s because they already did that a decade or more ago. Their debt burden, while being well serviced and with low arrears rates, is already high. It is for this reason that I have previously noted some reservations about how much monetary policy can be expected to do to boost growth with lower and lower interest rates. It is not that monetary policy is entirely powerless, but its marginal effect may be smaller, and the associated risks greater, the lower interest rates go from already very low levels. I think everyone can see that.

If I am correct about this, it really is very important that other policies coalesce around a narrative for growth. In this regard, I think the Government is on the right track in not seeking to compensate for lower revenue growth by cutting spending further in the short run. Of course, some resolution of long-run budget trends is still going to be needed to sustain confidence and that will not be an easy conversation.

Meanwhile, as often remarked, infrastructure spending has a role to play in sustaining growth and also in generating confidence. I am doubtful of our capacity to deploy this sort of spending as a short-term countercyclical device. The evidence of history is that it takes too long to start and then too long to stop. But it would be confidence-enhancing if there was an agreed story about a long-term pipeline of infrastructure projects, surrounded by appropriate governance on project selection, risk-sharing between public and private sectors at varying stages of production and ownership, and appropriate pricing for use of the finished product. The suppliers would feel it was worth their while to improve their offering if projects were not just one-offs. The financial sector would be attracted to the opportunities for financing and asset ownership. The real economy would benefit from the steady pipeline of construction work – as opposed to a boom and bust. It would also benefit from confidence about improved efficiency of logistics over time resulting from the better infrastructure. Amenity would be improved for millions of ordinary citizens in their daily lives. We could unleash large potential benefits that at present are not available because of congestion in our transportation networks.

The impediments to this outcome are not financial. The funding would be available, with long term interest rates the lowest we have ever seen or are likely to. (And it is perfectly sensible for some public debt to be used to fund infrastructure that will earn a return. That is not the same as borrowing to pay pensions or public servants.) The impediments are in our decision-making processes and, it seems, in our inability to find political agreement on how to proceed.

Physical infrastructure is, of course, only part of what we need. The confidence-enhancing narrative needs to extend to skills, education, technology, the ability and freedom to respond to incentives, the ability to adapt and the willingness to take on risk. It is in these areas too, where there are various initiatives in place or planned, but which often do not get enough attention, that we need to create a positive dynamic of confidence, innovation and investment.

That is the upside we need to create.

RBA Caused The Bubble – AFR

Strong piece from Chris Joye in the AFR today.

There’s only one party to blame for Australia’s unprecedented house price bubble. And it’s not buyers, vendors, developers, immigrants or local councils restricting new approvals. While they have all contributed to the underlying demand and supply dynamics, the unsustainable price growth across Sydney and Melbourne since January 2013 is squarely the responsibility of the monetary policy mandarins residing in the Reserve Bank of Australia’s Martin Place headquarters.

It is these folks who dismissed our repeated warnings that they were blowing the mother of all bubbles and instead decided that the cheapest mortgage rates in history—enabled by cutting the cash rate a full 100 basis points below its global financial crisis nadir – is the elixir required to maintain “trend” growth. Never mind that this might actually be bad, productivity-destroying growth based on distorted savings and investment decisions that will have to be reversed when the price of money normalises.

And let there be no doubt this bubble is without peer. The dollar value of our homes, mortgage debt and house prices measured relative to incomes, and the share of speculative investors purchasing properties, have never been higher. So as far as valuations and interest rates are concerned, we might as well be exploring the surface of the Sun.

Slashing the cash rate to 2 per cent in May – or about 50 basis points below Australia’s core inflation rate – in the name of centrally planning economic activity is having other deleterious consequences. Setting aside the adverse effects of the absurdly cheap 3.49 per cent fixed and 3.98 per cent variable loan rates now offered, we have banks like Macquarie claiming that the 1.9 per cent interest paid on its market-leading at-call deposit product is “healthy”. Every day I meet retail and institutional savers struggling to figure out how to earn a decent return without assuming unacceptable risks that could decimate their wealth. With the Australian sharemarket down more than 8 per cent from its April highs  and major bank stocks off more than 16 per cent, chasing dividend yields is patently not the answer for the defensive part of your portfolio.