Housing Construction Boom Wavers

The ABS published their preliminary construction work done data to September 2014. Overall the seasonally adjusted value of construction work done dropped 2.2 % to $51,146.4m in the September quarter and makes a 5.1% fall this year. Within the data, NT construction rose, helping to trim the damage, but the result was below market expectations.  Within the data. new private residential construction fell by 2.0 per cent in the September quarter but is still 9.7 per cent higher for the year. But the big question is, has construction begun to falter, or will growth continue – building approvals data could suggests it has some way to run, but it looks a little more shaky now. The RBA is banking on construction powering on of course to reach escape velocity as the mining investment boom fades.

The seasonally adjusted estimate of total building work done fell 1.0% to $22,435.8m in the September quarter. The trend estimate for engineering work done fell 3.0% in the September quarter.The seasonally adjusted estimate for engineering work done fell 3.2% to $28,710.6m in the September quarter.

The trend estimate for total construction work done fell 1.2% in the September quarter 2014 but the trend estimate for total building work done rose 1.5% in the September quarter. The trend estimate for non-residential building work done rose 0.9%, while residential building work rose 1.8%. The trend estimates are derived by applying a 7-term Henderson moving average to the seasonally adjusted series. The 7-term Henderson average (like all Henderson averages) is symmetric but, as the end of a time series is approached, asymmetric forms of the average are applied. Unlike weights of the standard 7-term Henderson moving average, the weights employed have been tailored to suit the particular characteristics of individual series. So looking at trend data we see new houses more static than other residential development, (units).

ConstSep2014tTrendFlowsByTypeThis is shown more starkly if we look at percentage distribution. Whilst conversions are relatively static, units and other non-house residential building is showing more momentum.

ConstSep2014tTrendFlowsByTypePCThe original state data shows that more new houses were built in VIC than NSW, with WA and QLD close together.

ConstSep2014HouseStatesPCTurning to other types of residential building, we see that around 70% are locate across NSW and VIC. We see a spike in ACT units in 2011, but this seems to be slowing now. In WA more houses than units are being built.

ConstSep2014OtherResiStatesPC

OECD Warns Again On Housing

The OECD Economic Outlook 2014 Issue 2 has been released in a preliminary version. There are some important warnings which the RBA should heed. Essentially, OECD is highlighting again the risks in the current RBA policy of using low interest rates to drive housing growth in lieu of mining investment. They appear to believe rates should be taken higher and additional prudential measures should be taken.

Output growth is projected to dip to 2.5% in 2015 but recover to 3% in 2016. Declining business investment will be countered by gathering momentum in consumption and exports. Growth at the projected pace will be enough to lower the unemployment rate, although consumer price inflation will remain moderate due to economic slack.

Fiscal policy should continue to aim for a budget surplus by the early 2020s but given economic uncertainties, it should avoid heavy front loading. Short of negative surprises, withdrawal of monetary stimulus should start in the second quarter of 2015. The booming housing market and mortgage lending will require close attention by the authorities. There is room for both fiscal and monetary policy to provide  support in the event of unexpected negative economic shocks.

The Australian economy is going through a period of adjustment as activity has to shift from the previously booming resource sector. Cooling commodity prices and declining resource-sector investment have resulted in job and output losses, but a lower exchange rate is lifting employment and exports elsewhere in the economy. House price increases are encouraging construction and consumption, but are also a concern in that a sharp reversal could cut aggregate domestic demand.

The Reserve Bank of Australia’s (RBA’s) policy rate has remained at 2.5% since August 2013, well below historical norms. Though helping economic adjustment, this monetary support has intensified search for returns by investors. This requires close oversight of asset-market developments, particularly rising housing credit, which is now being driven by investors. Further prudential measures on mortgage lending should be considered as a targetted means to cool the market, thereby heading off risks to financial stability.

OECDNov2014

External risks remain prominent, with recent steep falls in some commodity prices exemplifying the potential for rapit change in resource revenues. Domestically, the momentum in property prices is uncertain and could unwind sharply. When and how quickly non-0mining investment picks up is uncertain, as is the degree to which households will dip further into savings to sustain their consumption.

High LVR Lending More Risky – RBA

The RBA today published a paper on “Mortgage-related Financial Difficulties: Evidence from Australian Micro-level Data.”  Although default rates in Australia are lower than in many other countries,

RBAMortgageDefaultsCompare

their research paper delved into the different types of mortgage lending, using loan-level pool data provided by MARQ Services and concluded that higher LVR lending, and interest only loans were more risky than average.

RBAMortgageDefaults

Our loan-level analysis suggests that loans with high loan-to-valuation ratios (above 90 per cent) are more likely to enter arrears, while loans that are repaid relatively quickly are less likely to enter arrears. Together, these results reinforce the importance of supervisors carefully monitoring changes in lending standards that affect the loan-to-valuation ratio of loans at origination and rates of principal repayment thereafter. Although interest-only and fixed-rate loans appear less likely to enter arrears, the fact that these loans tend to be repaid relatively slowly (particularly interest-only loans) means that increases in these types of lending can represent an increase in risk. Additionally, low-doc loans appear more likely to enter arrears than other types of loans, even after controlling for whether the borrower was self-employed. This suggests that lenders should maintain sound income documentation and verification policies, and that supervisors should continue to monitor developments in the low-doc lending space.

Borrowers with relatively high mortgage interest rates have a higher probability of entering arrears, even after controlling for the estimated minimum mortgage repayment, which is consistent with riskier borrowers being charged higher interest rates to compensate for their higher risk. We caution, however, that the loan-level results are affected by data limitations, such as a lack of information on borrower income, wealth and labour force status, and a relatively small sample of banks.

Complementary analysis using household-level data suggests that having a high debt-servicing ratio (above 50 per cent) significantly increases the probability of missing a mortgage payment. This highlights the importance of borrowers not overextending themselves by taking out loans of a size that will be difficult to comfortably service. Additionally, it reinforces the importance of lenders maintaining sound debt-serviceability and income-verification policies.
Having previously missed a mortgage payment is also found to be a significant predictor of subsequently missing another mortgage payment. This highlights the heightened risk associated with lending to borrowers with a history of missing payments, and supports the practice of lenders using information on previous debt payment behaviour (such as credit scores) in their credit assessment processes.

Overall, our results reinforce the importance of supervisors carefully monitoring changes in lending standards, as well as the importance of borrowers exercising prudence when taking on mortgage debt.

This is a significant and important contribution to the current debate about how risky the mortgage loan portfolio are. It also chimes with DFA mortgage stress analysis. Today we highlighted the APRA data which showed that both high LVR loans and interest only loans made up a significant element in the current new business mix. This research paper adds further weight to the argument that capital rules needs to be changed to reflect the true risks of mortgage lending.

RBA And Housing – Again

Glenn Stevens in an address to the Committee for Economic Development of Australia (CEDA) Annual Dinner today included some further important comments on the housing sector. He was at pains to highlight what potential upcoming changes on lending standards would not be focussing on. Rather, it is an attempt “to stretch out the upswing.” In other words, the RBA still wants to use housing as part of the ongoing economic growth lever, despite high debt levels and high house prices.

As for domestic sources of demand, an obvious contributor is the set of forces at work in the housing sector. Investment in new and existing dwellings is rising. It ought to be possible, if we are being sensible both on the demand management side and the supply side, for this to go further yet and, more importantly, for the level of activity to stay high for longer than the average cyclical experience. A high level of construction, maintained for a longer period of time, is vastly preferable to a very sharp boom and bust cycle. That alternative outcome might give us a higher peak in the near term, but then a slump in the housing sector at a time when the fall in mining investment is still occurring. A sustained period of strong construction will be more helpful from the point of view of encouraging growth in non-mining activity – and also, surely, from a wider perspective: housing our growing population in an affordable manner.

Considerations such as these are among the reasons we ought to take an interest in developments in dwelling prices, the flow of credit towards housing purchases, and the prudence with which these funds are advanced. It is perhaps opportune to offer a few observations on this topic.

Having fallen in late 2010 and 2011, dwelling prices have since risen, with the median price across the country up by around $100 000 – about 18 per cent – since the low point. Prices have risen in all capitals, with a fair degree of variation: the smallest increase has been in Canberra, at about 6 per cent, and the largest in Sydney, at 28 per cent.

Credit outstanding to households in total is rising at about 6–7 per cent per year. I see no particular concern with that. When we turn to the rate of growth of credit to investors in particular, we see that it has picked up to about 10 per cent per annum over the past six months, with investors accounting for almost half of the flow of new credit.

It is not clear whether this acceleration will continue or abate. It is not clear whether price increases will continue or abate. Furthermore, it is not to be assumed that investor activity is problematic, per se. A proportion of the investor transactions are financing additions to the stock of dwellings, which is helpful. It can also be observed that a bit more of the ‘animal spirits’ evident in the housing market would be welcome in some other sectors of the economy.

Nor, let me be clear, have we seen these dynamics, thus far, as an immediate threat to financial stability. The Bank’s most recent Financial Stability Review made that clear.

So we don’t just assume that all this is a terrible problem. By the same token, after all we have seen around the world over the past decade, it is surely imprudent not to question the comfortable assumption that it is all entirely benign. A situation where:

  • prices have already risen considerably in the two largest cities (where about a third of our population live)
  • prices are rising, at present, faster than income by a noticeable margin, and
  • an important area of credit growth has picked up to double-digit rates

should prompt a reasonable observer to ask the question whether some people might be starting to get just a little overexcited. Such an observer might want to satisfy themselves that lending standards are being maintained. And they might contemplate whether some suitably calibrated and focused action to help ensure sound standards, and that might lean into the price dynamic, may be appropriate. That is the background to the much publicised comment that the Bank was working with other agencies to see what more could be done on lending standards.

Let’s be clear what this is not about. It is not an attempt to restrain construction activity. On the contrary, it is an attempt to stretch out the upswing. Nor is it a return to widespread attempts to restrict lending via direct controls. That era, that some of us remember all too well, was one in which the price of credit was simply too low and credit growth too high all round. We don’t have that problem at present. That growth of credit to many borrowers remains moderate suggests that the overall price of credit is not too low. In fact the level of interest rates, although very low, is well warranted on macroeconomic grounds. The economy has spare capacity. Inflation is well under control and is likely to remain so over the next couple of years. In such circumstances, monetary policy should be accommodative and, on present indications, is likely to be that way for some time yet. But for accommodative monetary policy to support the economy most effectively overall, it’s helpful if pockets of potential over-exuberance don’t get too carried away.

Turning from housing investment to investment more generally, a more robust picture for capital spending outside mining would be part of a further strengthening of growth over time. Some of the key ingredients for this are in place. To date, there are some promising signs of stronger intentions, but not so much in the way of convincing evidence of actual commitment yet. That’s often the way it is at this point of the cycle. Firms wait for more evidence of stronger demand, but part of the stronger demand will come from them.

With respect to consumer demand, I should complete the picture by showing an updated version of the relevant chart from last time. In brief, not much has changed. The ratio of debt to income remains close to where it has been for some time. It’s rising a little at present because income growth is a bit below trend. Household consumption growth has picked up to a moderate pace and has actually run ahead of income over the past two years. Given that household wealth has risen strongly over that period, and interest rates are low, a modest decline in the saving rate is perhaps not surprising and indeed we think it could decline a little further in the period ahead. As I’ve argued in the past, however, we shouldn’t expect consumption to grow consistently and significantly faster than incomes like it did in the 1990s and early 2000s, given that the debt load is already substantial.

sp-gov-181114-graph6

RBA’s Outlook for Australia’s Economy

In a speech today, Christopher Kent, Assistant Governor (Economic) outlined the current state of global and local economies, and commented on the outlook.  Significantly he stressed that the RBA was looking for household expenditure to trickle through to stimulate business investment and thus lead to a lift in the labour market. However, noting the fall in average real income, and waning consumer confidence, we think this will take a long time, even at current very low interest rates. In addition, we have very high loan to income ratios, and this is absorbing household wealth significantly. Raises an interesting point, are the underlying economic assumptions valid this time around?

Our expectation is that growth will continue to be a bit below trend for a time, picking up gradually to be a bit above trend pace by 2016. And the unemployment rate is likely to remain elevated for some time.

The near-term weakness reflects a combination of three forces: a sharper decline in mining investment over the coming quarters than seen to date; the effects of the still high level of the exchange rate; and ongoing fiscal consolidation at state and federal levels. In contrast, resource exports are likely to make a further strong contribution to growth, with LNG exports expected to begin ramping up over coming quarters. At the same time, very low interest rates are working to support growth of household expenditure. In time, growth of household demand and the impetus to domestic demand provided by the exchange rate depreciation we have seen since early 2013 are expected to spur non-mining business investment.

Given this outlook, I want to touch on two relevant aspects of the business cycle that are important sources of uncertainty for our forecasts. One is related to household consumption, the other to business investment.

Household consumption

At this phase in the business cycle, it’s natural to worry about the possibility that consumption will be weighed down by slow growth in household incomes, driven in turn by the subdued state of the labour market. It is true that stronger growth of employment and wages would provide more support for consumption. However, that dynamic usually kicks in later in the cycle. In the meantime, it’s reasonable to expect that very low rates of interest will enable and encourage households to shift some expenditure from the future to now, including via higher asset prices. This would see a decline in the share of disposable income that households save (i.e. a lower saving ratio). There are limits to this, and it would be unwise to build a recovery on a foundation of a sharp decline in the saving ratio.

Our latest forecasts, however, suggest that there will be a gradual decline in the saving ratio over the next couple of years, of the same order of magnitude as we’ve already seen over the past couple of years.

A decline in the household saving ratio would be consistent with the tendency for labour market developments to lag developments in economic activity, including consumption, by a few quarters. Consumption and GDP growth tend to pick up ahead of an improvement in employment growth, which would in turn be expected to occur before we see wage growth start to return to more normal levels. This was the case during the recessionary episodes of the early 1990s and following the global financial crisis.

sp-ag-131114-graph8

Non-mining business investment

I’ve spoken at length recently about the factors that might have led to subdued non-mining business investment over recent years.

In short, I concluded that this outcome had been consistent with a period of greater uncertainty and below-average confidence. Both of these have changed for the better more recently, yet firms still seem reluctant to take on risks associated with substantial new investment projects. If the appetite of businesses (and shareholders) for risk were to improve, investment could pick up. It’s hard to know when such a turning point in spirits might take place. But it is more likely when the fundamental determinants of investment are in place as they seem to be now. The ready availability of internal and external finance, at very low cost, is one such element of that. Also, there is the stronger growth of demand across the non-mining parts of the economy over the past year or so and measures of capacity utilisation have increased to around long-run average levels. So there is a reasonable prospect of business investment picking up, in time.

Even so, let me note some reasons why the anticipated recovery in non-mining business investment might not be quite as strong as in earlier episodes. But I will stress at the outset that if that comes to pass, it does not mean that growth of activity or of our prosperity need suffer.

One reason why investment in the non-mining sector might be lower than in the past is that service industries account for an increasing share of our economy – rising by about 12 percentage points in terms of the employment share over the past three decades. This is relevant to investment because service industries, on average, have much lower levels of capital relative to labour. So, in an economy in which services account for a higher share of economic activity, other things equal, the optimal (non-mining) capital stock should be lower  than it otherwise would be (as a share of that economy). However, that doesn’t imply that GDP growth will be lower, nor does it suggest that the economy will be a less prosperous one. What matters for these things is whether we are taking advantage of profitable opportunities and using labour and capital in the most productive ways that we can. Also, it is worth emphasising that many services require high levels of human capital – in the form of education and training – which does not get picked up in investment as measured by the national accounts.

sp-ag-131114-graph9

Investment today might also be lower (as a share of nominal GDP) than in the past for another reason. Over time there has been a sizeable decline in the price of many types of machinery and equipment (particularly those related to information and communications). So, businesses are able to spend less to obtain a given level of capital services. For example, they can purchase a lot more computing power for a given level of nominal spending. Once again, if this leads to lower investment (as a share of nominal GDP) than in the past it does not imply less output growth or lower prosperity. Indeed, given that Australia imports much of our machinery and equipment, a lower price of that capital is to our benefit.

Conclusions

The major advanced economies are in different stages of the business cycle. The recovery from recession is well established in the United States, but has a long way to go in the euro area. Japan has made some progress in reducing the extent of spare productive capacity, but inflation is still some way from the Bank of Japan’s target. Nevertheless, growth of Australia’s major trading partners has actually been around average for some time now and, as best we can tell, it is likely to remain at that rate in the year ahead.

Australian GDP growth has been a bit below trend pace over the past couple of years, consistent with a gradual rise in the unemployment rate. Much of the growth this past year owed to rising resource exports, although growth outside the mining sector also picked up. However, with mining investment set to fall more sharply over coming quarters, GDP growth is expected to be below trend for a time before gradually picking up to an above-trend pace by 2016.

The very low level of interest rates is supporting, and will continue to support, growth of household expenditure. In time, this is expected to support a recovery in non-mining business investment, and the economy more broadly, including an improvement in conditions in the labour market. If history is any guide, the recovery is likely to proceed in that order, from household expenditure to business investment to labour market conditions. History also suggests that a pick-up in business investment (outside of the resources sector) will come, in time. The fundamental forces are in place to support that recovery. And while I have suggested some reasons why business investment might not be quite as strong as past episodes of recovery might suggest, these don’t imply that the economy overall will be less strong than otherwise, but rather just one element of expenditure that we measure via the national accounts.

Australian Securitisation Under The Microscope

Today, in a speech by Chris Aylmer, Head of Domestic Markets Department, RBA, we got an interesting summary of recent developments in the market. This is important, because as at June, the Bank held about $25 billion of these assets under repo as part of their liquidity management operations. In addition, at the same forum, Charles Litterell, EGM APRA discussed the planned reforms to prudential framework for securitisation, highlighting that APRA want to facilitate a much larger, but very simple and safe, funding-only market and also facilitate a capital-relief securitisation market. In both cases, they want to impose a simpler and safer prudential framework than has evolved internationally. The RBA comments are worth reading:

While conditions in global financial markets have improved since the depths of the global financial crisis, the market for asset-backed securities has notably lagged this improvement. Issuance of private-label asset-backed securities in the US is currently equivalent to around 1½ per cent of GDP, compared with an average of around 8 per cent in the first half of the 2000s (Graph 1). Issuance of private-label residential mortgage-backed securities (RMBS) has been virtually non-existent since 2008. In contrast, issuance of auto loan-backed securities is nearing its pre-crisis level. Issuance of securities backed by student-loans and credit card receivables is also growing, though it remains well below its pre-crisis peak.

sp-so-111114-graph1Activity in the European securitisation market remains very subdued, with annual issuance placed with investors relative to the size of the economy declining for the fourth year in a row. While the challenging economic conditions on the continent have contributed to this, European authorities have identified a number of other impediments and are developing proposals to address them.[2] In September the European Central Bank (ECB) announced that it will implement an asset-backed securities purchase program aimed at expanding the ECB’s balance sheet. While this program is not explicitly targeted at reviving the European ABS market, the ECB expects the programme to stimulate ABS issuance.

In comparison with its overseas counterparts, the Australian securitisation market, which remains predominantly an RMBS market, has experienced a strong recovery over the past couple of years, albeit not to pre global financial crisis levels. Issuance started to pick up in late 2012, reached a post-crisis high in 2013, and has remained high since then.

This mainly reflects the strong performance of Australian residential mortgages and the high quality of the collateral pools which are primarily fully documented prime mortgages. While delinquency rates on Australian prime residential mortgages increased after 2007, this increase was a lot less severe than in most other developed economies (Graph 2). Indeed, serious delinquencies in Australia, those of 90 days or longer, remained below 1 per cent and have declined since 2011 to around 0.5 per cent currently. Mortgage prepayment rates, which affect the timing of the payments to the RMBS notes, have also been relatively stable in Australia, resulting in subdued prepayment and extension risk for RMBS investors.

sp-so-111114-graph2Issuance margins on RMBS continued to tighten throughout this year across all categories of issuers (Graph 3). Banks have been able to place their latest AAA-rated tranches in the market at weighted average spreads of 80 basis points – the lowest level since late 2007. Spreads on the AAA-rated tranches of non-bank issued RMBS have also declined, to around 100 basis points. Investor demand has extended across the range of tranches, with a significant pick-up reported in demand for mezzanine notes. As a result, a number of issuers have priced their mezzanine notes at some of the tightest spreads since 2007.

sp-so-111114-graph3Similar to last year, RMBS issuance this year has mainly originated from the major banks (Graph 4). Indeed, issuance by the major banks is on par with their issuance prior to the global financial crisis. Issuance by other banks has also been robust this year, although it is still well below pre-crisis levels when these issuers accounted for around 40 per cent of the market.

sp-so-111114-graph4Mortgage originators have been active this year, although their issuance has predominantly been of prime RMBS. Mortgage originators have issued only $1.6 billion of non-conforming RMBS in 5 transactions so far this year. The number of mortgage originators active in the market in the past two years has increased relative to the period from 2009 to 2012.

They are an important presence in the market. In the period preceding the global financial crisis, mortgage originators took advantage of innovations in the packaging and pricing of risk. In doing so, they were able to undercut bank mortgage rates. The banks responded and spreads on mortgages declined markedly. While a number of large mortgage originators have exited the market, the presence of mortgage originators promotes competition in the mortgage market.

Issuance of asset-backed securities other than RMBS has generally been in line this year with previous years. Issuance of commercial mortgage-backed securities (CMBS) and other ABS this year has been around $5 billion, compared with an average of about $6 billion over the three preceding years.

The investor base in Australian ABS has continued to evolve (Graph 5). The stock of RMBS held by non-residents has been relatively steady since late 2010 suggesting that non-residents have been net buyers of Australian ABS. The strong performance of Australian RMBS and lack of issuance elsewhere may have been an important driver behind the participation of foreign investors. There has been a pick-up in RMBS holdings by Authorised deposit-taking institutions (ADIs) – they now hold just under 40 per cent of marketed ABS outstanding – with the major banks accounting for much of the increase.

sp-so-111114-graph5Holdings of ABS by real money domestic investors have gradually declined, to the point where these investors, in aggregate, now hold less than a quarter of what they held four years ago. The longer-term sustainability of the Australian securitisation market may well depend on increasing participation in the market by domestic real money investors.

One of the key structuring developments since mid 2007 has been the increase in credit subordination provided to the senior AAA-rated notes. This primarily reflects decreased reliance by the major banks on lenders mortgage insurance (LMI) support in their RMBS. This trend has been driven by investor preference for detaching the AAA-rating on the senior notes from the ratings of the LMI provider.

The increased subordination in the major banks’ RMBS has been to a level in excess of that required to achieve a AAA-rating without LMI support. This mitigates the downgrade risk owing to changes in ratings criteria. In contrast, other categories of RMBS issuers have continued to use LMI to support their structures, allowing them to achieve AAA-ratings on a larger share of their deals.

The RBA highlighted that “the risk management and valuation of ABS collateral is obviously an analytically intensive process, requiring considerable information about the security and the underlying assets. Over time we will further develop pricing and margins that reflect the specifics of the asset-backed security and its collateral pool. This could, for example, take the form of credit risk models of the collateral pool which take into account characteristics such as geographic concentrations, delinquencies and loan-to-value ratios. These collateral credit models will be combined with structural security models to calibrate margins specific to the security that reflect its projected behaviour under stress scenarios”.

Why Mortgage Loans Are Growing Slower Than House Prices

The RBA, in today’s monetary statement discusses the relationship between loan growth and house prices. They conclude that factors including fear of unemployment, low supply, high loan to income ratios and stamp duty are all contributing factors, as well as price hikes themselves.

Indicators of conditions in the established housing market, such as housing prices, housing turnover and new borrowing, are interrelated and often move together quite closely (Graph A1). However, in recent years, housing turnover and loan approvals have risen by less than housing prices when compared with previous cycles in the housing market.

RBAA1

Turnover and loan approvals are closely linked. Each new housing loan represents a new transaction in the housing market (as long as it is not used to refinance an existing property or construct a new dwelling). Hence, the value of new borrowing will grow at about the same rate as the value of turnover as long as the average loan-to-valuation ratio does not change too much. In Australia, it turns out that the relationship between new borrowing and turnover has been quite stable for the past decade or so (Graph A2).

RBAA2

Housing prices and turnover might move together over time for a number of reasons, although the relationship may not be quite as tight as that between turnover and loan approvals (and it is possible for prices to rise with only limited turnover). One strand of research has found that an increase in housing prices causes an increase in turnover because higher housing prices increase the net wealth of homeowners. This allows those owners who did not previously have a large enough deposit to trade up to a more expensive dwelling, thereby increasing turnover. A complementary strand of research has found that the causality can also run in the other direction, from turnover to housing prices.

It suggests that some vendors might discern a rise in housing demand by observing a rise in turnover, thereby encouraging them to raise their reserve prices.

Turnover and housing price growth have moved together over time, although the relationship appears to have weakened somewhat in recent years. The change is most evident in Sydney and Melbourne, where growth in housing prices has been strongest of late (Graph A3). The rate of turnover has remained low in those cities, both in terms of their longer-term averages and relative to growth in housing prices.

RBAA3

It is difficult to know why the turnover rate has remained relatively low compared with its history and compared with prices. There is tentative evidence to suggest that existing homeowners have become more reluctant to borrow against increases in their net wealth to trade up homes. For example, the survey of Household Income and Labour Dynamics in Australia (HILDA) suggests that in 2011 and 2012 (the two most recent survey years) a smaller share of households bought larger homes than in any of the previous nine survey years. Also, there has been unusually low participation of owner-occupiers in housing market transactions recently (Graph A4). The reasons are not clear, although it partly reflects the fact that state government incentives for first home buyers have been redirected away from established dwellings towards new dwellings.

RBAA4

One possibility is that a reluctance to trade up homes reflects households generally becoming less willing to take on additional debt in recent years. Following the increase in leverage over the 1990s and early 2000s, the debt-to-income ratio has been stable at high levels. Although interest rates are currently low, the expected repayment burden on loans is at 10-year average levels, when calculated using a longer term interest rate to account for the expectation that variable interest rates will move up over time. Indeed, in New South Wales and Victoria, which have experienced the greatest disparity between housing prices and turnover relative to historical norms, the share of current income required to service an average loan over the next 10 years is close to historical highs.

Another consideration is that homeowners may be less willing to borrow more because growth in labour income has slowed. Nominal labour income has grown at an average annual rate of 2.7 per cent over the past two years, compared with a decade average of 6.2 per cent. And the widespread expectation is that wage growth will remain subdued for a time. Moreover, the Westpac-Melbourne Institute survey suggests that the share of households expecting more unemployment a year ahead has been at above-average levels since late 2011, which is an unusually long time by the historical standards of the survey.

Repayment obligations, in combination with uncertainty about future labour income, are an important consideration for homeowners. According to liaison with banks, one consequence of this environment is that an increasing share of owner occupiers is opting for interest-only loans to increase repayment flexibility.

A reluctance to trade up homes might also stem from increases in effective stamp duty rates. In some states, including New South Wales and Victoria, the nominal housing price thresholds at which higher rates of stamp duty apply have not changed for a number of years. As housing prices have risen, more buyers have fallen into the higher stamp duty brackets, acting as a disincentive to purchase housing. In New South Wales, for instance, the stamp duty paid on a median-priced home has grown to around 25 per cent of annual disposable income per household, from close to 10 per cent in 1991.

Finally, the relationship between turnover and housing prices can be affected by developments in housing supply. Additions to the housing stock have been relatively low in some states over recent years, which would weigh on the rate of turnover as it is currently measured, while low supply relative to demand would also put upward pressure on prices.


RBA Leaves Rate On Hold Once More

At its meeting today, the Board decided to leave the cash rate unchanged at 2.5 per cent.

Growth in the global economy is continuing at a moderate pace. China’s growth has generally been in line with policymakers’ objectives, though weakening property markets there present a challenge in the near term. Commodity prices in historical terms remain high, but some of those important to Australia have declined further in recent months.

Volatility in some financial markets has picked up over the past couple of months. Overall, however, financial conditions remain very accommodative. Long-term interest rates and risk spreads remain very low. Markets still appear to be attaching a low probability to any rise in global interest rates or other adverse event over the period ahead.

In Australia, most data are consistent with moderate growth in the economy. Resources sector investment spending is starting to decline significantly, while some other areas of private demand are seeing expansion, at varying rates. Public spending is scheduled to be subdued. Overall, the Bank still expects growth to be a little below trend for the next several quarters.

Recent data on prices confirmed that inflation is running between 2 and 3 per cent, as expected, and this is likely to continue. Although some forward indicators of employment have been firming this year, the labour market has a degree of spare capacity and it will probably be some time yet before unemployment declines consistently. Hence, growth in wages is expected to remain relatively modest over the period ahead, which should keep inflation consistent with the target even with lower levels of the exchange rate.

Monetary policy remains accommodative. Interest rates are very low and have continued to edge lower over the past year or so as competition to lend has increased. Investors continue to look for higher returns in response to low rates on safe instruments. Credit growth is moderate overall, but with a further pick-up in recent months in lending to investors in housing assets. Dwelling prices have continued to rise.

The exchange rate has traded at lower levels recently, in large part reflecting the strengthening US dollar. But the Australian dollar remains above most estimates of its fundamental value, particularly given the further declines in key commodity prices in recent months. It is offering less assistance than would normally be expected in achieving balanced growth in the economy.

Looking ahead, continued accommodative monetary policy should provide support to demand and help growth to strengthen over time. Inflation is expected to be consistent with the 2–3 per cent target over the next two years.

In the Board’s judgement, monetary policy is appropriately configured to foster sustainable growth in demand and inflation outcomes consistent with the target. On present indications, the most prudent course is likely to be a period of stability in interest rates.

Total Housing Lending Now Worth $1.4 Trillion

The RBA financial aggregates, released today, highlight the continued growth in housing lending. The overall summary is shown below:

RBA-Aggregates-Sept-2014

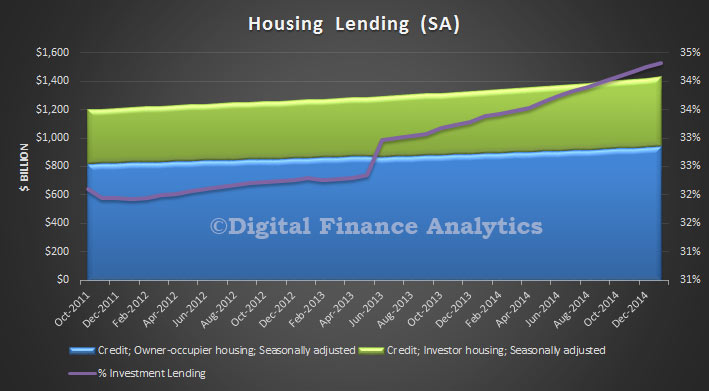
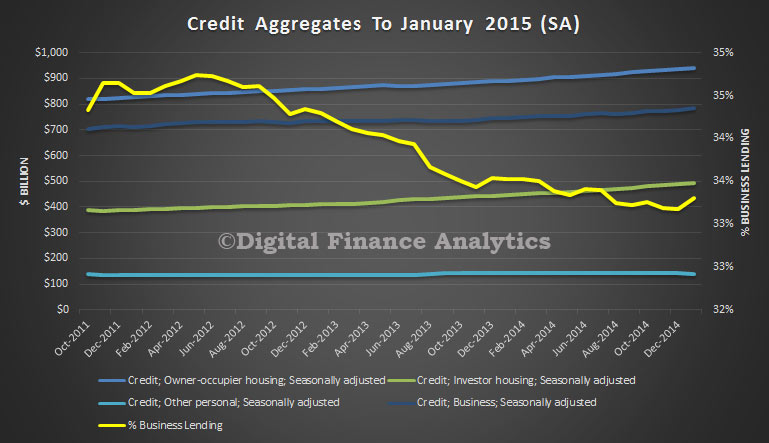
Looking in detail at the housing numbers, owner occupied lending reached $923.1 billion (up 0.46% from the previous month, or $4.2 billion), whereas investment lending reached $475.1 billion (up 0.85% or $4.0 billion). Investment loans now comprise 33.98% of total housing lending, another record. This underscores RBA’s concerns as we highlighted before.

HousingLendingSep2014Total housing lending is now $1.398 trillion, of which, according to APRA $1.288 trillion is from the ADI’s, the balance of $110 billion is from the non-bank sector, and recorded no change (though there are some data issues here).

House Prices Match Income Growth – RBA

Luci Ellis, Head of Financial Stability Department spoke to the Australian Housing and Urban Research Institute (AHURI) Panel Roundtable. You can hear her remarks, and a transcript is promised later. My notes follow.

  • Cross country comparisons on housing markets are important, but sometimes comparisons need to be used with care, e.g. specific issues like overbuilding in USA and Ireland had significant impacts. There are differences which need to be understood. Canada is a better comparator for Australia, with a similar geographic footprint but they do have some differences such as fixed rate mortgages, and the government takes tail risk as mortgage insurer.
  • There is much more data post GFC on housing related issues, BIS, IMF, etc. proved richer data. The latest data has changed the perspectives, but many conversations have not caught up yet. For example, housing prices corrected for inflation, shows Australia is not one of the “boomier” countries and prices have not materially grown faster than household incomes. There is evidence of risk in the system as shown by the house prices fall (in Sydney and nationally) if you look back over the past 15 years. Overall housing prices have tracked income.
  • Financial liberation has been one of the drivers to lift house prices relative to income, alongside credit constraints and high inflation. Inflation is lower now, though credit constraints still exist, for example, ratio of serviceability, is an important indicator. As inflation falls, loan to income ratios can be higher.
  • This change in the loan size does has important macroeconomic implications. But mortgage repayments are lower now, thanks to low interest rates. Household savings ratio turned up 2005, before the crisis.
  • Housing crashes do not improve affordability. Need to focus on where real unaffordability lives, e.g. renters who cannot afford to buy.
  • There are risks attached to overbuilding as seen overseas. Supply in Australia is increasing and it is needed, and intended as part of handover from mining investment boom. Building approvals are around 200,000 a year – bit higher than in the past thanks to more high density properties and strong population growth. But we need to understand the composition of the population growth. For example look at migration by visa type – student numbers picked up in the last two years. Students want to live in apartments in inner areas near universities. That’s where lots of the new building is in for example Sydney. There is a premium to be closer in, and it has increased in recent times.
  • There are implications for policy makers from local planning issues. Dublin example, building needs to be in the right areas. We do not build new towns in Australia, maybe we should have a long term plan for new Cities.
  • There is little speculative building in Australia (compared with other countries). Instead demand is from small investors, and future demand is more linked to expected house price growth.
  • Getting the right balance between supply of property and finance is important.

Some observations. First, average income and house prices mask the differences, many household segments in our analysis are worst today. Second, household savings ratios are being buttressed by inflated housing, and appear to be falling and they so vary by segment. Third, we see incomes in real terms falling, so what does that say for future house prices growth? We feel that RBA’s story is therefore over optimistic, despite some interesting points. What if interest rates do rise?