RBA Reinforces Current Policy Settings

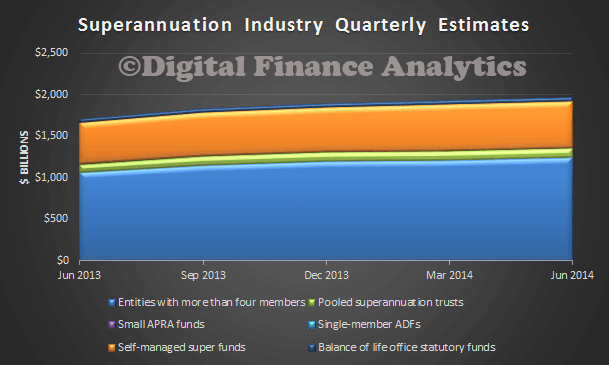
The RBA has made a supplementary submission to the Financial System Inquiry. Of note, they want to limit the extent to which SMSF’s can borrow, especially for property purchase; acknowledges the potential systemic risk from more housing lending, and the potential impact on business lending; and continues to be skeptical about the potential benefits of macroprudential tools. A couple of contextual charts may help – $1.85 billion in superannuation, 30% in SMSF, and the property sector is worth $5.2 trillion, with borrowing of $1.375 trillion, and a greater proportion for investment purposes, with a rise in interest only loans.

SuperJune2014InvestmentLendingSplitValueJune2014SUPERANNUATION

Assets should be managed in the best interests of members. Measures to lower costs and fees, optimise liquidity management and limit leverage should be considered”. The Bank endorses the observation that leverage by superannuation funds may increase vulnerabilities in the financial system and supports the consideration of limiting leverage. The general absence of leverage in superannuation was a key source of resilience in the Australian financial system during the financial crisis. Furthermore, the compulsory and essential character of retirement savings implies that it should remain largely unlevered. While still in its infancy, the use of leverage by superannuation funds to enhance returns appears to have been mainly taken up by self-managed superannuation funds (SMSFs). The Bank has previously commented on the risks that may arise from geared property investment through SMSFs, which may act as an additional source of demand that exacerbates property price cycles. Nonetheless, some limited leverage for liquidity management purposes may be appropriate.

HOUSING MARKET

The Interim Report finds little evidence of a shortage of mortgage finance in Australia, a view that the Bank shares. Even so, the Interim Report raises a number of options in the context of competition in the mortgage market that, if implemented, could result in relatively more finance being directed towards housing. These options should be assessed in terms of the end benefits and risks for consumers and the broader economy. Relevant considerations include whether the policy change might accelerate household borrowing, and the associated implications for systemic risk and the available funding for Australian businesses. As noted in the Bank’s initial submission, housing is generally not a particularly risky asset, but because of its size, importance to the real economy and interconnectedness with the financial system it poses systemic risk. With regards to Capital Requirements, the Interim Report highlighted several options for aiding competition through Australia’s capital framework, including changes to mortgage risk weights and providing capital inducements for ADIs that use Lenders’ Mortgage Insurance. Because of the cyclical nature of risk-taking and the large social and economic costs of instability in financial systems, it is crucial that institutions’ capital be allocated according to risk. Hence, changes to the capital framework on competitive grounds should not come at the expense of greater risk, and should not amount to a weakening relative to global regulatory minima.

MACROPRUDENTIAL

The Bank concurs with the Interim Report’s caution regarding unproven macroprudential tools. The Bank and the other CFR agencies view macroprudential policy as being subsumed within the broader financial stability policy framework in Australia. The Interim Report notes the existing framework where APRA, in consultation with the Bank and other CFR agencies, is responsible for administering prudential regulation. Consistent with its existing mandate to promote financial stability, APRA has adapted its prudential intensity in light of developments in systemic risk. For example, following signs of increased risk appetite in the mortgage market, APRA recently surveyed mortgage underwriting standards, released guidance on managing mortgage risk, and asked the major banks to specify how they are monitoring lending standards and the ensuing risks to the economy. Tools like loan-to-valuation ratio and debt-servicing ratio limits on mortgages have only recently begun to be used in developed countries. It is still too early to judge their effectiveness with the available evidence so far mixed; the effects of particular initiatives are not easily disentangled from those of other policy settings, including changes in monetary policy. APRA already has the powers to implement these tools if it was decided they would be beneficial. The Bank is not attracted to arrangements whereby prudential policy setting is spread across multiple agencies or groups of agencies. Australian agencies will continue to closely monitor how these tools perform overseas.

Where Capital Growth In Property Lives

In the Opening Statement to House of Representatives Standing Committee on Economics today, Glenn Stevens made the following points:

  • not only are funding costs low, but banks want to lend and are competing to do so more actively than they have for some years;
  • net worth per household has risen by about $120,000 over the past two years;
  • the community’s monetary assets have risen by around 13 per cent – over $180 billion – over the same period;

It is worth reflecting on the fact the main reason for the increase in net worth is a bounce in the stock market, and lift in capital values of property, thanks to rising prices. After all real income is falling for many. In addition, the average hides the differences.

We have been looking at capital growth for the average household, across the states, and between the main urban centres and the rest of rest of the state. From our surveys we have been able to assess the relative growth in the value of property, over time, by marking property to market and comparing that with its purchase price. The chart below shows the relative growth in net capital value of property since 2004 (where our surveys start). It subtracts the original purchase price from the current value, to give a theoretical capital or wealth value. It shows that in the early 2000’s there was a similar level of growth in the cities and regional centres, but that more recently it has diverged. In the past 2 years, the average capital appreciation in the urban centres was $79,000, whereas in the regional centres, it was just $18,000.

AverageCapitalGrowthAllHowever there are significant variations across the states. In Sydney, households in the past 2 years, have on average enjoyed a lift in net worth of more than $230,000 thanks to price hikes, whereas Brisbane, Adelaide, and regional areas in SA and TAS have not experienced much of an increase at all.

AverageCapitalGrowth2YearsLooking at the longer term trends, across states, the situation gets even more interesting. Of course people have bought in at different times, but we can plot the overall capital growth trend. For example, In NSW, a household who bought in Sydney in 2004 and held the property would on average be nearly $300,000 better off now. If they had bought in early 2012, though they could have nearly earnt the same gain! All the action has been in the last couple of years, in Sydney itself. There have been a more gentle lift in regional NSW. Note that I have not corrected for inflation in any of the current calculations, if I did, the regional centres in NSW would have stood still.

AverageCapitalGrowthNSWIn VIC, the situation is somewhat similar. It is worth noting that compared to NSW, the correction in 2009 was less severe.

AverageCapitalGrowthVICTurning to QLD, there has been no capital growth in either Brisbane, or the regional centres since 2010. If you were to correct for inflation, it would be going backwards.

AverageCapitalGrowthQLDIn WA, growth peaked in 2010 in Perth, with a further small peak recently, whilst in the regional centres, values are falling in real terms, before inflation. We compared Perth and Sydney recently, in more detail.

AverageCapitalGrowthWALooking at SA, growth in Adelaide is back to 2011 levels, but in the regional areas, growth is still lower than in 2010.

AverageCapitalGrowthSAIn TAS, since a peak in 2010, both Hobart and regional centres are flat, before inflation.

AverageCapitalGrowthTASFinally, we look at the remaining states. Growth in Darwin has been sustained, whilst regional NT and Canberra are flatter since 2011.

AverageCapitalGrowthOtherSo, my conclusion is simple, some households especially in Sydney and Melbourne, may be experiencing the wealth effect halo of smugness, but many households across other states and regional centres are not enjoying capital growth. Indeed, for many there has been a reduction in true value, before inflation since 2011. It is unlikely therefore that we will see a sudden surge of consumer spending activity in response to the housing boom (which is not uniform across the country as we have shown). It is really a Sydney and Melbourne boom. The RBA may be waiting for a long time if they are expecting households to start spending big.


RBA Leaves Rates On Hold – Again

At its meeting today, the Board decided to leave the cash rate unchanged at 2.5 per cent.

Monetary policy remains accommodative. Interest rates are very low and for some borrowers have continued to edge lower over recent months. Savers continue to look for higher returns in response to low rates on safe instruments. Credit growth has picked up a little, including most recently to businesses. The increase in dwelling prices has been slower this year than last year, though prices continue to rise. The exchange rate remains high by historical standards, particularly given the declines in key commodity prices, and hence is offering less assistance than it might in achieving balanced growth in the economy.

Looking ahead, continued accommodative monetary policy should provide support to demand and help growth to strengthen over time. Inflation is expected to be consistent with the 2–3 per cent target over the next two years.

In the Board’s judgement, monetary policy is appropriately configured to foster sustainable growth in demand and inflation outcomes consistent with the target. On present indications, the most prudent course is likely to be a period of stability in interest rates.

Bloomberg’s Summary Of The Australian Housing Market.

Bloomberg Australia has published a compelling overview of the housing market in Australia. They underscore the relatively myopic stance of the regulators. DFA was cited in the article.

Australia has the third-most overvalued housing market on a price-to-income basis, after Belgium and Canada, according to the International Monetary Fund. The average home price in the nation’s eight major cities rose 16 percent as of June 30 from a May 2012 trough, the RP Data-Rismark Home Value Index showed.

In Sydney, the most populous city, where price growth has been strongest, values soared 15 percent over the past 12 months. That compares with a 5.4 percent increase in New York City in April from a year earlier and a 26 percent jump in London prices in June quarter from a year ago.

“There’s definitely room for caps on lending,” said Martin North, Sydney-based principal at researcher Digital Finance Analytics. “Global house price indices are all showing Australia is close to the top, and the RBA has been too myopic in adjusting to what’s been going on in the housing market.”

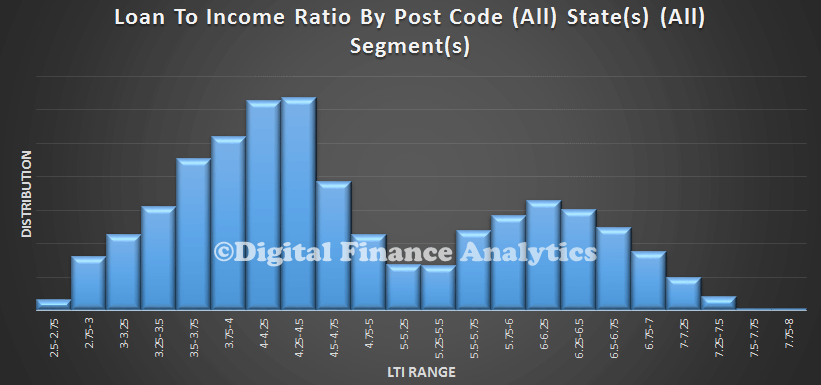
Worth recalling the chart we published recently on Loan to Income By Post Code.

LTIAllStates

RBA Leaves Cash Rate Unchanged; Again.

At its meeting today, the Board decided to leave the cash rate unchanged at 2.5 per cent. “Monetary policy remains accommodative. Interest rates are very low and for some borrowers have edged lower over recent months. Savers continue to look for higher returns in response to low rates on safe instruments. Credit growth has picked up a little, including most recently to businesses. Dwelling prices have increased significantly over the past year, though there have been some signs of a moderation in the pace of increase recently. The exchange rate remains high by historical standards, particularly given the declines in key commodity prices, and hence is offering less assistance than it might in achieving balanced growth in the economy. Looking ahead, continued accommodative monetary policy should provide support to demand and help growth to strengthen over time. Inflation is expected to be consistent with the 2–3 per cent target over the next two years”.

“A strong expansion in housing construction is now under way. At the same time, resources sector investment spending is starting to decline significantly.”

RBA Holds Rates Again At 2.5%

The RBA have kept rates on hold today, and are indicating a period of rate stability.

“Monetary policy remains accommodative. Interest rates are very low and for some borrowers have edged lower over recent months. Savers continue to look for higher returns in response to low rates on safe instruments. Credit growth has picked up a little. Dwelling prices have increased significantly over the past year, though there have been some signs of a moderation in the pace of increase recently. The earlier decline in the exchange rate is assisting in achieving balanced growth in the economy, but less so than previously as a result of the higher levels over the past few months. The exchange rate remains high by historical standards, particularly given the further decline in commodity prices.

Looking ahead, continued accommodative monetary policy should provide support to demand, and help growth to strengthen over time. Inflation is expected to be consistent with the 2–3 per cent target over the next two years.

In the Board’s judgement, monetary policy is appropriately configured to foster sustainable growth in demand and inflation outcomes consistent with the target. On present indications, the most prudent course is likely to be a period of stability in interest rates.”