RBNZ Official Cash Rate unchanged at 1.75 percent

The Reserve Bank today left the Official Cash Rate (OCR) unchanged at 1.75 percent.

The outlook for global growth continues to gradually improve.  While global inflation remains subdued, there are some signs of emerging pressures. Commodity prices have continued to increase and agricultural prices are picking up.  Equity markets have been strong, although volatility has increased.  Monetary policy remains easy in the advanced economies but is gradually becoming less stimulatory.

GDP was weaker than expected in the fourth quarter, mainly due to weather effects on agricultural production. Growth is expected to strengthen, supported by accommodative monetary policy, a high terms of trade, government spending and population growth. Labour market conditions are projected to tighten further.

Residential construction continues to be hindered by capacity constraints. The Kiwibuild programme is expected to contribute to residential investment growth from 2019. House price inflation remains moderate with restrained credit growth and weak house sales.

CPI inflation is expected to weaken further in the near term due to softness in food and energy prices and adjustments to government charges. Tradables inflation is projected to remain subdued through the forecast period. Non-tradables inflation is moderate but is expected to increase in line with a rise in capacity pressure.  Over the medium term, CPI inflation is forecast to trend upwards towards the midpoint of the target range. Longer-term inflation expectations are well anchored at 2 percent.

Monetary policy will remain accommodative for a considerable period.  Numerous uncertainties remain and policy may need to adjust accordingly.


Bank Funding And The Cash Rate

A really interesting, if technical paper from the Reserve Bank New Zealand, Analytical Note Series “Funding cost pass-though to mortgage rates“.  It shows the weaker linkage now between the official cash rate and mortgage rates, compared with before the GFC. It also shows that variable rates are more susceptible to lags in rates compared with fixed rates, and that fixed rates are were the competition is stronger.

These results emphasise the role of wider funding costs, not just monetary policy, for how banks set their mortgage rates. This is particularly the case for fixed-rate mortgages, given increased variability in funding costs and the composition of bank funding. It also shows how competition, and margin preservation are in play within the banks.  We suspect the same in true in Australia.

Prior to the global financial crisis (GFC), there was a relatively stable relationship between the Official Cash Rate (OCR) and retail mortgage rates. Changes in the OCR were typically accompanied by a proportional change in floating mortgage rates. However, this relationship has deteriorated since the GFC and the OCR on its own has not been a good proxy for bank funding costs. This paper examines the change in the transmission of the OCR, and the role of other funding costs for retail mortgage rates since the GFC.

Banks now place greater reliance on more stable (but more costly) sources of funding. They rely on domestic deposits and long-term wholesale funding more, and less on short-term wholesale funding. This has resulted in a wider and more volatile spread between mortgage rates and the OCR. Not all changes in the OCR have passed through one-for-one into floating mortgage rates, as funding costs from other sources have sometimes been offsetting.

We construct a comprehensive estimate of bank funding costs using a weighted average of the cost of domestic deposits, short-term wholesale funding and long-term wholesale funding. This weighted-average measure is further decomposed into a monetary policy rate component and a funding spread component. We use an error correction framework to measure the relative contributions of the policy rate and funding spreads to the level of mortgage rates in New Zealand, and estimate the speed of pass-through to mortgage rates from changes in funding costs.

Our results suggest that funding spreads have been larger post-GFC, and have had a larger impact on the level of fixed-rate mortgages than on floating rates. There has also been a significant slowdown in the pass-through from policy and funding spreads to the floating mortgage rate.

The speed of pass-through to fixed-rate mortgages has slowed only slightly.

Note: The Analytical Note series encompasses a range of types of background papers prepared by Reserve Bank staff. Unless otherwise stated, views expressed are those of the authors, and do not necessarily represent the views of the Reserve Bank.

Auckland’s Construction Shortfall Analysed

A new discussion paper has been published on the Reserve Bank New Zealand’s website: Residential construction and population growth in New Zealand: 1996-2016. It highlights the supply shortfall at approximately 10 percent of Auckland’s housing stock. But not until apartment construction almost completely ceased in 2008 did Auckland’s housing shortage started to become acute.

This paper aims to understand how population growth has affected building activity in New Zealand regions during the last twenty years. Using panel data regression techniques, we estimate that 0.25 – 0.30 additional houses are built for every additional person in a region. The additional 0.25 – 0.30 building permits per person equate to about 40 m2 of new construction, with a value of just over $60,000 in 2016 terms. This construction is in addition to the ‘background’ construction that occurs to replace old houses, which amounts to 2.5 – 3.0 dwellings per 1,000 people per year, or approximately 11,000 – 13,000 dwellings per year.

The estimates suggest Auckland’s construction shortfall between 1996 and 2016 was between 40,000 and 55,000 dwellings, or approximately 10 percent of Auckland’s housing stock. The estimates of the shortfall are fairly robust to changes in the specification of the models; moreover, they all suggest that the shortfall was modest until the end of 2005, when it increased rapidly.

We also examine the relationship between the size of newly constructed dwellings and population change. Since four of the sixteen New Zealand regions experienced almost no population growth over the period, it is possible to contrast the size of newly constructed houses in regions experiencing population change with those that did not. These estimates suggest that, at least until 2005, smaller houses were constructed in growing regions with above-average incomes, particularly Auckland and Wellington, than in growing regions with below average incomes or in regions with no population growth. This difference appears to reflect the much younger age profile of the residents of Auckland and Wellington. It appears that Auckland’s housing shortfall was less severe prior to 2005 precisely because of the large number of small apartments that were constructed in the city. Not until apartment construction almost completely ceased in 2008 did Auckland’s housing shortage started to become acute.

Finally, we analyse the relationship between population growth rates and the number of ‘residential’ construction workers. Our estimates suggest that a 1 percent increase in population growth rates is associated with a 0.4 – 0.5 percentage point increase in the fraction of the workforce in the construction sector. Since regions with zero population growth have 4.5 – 5 percent of their workers involved in residential construction, each percentage increase in the population growth rate increases the number of residential construction workers by approximately 10 percent. This does not include additional workers in related industries such as building materials. Auckland is again an outlier. For most of the period Auckland had approximately 9000 fewer construction workers than could be expected from trends around the rest of the country. Clearly, if this shortfall continues it will be difficult for Auckland to overcome its housing shortage.


RBNZ Holds Official Cash Rate

The New Zealand Reserve Bank has left the Official Cash Rate (OCR) unchanged at 1.75 percent and released their February 2018 Monetary Policy Statement.

Global economic growth continues to improve.  While global inflation remains subdued, there are some signs of emerging pressures.  Commodity prices have increased, although agricultural prices are relatively soft.  International bond yields have increased since November but remain relatively low.  Equity markets have been strong, although volatility has increased recently.  Monetary policy remains easy in the advanced economies but is gradually becoming less stimulatory.

The exchange rate has firmed since the November Statement, due in large part to a weak US dollar. We assume the trade weighted exchange rate will ease over the projection period.

GDP growth eased over the second half of 2017 but is expected to strengthen, driven by accommodative monetary policy, a high terms of trade, government spending and population growth.

Labour market conditions continue to tighten. Compared to the November Statement, the growth profile is weaker in the near term but stronger in the medium term.

The Bank has revised its November estimates of the impact of government policies on economic activity based on Treasury’s HYEFU.  The net impact of these policies has been revised down in the near term. The Kiwibuild programme contributes to residential investment growth from 2019.

House price inflation has increased somewhat over the past few months but housing credit growth continues to moderate.

The Bank says ” Bank funding costs eased slightly in the second half of 2017. Consistent with the decline in funding costs and a fall in the two-year swap rate, the average two-year mortgage rate has declined by around 15 basis points since June 2017. In contrast, most other mortgage rates have remained relatively stable. Mortgage rates are higher than a year ago across all terms, but remain low relative to history”.

Annual CPI inflation in December was lower than expected at 1.6 percent, due to weakness in manufactured goods prices.

While oil and food prices have recently increased, traded goods inflation is projected to remain subdued through the forecast period. Non-tradable inflation is moderate but expected to increase in line with increasing capacity pressures.  Overall, CPI inflation is forecast to trend upwards towards the midpoint of the target range. Longer-term inflation expectations are well anchored at 2 percent.

Monetary policy will remain accommodative for a considerable period.  Numerous uncertainties remain and policy may need to adjust accordingly.

RBNZ Consults On Revised Capital Adequacy Changes

The Reserve Bank NZ, has issued a Consultation Paper: Review of the Capital Adequacy Framework for locally incorporated banks: calculation of risk weighted assets.

This is the third consultation document of the review. The first document provided an overview of the review. The second document considered the definition of capital, which is the numerator in the minimum regulatory capital ratio. This document is concerned with the denominator in the minimum capital ratio, which is effectively a measure of exposure to risk.

They highlight further issues with the internal calculation method, as well as recent changes from the Basel Committee.

There is international and New Zealand evidence that minimum capital requirements went down significantly after banks were permitted to use their internal models for parts of the capital calculation. There is also international evidence that internal model outcomes are inconsistent. Different banks often come up with similar rankings of risk but the absolute levels of risk are substantially different even for the same obligors. The evidence is clearest in the case for exposures to governments, banks, and large corporations, but there is also some evidence of problems in other portfolios such as residential mortgages and SME lending.

The Basel Committee had proposed to replace the IRB approach with the standardised approach for bank and large corporate exposures, and with a standardised or semi-standardised approach for all specialised lending to corporates. The finalised framework did not go this far – it continues to allow a more limited form of IRB modelling, the Foundation IRB (F-IRB) approach, for bank and large corporate exposures. The new framework does, as originally proposed, constrain the outputs of internal models and impose an overall floor – based on the risk assessed under the standardised approach – on the average risk weight, to prevent it from straying too far from a common level.

Specifically, there are currently significant differences between the two approaches. Banks with internal models have a significant capital advantage.

They table options for both internal and standard approaches, as below.


Will APRA Loosen Lending Standards Next Year?

Interesting economic summary from Moody’s. They recognise the problem with household finances, and low income growth. They also suggest, mirroring the Reserve Bank NZ, that macroprudential policy might be loosened a little next year.

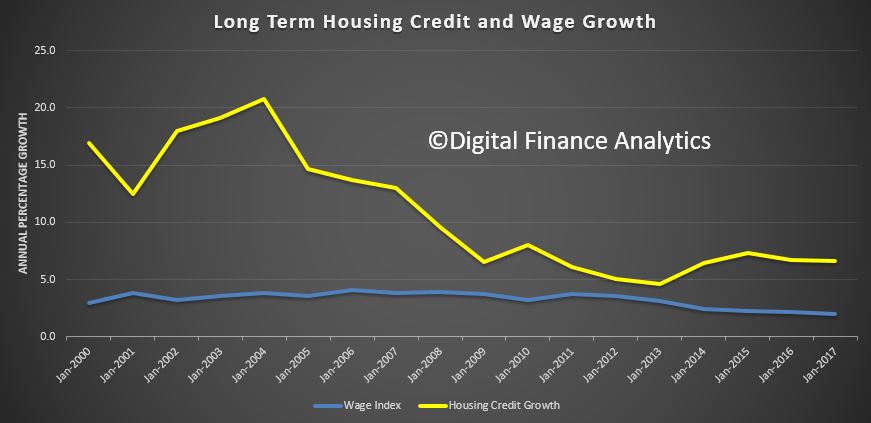
I have to say, given credit for housing is still running at three times income growth, and at very high debt levels, we are not convinced! I find it weird that there is a fixation among many on home price movements, yet the concentration and level of household debt (and the implications for the economy should rates rise), plays second fiddle.

Also, the NZ measures were significantly tighter, and the recent loosening only slight (and in the face of significant political measures introduced to tame the housing market). So we think lending controls should be tighter still in 2018.

It’s strange examining third quarter data when the fourth stanza has almost passed, but the Australian Bureau of Statistics isn’t known for timely national accounts data. Australia is the last major Asia-Pacific economy to release quarterly GDP numbers. Despite the tardiness, the national accounts gives valuable insight, especially on the investment front in the absence of a reliable monthly gauge.

Australia’s GDP growth hit 0.6% q/q in the September quarter following an upwardly revised 0.9% (previously reported as 0.8%) gain in the June stanza. Annual growth accelerated to 2.8% from the prior 1.8% gain. The annual growth figure is now hovering at potential, which we estimate is around 3%. However, momentum is overstated, given low base effects. In the September quarter of 2016, the Australian economy contracted by 0.5% q/q, only the fourth quarterly contraction in 25 years. This was driven by a sharp fall in investment alongside higher imports. During this period, annual growth slowed by 1.3 percentage point to 1.8%.

Private investment booms

Private investment was a bright spot in the third quarter because of a sharp rise in non-dwelling construction, which made the largest contribution to GDP growth at 0.9 percentage point.

Non-dwelling construction has often become a proxy for mining investment, and the third quarter gain is likely due to the installation of two liquefied natural gas platforms in Western Australia and the Northern Territory. LNG exports are expected to pick up late in the fourth quarter amid increased production capacity. The Wheatstone project began production earlier in October after a two-year construction phrase and
shipped its first export to Japan late in the month. Wheatstone is the sixth of eight projects included in a A$200 billion LNG construction boom that is now in its final stretch. Once the remaining two projects are finalized, Australia could topple Qatar as the world’s biggest LNG exporter. Australia has recently become the world’s second largest exporter of LNG.

Public investment didn’t score as well in the third quarter, declining by 7.5% q/q. This is mainly payback after a boost in the June quarter from the acquisition of the Royal Adelaide Hospital from the private sector.

The housing market has cooled in 2017, and price growth is expected to keep decelerating through 2018; this will keep downward pressure on dwelling investment. For instance, dwelling price growth in Sydney was 5% y/y in November, well down from its double-digit growth in 2016 and earlier in 2017.

This is the result of the lagged impact of earlier macroprudential action that has included higher borrowing costs for homebuyers, especially investors or those taking out interest-only loans. The Australian Prudential Regulation Authority has also imposed limits on bank portfolio exposure to new mortgages.

Owner-occupied housing finance commitments tend to track house price growth and are a good gauge of the underlying pulse. Data released this week show October commitments rose just 0.3% m/m on a trend basis. Growth has slowed substantially from earlier in 2017.

An interesting tidbit we have observed in recent years: Housing regulation in New Zealand tends to lead Australia’s by at least a year. The Reserve Bank of New Zealand was on the front foot trying to cool certain heated housing pockets such as Auckland well before the Australian Prudential Regulation
Authority introduced housing-targeted measures, even though both economies were experiencing strong price growth in some areas. Just recently, the RBNZ announced it had eased some macroprudential measures in light of softer house price growth. Now that Australia’s housing market has cooled, APRA may follow suit with minor reversals in the next year.

Households missing in action

At first glance it was a relief that consumption made a positive contribution to GDP growth, but the details were less pleasing, as spending was concentrated on essential items while discretionary purchases suffered. We calculated that nondiscretionary items rose an average 0.6% over the quarter, and discretionary spending fell by 0.7%.

Of the nondiscretionary items, utility spending rose 1.4% q/q, food was up 1%, rent gained 0.6%, and insurance and financial services grew 1.3%. On the discretionary front, clothing spending fell 1% q/q, recreation and culture was down 0.6%, and spending at cafes and restaurants fell by 0.9%.

All told, softness in the consumer sector was largely masked by spending on nondiscretionary items. The monthly retail trade data do not capture nondiscretionary spending as thoroughly as the national accounts; over the third quarter retail volumes were up just 0.1% q/q.

We know from earlier testing that consumer sentiment does not have a causal relationship with retail spending, but incomes do. Sentiment is a symptom of weak income growth, rather than a forward indicator of spending behaviour. The Westpac consumer sentiment index fell to 99.7 in November, below the neutral 100 that indicates optimists equal pessimists. Overall, consumers have been downbeat through most of 2017, concerned about family finances and the economic outlook. At 2% y/y, income growth is hovering near a record low, so it’s little surprise households have pulled
back on discretionary purchases, while other costs such as utilities rose in the third quarter because of seasonal price hikes. The net household saving ratio rose to 3.2% in the third quarter, higher than the decade low of 3% in the June quarter, suggesting that consumers aren’t willing to keep dipping into their savings to fund discretionary purchases. It’s concerning that household consumption is weak, given that it constitutes 75% of GDP.

Businesses are faring better than consumers at the moment. This is reflected in soaring private investment, lofty gains in company profits, and strong employment growth, particularly full-time, through 2017. Unfortunately, this has not yet flowed through to stronger income growth, and there are likely several factors at play. The first is cyclical: Low productivity is mooted as a reason for benign wages in the developed world. More Australia-specific is that underemployment has been very high in
Australia and the correlation with income growth is around -0.88. Underemployment has started to edge lower as full-time positions outpace part-time, and our baseline scenario is for the tighter labour market to yield stronger income growth by mid-2018. Although Australia’s Phillips curve has flattened in the past decade, there is still a reasonable relationship between unemployment and income growth.

Some structural factors: The rise of the gig economy has contributed to the rise in casual employment. These positions are more flexible and more easily adapt to changing demand, but there’s no union representation, which can hurt wage bargaining. Also, as the positions are more flexible, there’s more acceptance that lower wages can be a consequence.

Another structural reason for low incomes could be the higher prevalence of offshoring roles. There’s no reliable industry- or economy-wide data measuring the extent of offshoring, but we know that it is an unrelenting phenomenon, given the disparity in operating costs between Australia and the developed world. Employers are not locally replacing jobs lost offshore, so they are not potentially driving up labour costs to secure the appropriate candidate.

All told, these structural factors suggest that national income growth is unlikely to enjoy a significant rebound but rather gradual and modest improvement in 2018.

How’s the fourth quarter tracking?

Our high-frequency GDP tracker suggests a 2.7% y/y expansion in the December quarter following the barrage of October activity data this week. Retail trade came in at a strong 0.5% m/m, although this was payback for sustained weakness through the third quarter, when retail turnover fell an average 0.3% m/m.

October foreign trade data weren’t inspiring, as merchandise exports fell by 2% m/m amid lower iron ore prices and, to a lesser extent, volumes. The iron ore spot price increased by 22% from its late-October slump to US$71.51 per metric tonne in early December. We expect this will enable iron ore export receipts to improve heading into 2018 as higher global prices are incorporated into contracts; usually the lag is short. It’s too early to determine whether volumes will be adversely affected by higher prices.

We maintain our view that monetary tightening is firmly off the table for at least another year as the central bank sits on the sidelines waiting for consumption to show meaningful signs of a pickup. Our expectation is that the Australian dollar will depreciate around an additional 3% against the U.S. dollar over the next six months, serving to encourage more  consumption onshore and lift export competitiveness and helping core inflation return to and creep through the central bank’s 2% to 3%
target range.

Reserve Bank NZ to ease LVR restrictions

The Reserve Bank NZ has announced a slight reduction in tight loan to value lending controls, in response to the slowing housing sector and Government policy.  The loan-to-value ratio (LVR) policy was first introduced in October 2013, with progressively tighter restrictions for investors introduced in November 2015 and October 2016.

New Zealand’s financial system remains sound and risks to the system have reduced over the past six months, Reserve Bank Governor Grant Spencer said today when releasing the Bank’s November Financial Stability Report.

“Momentum in the global economy has continued to build over the past six months, reducing near-term risks to financial stability. However, the New Zealand financial system remains exposed to international risks related to elevated asset prices and high levels of debt in a number of countries.

“Domestically, LVR policies have been in place since 2013 to address financial stability risks arising from rapid house price inflation and increasing household debt. These policies have helped improve banking system resilience by substantially reducing the share of high-LVR loans. Over the past six months, pressures in the housing market have continued to moderate due to the tightening of LVR restrictions in October 2016, a more general firming of bank lending standards and an increase in mortgage interest rates in early 2017.

If there was a major housing market correction or economic downturn, then this reduction in the share of lending at high LVRs is likely to mean that fewer housing loans would default, and overall bank losses would be lower. One way of quantifying this is to use data from recent stress tests to estimate how the change in banks’ portfolios would affect default and loss rates for a given downturn scenario. Based on the 2017 stress test scenario we estimate that banks would experience around 10 percent lower default rates and around 20 percent lower credit loss rates than they would have if LVR restrictions had not been applied .

In the media conference the bank said $54bn of new OO were written over the past year, but there is no data on the number of additional applications which may flow now. They expect some increase in new loans at higher LVR’s but as the banks use their own buffers the bank is not expecting a large rise, but it could benefit first time buyers. They called this an incremental change, and they will continue to review the LVR restrictions – there is no schedule to move to no restrictions.  This is also a reaction to Government policies which will cool the market. They expect property investors to remain on the “back foot”, with lower future price gains now observed.

“Housing market policies announced by the Government are also expected to have a dampening effect on the housing market.

“In light of these developments, the Reserve Bank is undertaking a modest easing of the LVR restrictions. From 1 January 2018, the LVR restrictions will require that:

  • No more than 15 percent (currently 10 percent) of each bank’s new mortgage lending to owner occupiers can be at LVRs of more than 80 percent.
  • No more than 5 percent of each bank’s new mortgage lending to residential property investors can be at LVRs of more than 65 percent (currently 60 percent).

“The Bank will monitor the impact of these changes and will only make further LVR adjustments if financial stability risks remain contained. A cautious approach will reduce the risk of resurgence in the housing market or deterioration in lending standards.

Deputy Governor Geoff Bascand said “Looking at the financial system more broadly, the banking system maintains adequate buffers over minimum capital requirements and appears to be performing its financial intermediation role efficiently. The recovery in dairy commodity prices since mid-2016 has supported farm profitability and has helped to reduce bank non-performing loans in the sector. Recent stress tests suggest that banks are well positioned to withstand a severe economic downturn and operational risk events.

“The Bank has released two consultation papers on the review of bank capital requirements and a third paper on the measurement and aggregation of bank risk will be released shortly. The aim of the capital review is to ensure a very high level of confidence in the solvency of the banking system while minimising complexity and compliance costs.

“The Bank has also completed a review of the bank directors’ attestation regime and is making good progress in implementing a new dashboard approach to quarterly bank disclosures. This is expected to go live next May,” Mr Bascand said.

RBNZ Backs Supply Not DTI To Address Housing Risks

The Reserve Bank New Zeland has today published the Response to submissions on the Consultation Paper: Serviceability Restrictions as a Potential Macroprudential Tool in New Zealand.

Given the current slowdown in the housing market, the Reserve Bank considers a serviceability restriction would not be appropriate at present, but could still have a role to play in the future. In particular, the Reserve Bank does not believe DTI restrictions should be deployed in the current housing market environment and considers that the key longer term solution to housing market imbalances is to facilitate growth in housing supply in areas that need it.

In the meantime, they will continue to work with banks to improve the data being received on DTIs. The Reserve Bank is aware that system issues mean data from some banks includes overstated DTI ratios for some customers, and would like this to be gradually improved. The Reserve Bank may also provide further guidance around technical areas such as treatment of guarantees.

This is significant because many of the responses were from lenders who also operate in Australia, so we get a read on their arguments, ahead of the expected APRA paper on mortgage risk.  Good DTI data is a problem, but one which could and should be sorted.

This is interesting also, given the broader use of DTI in other jurisdictions (such as the UK) and the view expressed by IMF that DTI should be the macroprudential tool of choice.

Falling back to supply side issues squibs the core demand issues, in our view.

The NZ Reserve Bank received 25 submissions. A majority of submissions that expressed a clear view were against serviceability restrictions being added to the Reserve Bank’s toolkit. On the other hand, there were supportive submissions, and some submissions which went further and suggested serviceability instruments such as a debt-to-income ratio (DTI) restriction should be immediately deployed (not just added to the macroprudential toolkit set out in the MoU as the Reserve Bank had proposed).

Many submissions stated that loan-to-value ratio (LVR) restrictions are currently having a significant effect on the housing market and mortgage lending. Others said with mortgage rates rising recently and the housing market softening, DTI restrictions are not needed now.

Submitters expressed a range of views on whether house prices are currently overvalued. Some submissions stated that supply is the best way to correct imbalances and that LVR or serviceability restrictions cannot permanently solve housing market imbalances.

A number of submissions noted that banks’ own serviceability policies have tightened recently. Some noted that New Zealand consumer law (Credit Contracts and Consumer Finance Act 2003 (CCFA) and the related Responsible Lending Code (RLC)) requires lenders to undertake serviceability assessments. Some banks with Australian parents submitted that they are subject to the Australian Prudential Regulation Authority’s (APRA) prudential practice guide on residential mortgage lending, APG 223.2 Both the RLC and APG 223 require lenders to take the risk of rising interest rates into account when deciding if lending will be affordable.

Most of these points were consistent with the Reserve Bank’s views in the consultation paper. In particular, the Reserve Bank does not believe DTI restrictions should be deployed in the current housing market environment, and considers that the key longer term solution to housing market imbalances is to facilitate growth in housing supply in areas that need it.

We also acknowledged in the consultation paper that banks already undertake serviceability assessments and allow for the risk of rising interest rates. However, the Reserve Bank remains of the view that individual bank lending decisions may fail to take account of their impact on systemic risk during periods of intense competition for mortgage loans, and that there can be a role for limits on banks’ serviceability practices during these periods.

RBNZ Looks At Crypto-currencies

The Reserve Bank in New Zealand has released an excellent Analytical Note on Crypto-currencies “Crypto-currencies – An introduction to not-so-funny moneys“. It is one of the best I have read, so far!

The paper introduces the distributed ledger technology of crypto-currencies. They aim to increase public understanding of these technologies, highlight some of the risks involved in using crypto-currencies, and discuss some of the potential implications of these technologies for consumers, financial systems, monetary policy and financial regulation.

Crypto-currencies have no physical existence, but are best thought of as electronic accounting systems that keep track of people’s transactions and hence remaining purchasing power. Cryptocurrencies are typically decentralised, with no central authority responsible for maintaining the ledger and no central authority responsible for maintaining the code used to implement the ledger system, unlike the ledgers maintained by commercial banks for example. As crypto-currencies are denominated in their own unit of account, they are like foreign currencies relative to traditional fiat currencies, such as dollars and pounds.

They conclude that Crypto-currencies offer some distinct features, such as quicker cross-border transactions, possibly lower transaction fees, pseudo-anonymity, and transaction irreversibility. These features help to explain the growing demand for crypto-currencies, even though they fail to satisfy many of the basic functions of money.

Most crypto-currency accounts lie dormant and many of the active accounts are used only for online gambling or speculative purposes. Perceptions of anonymity have also created a demand for such currencies to facilitate illegal transactions, but the anonymity embodied in crypto-currencies has been over-stated. There have been a significant number of crypto-currency prosecutions in relation to money laundering and other crimes, illustrating that there is no guarantee of anonymity.

While crypto-currencies are growing in popularity, they currently facilitate a very small proportion of transactions. Because crypto-currencies intermediate such a small proportion of transactions, central banks do not presently view crypto-currencies as a material threat.Since crypto-currencies are not well-adapted to the provision of borrowing and lending, we also foresee an enduring role for traditional financial intermediaries.

Crypto-currencies and blockchain technology could well become an important part of global payment systems, but wide-scale adoption will depend on competition from alternative transaction technologies, and on regulation to provide users with security. Crypto-currencies will also need to address technical, scalability issues if they wish to intermediate the volume of transactions undertaken globally.

We conclude that all crypto-currencies are experimental in nature and users face material risks by transacting with them or by holding significant crypto-currency balances. Individual cryptoReserve Bank of New Zealand currencies may be more Betamax than VHS, and more MySpace than Facebook. Even if some of the constructs are enduring, such as distributed ledgers and the use of cryptography, specific crypto-currencies may be supplanted by competing transaction technologies. We close with a Latin expression much-beloved by contract lawyers and economists alike – caveat emptor – buyer beware.

The Analytical Note series encompasses a range of types of background papers prepared by Reserve Bank staff. Unless otherwise stated, views expressed are those of the authors, and do not necessarily represent the views of the Reserve Bank

Westpac capital requirements increased after breaching regulatory obligations

The Reserve Bank in New Zealand says that Westpac New Zealand Limited (Westpac) has had its minimum regulatory capital requirements increased after it failed to comply with regulatory obligations relating to its status as an internal models bank.

Internal models banks are accredited by the Reserve Bank to use approved risk models to calculate how much regulatory capital they need to hold. Westpac used a number of models that had not been approved by the Reserve Bank, and materially failed to meet requirements around model governance, processes and documentation.

“This is very disappointing. Operating as an internal models bank is a privilege that requires high standards and comes with considerable responsibilities. Westpac has not met our expectations in this regard,” Reserve Bank Deputy Governor and Head of Financial Stability Geoff Bascand said.

The Reserve Bank required Westpac to commission an independent report into its compliance with internal models regulatory requirements. The report found that Westpac:

  • currently operates 17 (out of 35) unapproved capital models;
  • has used 21 (out of 32) additional unapproved capital models since it was accredited as an internal models bank in 2008; and
  • failed to put in place the systems and controls an internal models bank is required to have under its conditions of registration.

The Reserve Bank has decided that Westpac’s conditions of registration should be amended to increase its minimum capital levels until the shortcomings and non-compliance identified in the independent report have been remedied.  Westpac’s minimum capital ratio requirements will be 6.5 percent for Common Equity Tier 1 capital, 8 percent for Tier 1 capital and 10 percent for Total capital, with the additional 2.5 percent capital conservation buffer applying.  Currently, for all other locally incorporated banks capital ratios are set at, respectively, 4.5 percent, 6 percent and 8 percent, plus the 2.5 percent buffer.

In addition, the Reserve Bank has accepted an undertaking by Westpac to maintain its total capital ratio above 15.1 percent until all existing issues have been resolved.  The Reserve Bank has given Westpac 18 months to satisfy the Reserve Bank that it has sufficiently addressed those issues or it risks losing accreditation to operate as an internal models bank.

“We believe the regulatory action is appropriate given the seriousness of Westpac’s non-compliance and the need to protect the integrity of the capital regime,” Mr Bascand said.

The Reserve Bank has taken into account that Westpac has not deliberately sought to reduce its regulatory capital. While there have been serious shortcomings and  non-compliance, it appears that Westpac has remained well above its required regulatory capital levels.

Westpac has confirmed that it does not dispute the findings of the independent report, that it is committed to remedying all the issues identified, and that it will maintain its total capital ratio above 15.1 percent.