During the September quarter 2016, the decrease in total assets was due to a decrease in residential mortgage assets (down $3.4b, 3.4%), other loans (down $0.8b, 4.9%) and; cash and deposits (down $0.3b, 7.0%).
At 30 September 2016, asset backed securities issued overseas as a proportion of total liabilities decreased to 3.8%, down 0.6% on the June quarter 2016 proportion of 4.4%. Asset backed securities issued in Australia as a proportion of total liabilities increased to 87.2%, up 0.4% on the June quarter 2016 proportion of 86.8%.
Note the ABS proposes to move the release date of Securitisers from the December 2016 quarter onwards to align closer to the release of Australian National Accounts: Finance and Wealth (cat. no. 5232.0). Dependant on feedback, future release dates will be three weeks prior to the release of Australian National Accounts: Finance and Wealth, with the exception of September quarters which will be released two weeks prior.
RBA’s Chris Aylmer spoke at the Australian Securitisation Conference entitled “Towards a more Transparent Securitisation Market“. He highlighted the significantly lower volume of mortgage backed securitisation written since the GFC, thanks to changed funding dynamics and lenders. In addition, using RBA’s securitisation dataset which contains information from around 50 sponsors and 270 trusts on around 1,100 securities and covers around 2 million loans; he highlighted portfolio LVR and default data. Finally, he discussed the need to improve data quality further for the future.
Recent Developments
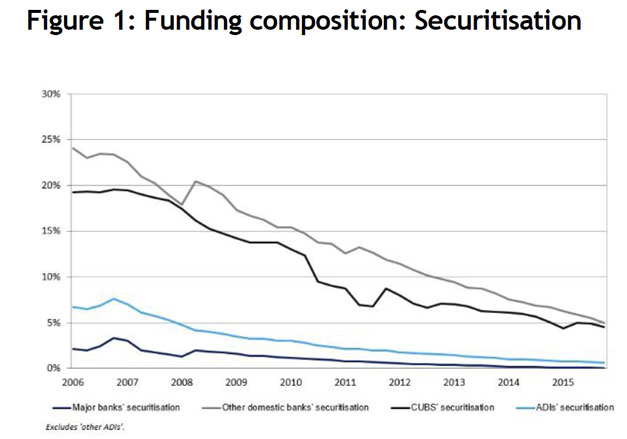
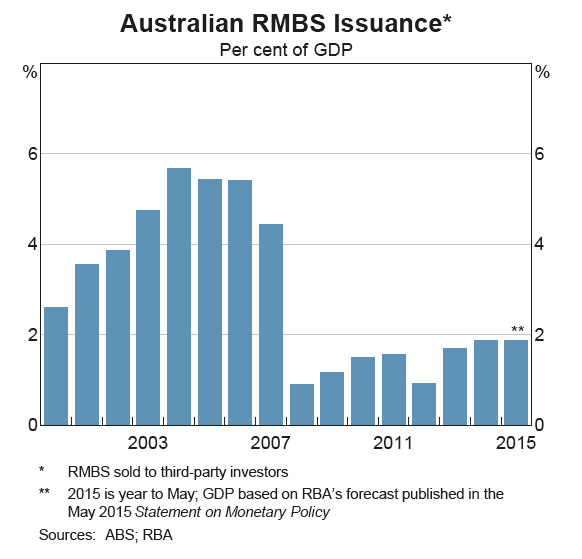
The Australian securitisation market experienced a gradual recovery following the global financial crisis, spurred initially by support from the Australian Office of Financial Management (AOFM) and demand from authorised deposit-taking institutions (ADIs, namely banks, building societies and credit unions) (Graph 1). However, issuance remains well below pre-crisis levels.
Graph 1
Residential mortgage-backed securities (RMBS) continue to form the largest part of the market, although there has been a notable reduction in issuance this year. Commercial mortgage-backed securities (CMBS) comprise only a tiny fraction of issuance, while other asset-backed securities (ABS) issuance is also quite small.
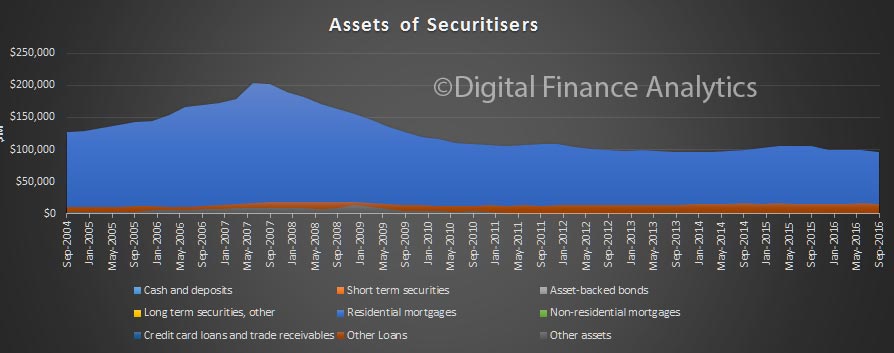
The stock of marketed securitisations outstanding is a little above $100 billion, compared with a peak of about $250 billion in 2007 (Graph 2).
Graph 2
The decline in RMBS issuance this year has been driven by a significant reduction in issuance by banks (Graph 3). This reflects, among other things, less favourable conditions than in the senior unsecured wholesale debt market where banks have been able to issue in size and for longer maturities. The treatment of encumbered assets in the net-stable funding ratio also favours the issuance of senior unsecured debt over RMBS.
Graph 3
Consistent with the reduced presence of banks in the asset-backed market, the share of conforming RMBS issuance has declined. In fact, over the past year non-conforming RMBS, which are mainly issued by non-bank mortgage originators, have accounted for about a quarter of total RMBS issuance, compared to a post-crisis average of around 5 per cent. Non-conforming RMBS have also become larger, with some recent issues being between $700 and $800 million – larger than any other non-conforming deal since 2007.
As noted previously, pricing on RMBS issuance has become somewhat less favourable relative to other sources of funding (Graph 4). Average primary market spreads on banks’ conforming AAA rated RMBS rose markedly in early 2016, from around 100 basis points to around 150 basis points. While these spreads have recently come down a little, they remain higher than is usually the case relative to spreads on the major banks’ unsecured Australian dollar-denominated bonds.
Graph 4
Before the crisis, typically around 40-60 per cent of ABS issuance was offshore. Since then, offshore issuance has been much smaller, and averaged around 4 per cent over the period 2012 to 2016. Some of this foreign demand may have been sated by covered bonds, the majority of which have been issued offshore. There is currently about $100 billion of covered bonds outstanding.
The investor base for Australian ABS has continued to evolve (Graph 5). Holdings of marketed ABS by ADIs have decreased a little over the past year or so, though they still remain high by historical standards, while there has been a pick-up in demand from real money investors.
Graph 5
The Securitisation Dataset
Our understanding of developments in the securitisation market has been enhanced by the individual deal data that we are now receiving, and in particular the de-identified loan-level data. For RMBS, these data include: 62 fields related specifically to the loan, such as loan balances, interest rates and arrears measures; 18 fields related to the borrower, such as borrower income and employment type; and 13 fields that detail the collateral underpinning the mortgage, including the postcode and property valuation. Useful new information includes data on offset balances and borrower income at origination. In addition, issuers are required to provide a working cash-flow waterfall model of the security which provides useful information about structural aspects of ABS.
The dataset contains information from around 50 sponsors and 270 trusts on around 1,100 securities (Table 1). It covers around 2 million loans, the majority of which are residential mortgages, or around one-third of mortgages outstanding.
Table 1: Asset-backed Securities in the New Securitisation Dataset Number
Sponsors(a)
Trusts
Securities
Loans
Total
RBA eligible
‘000(b)
Marketed RMBS
30
195
860
367
366
Of which:
– ADI
21
145
514
256
311
– Non-ADI
9
50
346
111
55
Non-marketed RMBS(c)
40
49
107
—
1,400
CMBS
2
3
23
5
1
Other ABS
7
26
127
24
407
Total
54
273
1,117
—
2,174
(a) Sponsors organise a securitisation transaction to sell or transfer receivables (such as loans) that they originated or acquired; the categories do not add to total because some sponsors are involved in multiple categories
(b) The categories do not add to total due to rounding
(c) Self-securitisations; these require a related-party exemption to be eligible for repo with the RBA
Source: RBA
As noted previously, the primary purpose for the RBA collecting these data is to allow it to manage its actual and contingent exposure to these securities. The RBA has accepted certain asset-backed securities as part of its regular market operations since 2007, and there are now nearly 400 eligible, marketed asset-backed securities that the RBA accepts under repurchase agreements (repo). While the RBA only accepts the AAA rated tranches in repo transactions and insists that these securities not have structural features or triggers that are particularly complex or unusual, they still have a wide range of features that make understanding the structure of the securities important. The assets underpinning them also range from household and commercial mortgages, through to auto loans and credit card receivables.
While we require these data to be collected for our own risk management purposes, the RBA also sees merit in the information on marketed securities being made available more broadly, in the interests of enhanced market transparency. Therefore, as part of our eligibility requirements for accepting certain marketed securitisations as collateral, we require issuers to make a significant share of the data they provide to us available more broadly to investors and other permitted data users.
The RBA also needs to understand non-marketed securitisations (known as self-securitisations) because these are potentially a significant share of the collateral used in our standing facilities. The Committed Liquidity Facility (CLF) is a large contingent liability for the RBA. It is used by ADIs to meet their liquidity requirements under the liquidity coverage ratio. The CLF enables participating ADIs to access a pre-specified amount of liquidity from the Reserve Bank by entering into repurchase agreements of eligible securities outside of our normal market operations. The current size of the CLF is $245 billion.
The self-securitisations are also used to cover payment settlements that occur outside business hours under the RBA’s ‘open repo’ arrangements. These arrangements, which permit banks to convert these securities to exchange settlement balances at the RBA, will become increasingly important as we move to the new payments platform (NPP) in late 2017. From this time more payment settlements will be occurring outside business hours, including over the weekend.
So what can we see in the data?
Debt securities
On the liabilities side, we have a wealth of information about the structure of each ABS. The main liabilities of a securitisation are the issued notes, which may be structured quite differently across deals. For example, RMBS marketed by the ADIs tend to have very simple structures, commonly one large senior note with relatively little subordination (Graph 6). In contrast, the RMBS structures issued by non-ADI mortgage lenders typically require a larger amount of subordination in order for the senior tranches to obtain a AAA rating, as the loan pools typically have a larger share of non-conforming loans. Another common feature of non-ADI deals is the large number of subordinated tranches.
Graph 6
The structure of different securitisations may change over time. This reflects the operation of each trust’s cash-flow waterfalls, which determine the linkages between the assets, the trust support features and the liabilities. The waterfalls specify the precise rules for the ordering of cash allocations in each period of the trust’s lifetime. As noted previously, the ordering and linkages within the cash-flow waterfalls permit a better understanding of the risk characteristics of individual deals.
These models of the cash flows allow us to monitor the performance of a deal and observe how it performs under a range of scenarios, including stress scenarios. For example, one risk associated with RMBS is prepayment risk, as mortgagees have the option to pay back their loans ahead of schedule. We can now observe how note balances and credit support evolve under different prepayment rates (Graph 7). In this case, a higher prepayment rate results in the principal outstanding on the senior notes being paid down faster; it also leads to higher credit enhancement sooner.
Graph 7
How each securitisation addresses mismatches between assets and liabilities and, in particular, the role of various support facilities such as those that provide the trust with liquidity, or mitigate its interest rate risk, is explicit in the data. Each deal will have several facilities, which may be provided by a number of different parties and potentially by a counterparty presenting the security as collateral to the RBA. This is particularly important for the RBA because of its relevance to how we mitigate ‘wrong way’ risk – that is, the risk that our exposure to a counterparty increases as the credit quality of that counterparty declines. To deal with this, additional repo haircuts are applied if the counterparty is ‘related’ to the asset-backed security presented to the RBA.
Loan-level information
The source of the cash flows needed to support the trust’s liabilities is the underlying asset pool. The new securitisation dataset provides important information on the quality of the underlying assets, by providing a detailed description of the associated collateral, borrowers and loan contracts. The loan-level data contain static information determined at origination (such as the type of collateral and its geographical location) and data that changes over time (such as the loan balances, loan-to-valuation ratio and arrears rates).
Features of the underlying assets can vary considerably across securitisations (Graph 8). The loans underpinning both the major bank and non-ADI securitisations shown here are geographically diversified across states, with the non-ADI deal a little underweight in NSW and overweight in Victoria relative to those states’ shares of the Australian population. At the same time, the non-ADI deal is more heavily concentrated in postcodes that are more distant from the centre of the capital cities than the major bank securitisation (Graph 9).
Graph 8
Graph 9
The interest rates paid by borrowers can also differ markedly across deals in the market, reflecting the considerable variation in characteristics of borrowers and lenders (Graph 10). Consistent with a loan pool comprising a higher share of non-conforming loans and self-employed borrowers, almost all loans backing the non-ADI deal shown here pay higher interest rates than those in the major bank deal (although again there is considerable variation across individual ADI and non-ADI deals).
Graph 10
It is also possible to monitor the quality of a security’s underlying assets over time (Graph 11). For example, at origination, a large share of the loans in these two deals had loan-to-valuation ratios (LVRs) close to 80 per cent, although the non-ADI deal had fewer loans with LVRs above this threshold. But now that the loans have aged, more recent data show that the LVRs are less concentrated as some of the loans have been paid down over time (although the data may not capture changes in valuations). The smaller shift in the distribution of the non-ADI deal could reflect a higher share of interest-only loans and/or a difference in the loan seasoning between the two portfolios, for example.
Graph 11
We are also able to analyse the distribution of arrears rates for securitised residential mortgages across Australia. Graph 12 shows that mortgage arrears are highest in Western Australia and Queensland, and in non-metropolitan regions, particularly those near mining operations.
Graph 12
The next steps for the RBA will be to develop an internal collateral pool model using, for example, credit risk models that take into account characteristics such as geographic concentrations, delinquencies and loan-to-value ratios.
Areas for Further Development
So what have we observed about the quality of the data, and where to from here?
The first point that I would make is that the data quality is generally good, though there is still scope to improve the accuracy, consistency and completeness of the data.
There is little consistency in reporting around credit scores and debt serviceability metrics. The RBA does not currently require this information to be made available to users of the data, but did flag last year that it would review this requirement once the information was collected. The RBA’s assessment is that because issuers are using very different measures and these metrics are currently being reported for only around half or three quarters of loans depending on the measure, publication would do little to enhance transparency at this stage. This will remain a ‘work-in-progress’ for the time being.
To improve data quality further, the RBA has continued to roll out more validation rules. To date, these rules have targeted the most critical fields for eligibility and the calculation of haircuts, ensuring that the information is complete and within plausible ranges. The rules also check for the completeness and internal consistency of the data. These checks will become increasingly sophisticated, focusing in particular on ensuring that the data evolve in a consistent manner over time.
The feedback that we have received from investors and other market participants is that, to date, the process for gaining access to the data is cumbersome, particularly the need to sign access deeds. With this in mind the ASF has recently released a new standard framework for loan-level data disclosure. The framework is a recommended minimum standard for industry participants when providing and receiving loan-level data for RMBS. The primary purpose of the framework is to mitigate certain risks, but particularly those relating to privacy where sponsors have to manage the risk around the possible re-identification of data.
There is more interest in the new data from buyers of lower-rated tranches, but this has not yet opened up a new investor base as investors have tended to rely on existing means of access to the relevant information. Better access arrangements would promote greater interest in the data from a wider investor base. It would also assist in the monitoring of deals so that investors can satisfy themselves that they are receiving the correct cash flows.
As I mentioned earlier, one of the RBA’s requirements for ABS to be considered repo eligible is that a large proportion of the new dataset (including summary stratification tables) be made available to the public. We will shortly be surveying information providers to see how this requirement is being met. Of particular interest is how users are accessing the securitisation data, how many requests have been received, the type of data request and take-up by investors and other permitted users.
The RBA is also planning to align the deadline for reporting to the RBA with the date that investor reports are due. This would remove the current mismatch and allow the RBA and other permitted users to price and assess the credit risk of these securities more accurately, and in a more timely manner.
In the interest of transparency, the RBA is now publishing information on our website about the progress of applications for securities to be considered eligible for the RBA’s market operations. This information includes details of securities that have been made ineligible because the ongoing reporting requirements have not been met.
APRA says their recent changes to securitisation will enable a much larger funding-only market and so provide ADIs the opportunity to strengthen their balance sheet resilience by accessing new sources of term funding, hopefully at relatively attractive pricing. In addition, with the more straight-forward approach to achieving capital relief, securitisation can also be valuable for capital management purposes, perhaps this is particularly so for smaller ADIs and this may bring benefits to the competitive environment. So said Pat Brennan, Executive General Manager APRA, when he spoke at the Australian Securitisation Forum Conference, Sydney and discussed the recent changes to the updated prudential standard APS 120 Securitisation (APS 120), and an associated prudential practice guide.
This marks the culmination of some five years of policy formulation, and APRA’s updates on progress over this period have featured prominently at previous ASF gatherings.
In all prudential policy development APRA is guided by its statutory mandate: to balance the objectives of financial safety and efficiency, competition, contestability and competitive neutrality – and in doing so, promote financial system stability. In addition, when finalising the prudential settings for securitisation APRA also remained true to the principles that guided the policy development process throughout:
to facilitate a much larger, simple and safe, funding-only market;
to facilitate an efficient capital-relief securitisation market; and
to have a simpler and safer prudential framework.
Over the last five years APRA’s policy deliberations were greatly assisted by the active engagement of industry in the consultation process. This was both through the ASF and bi-laterally, through formal submissions and informal meetings. It seems fitting at this point to reflect back on this process and note some key aspects of how policy evolved through the consultation process. I will then make a few comments thinking of the role of securitisation looking forward.
Funding only securitisation
Let me start with the subject of the first principle I noted – funding-only securitisation – that is where an Authorised Deposit-taking Institution (ADI) is not seeking capital relief, rather the focus is on accessing term funding to support their lending activities.
Early in the consultation process APRA had serious reservations regarding date-based calls when combined with a bullet maturity structure. Whilst contractually in the form of an option, such a feature may create an expectation that repayment will definitely occur on the stated date regardless of circumstances. This represents a prudential risk should investors be allowed the ‘best of’ either repayment from the underlying pool of loans or from the originating ADI. This type of arrangement is allowed in the case of covered bonds, but controlled within a legislative limit. To allow a proliferation of other covered bond-like arrangements would be imprudent.
Through consultation industry clearly articulated the benefits of bullet maturity structures:
with their more certain cash-flow structures, a much broader range of investors can be accessed;
hedging costs for ADIs are reduced, possibly materially so; and
these factors clearly support a much larger funding-only market.
Industry also accepted that the prudential risk can be managed by the requirements of APS 120, but also through the approach taken by ADIs. Specifically, an ADI should create no impression that the call is anything other than an option for the ADI, and that a call is only exercised when the underlying assets are performing. To put it plainly: an ADI must never bear losses that are attributable to investors.
The finalised APS 120 therefore facilitates bullet structures – this is probably the most significant single development in APRA’s securitisation reforms and is the product of constructive consultation and careful consideration by APRA of how to strike the best balance of the various elements of its mandate.
Tranching
Moving on, many in this room will recall APRA’s early aspiration for a simple, two-class structure with substantially all the credit risk contained in the lower ranking tranche. Such a structure would avoid the problems of complexity and opaqueness associated with securitisation – problems that manifested so clearly through the global financial crisis.
In a general sense simplicity is good – but finance is often not simple. Industry feedback was clear – the concept of a two-class structure has significant shortcomings as the risk preferences of investors in subordinated tranches are varied, and to have an active capital-relief securitisation market greater risk-differentiation, and therefore tranching, is necessary. APRA heard this not only from ADIs but other industry participants as well, including investors – and we were convinced.
As a result APRA has relaxed its approach regarding the number of tranches, though we hope industry will not pursue complexity for complexity’s sake – this is a trap structured finance has fallen into before, with unhappy outcomes.
As a side note, and one that applies much more broadly than securitisation, at times there is a need to consider how things may be, and not be unnecessarily anchored to the current reality we are familiar with. When APRA embarks on this type of consultation it can, on occasion, open possibilities for better outcomes, outcomes that were not previously contemplated, perhaps also bringing opportunities for industry innovation. Policy reform by its very nature is about changing the status quo and industry needs to acknowledge that just because something has traditionally been done a certain way is not, in itself, an argument that it should always be so.
Risk retention
Risk retention is another area where consultation lead to a significant change in APRA’s thinking. Whilst the originate-to-distribute model has not been prevalent in Australia, APRA’s early view was that if there was to be a risk retention requirement it should be set at a level that will truly make a difference and bring alignment of interests between originators and investors. We proposed a level of 20 per cent. At the time there was also an expectation that international practices would be broadly consistent.
As time progressed a variety of skin-in-the-game requirements emerged internationally, generally set at lower levels. Assisted by industry feedback APRA reflected that an Australian requirement, in addition to the varied international requirements, would add regulatory burden for limited prudential benefit. So when balancing APRA’s mandate in the context of the feedback received through consultation, we placed greater weight on efficiency considerations and hence did not implement a risk retention requirement.
Capital requirements
Whilst APRA’s securitisation reforms relate mainly to ADIs as issuers, we are also naturally interested in the amount of capital ADIs hold for their securitisation exposures. We have updated capital requirements following the Basel Committee’s framework, but with adjustments reflecting the Australian context and in light of APRA’s objectives.
Once such adjustment is that APRA has not implemented the approach involving the use of internal models for setting regulatory capital requirements. Instead APRA has implemented the remaining two approaches from the Basel framework: an approach based on external ratings and a standardised approach. Whilst many in industry would have preferred APRA to allow the use of internal models, as we have implemented the risk weight floor of 15 per cent this considerably limits the potential differences in outcomes. This is because a floor of 15 per cent is likely to have been applied to the majority of securitisation exposures if internal models were used, reflecting the relatively high credit quality of the underlying loans. In addition, not implementing the internal models approach is consistent with the objective to have a simpler and safer prudential framework.
A second adjustment is APRA’s requirement that an ADI deducts holdings of subordinated tranches from their own capital. There is frequent comment on APRA’s conservative approach to capital settings throughout the prudential framework. The Basel framework sets minimum standards and the relevant authorities around the globe are expected to set higher standards where they see this as being appropriate – Australia is not alone in setting conservative standards. In the Australian context, with the majority of ADI assets being residential mortgage loans, APRA’s view is there is substantial potential risk in having any incentive in the prudential framework for ADIs to hold the more risky tranches of other originator’s securitisations.
After the lengthy and detailed consultation, APRA is firmly of the view the principles underlying these adjustments are appropriate. I note that, as a result of the consultation process, APRA did relax the level at which the deduction approach applies as industry outlined that with limited additional risk certain common securitisation structures will be viable for ADIs to use if such a relaxation was applied.
Warehouse arrangements
Throughout the process of reforming APRA has been motivated to remove the current unsustainable situation that can arise through warehouse arrangements where capital leaves the banking system with no reduction in risk in the system. In 2014 APRA proposed that a concession remain, but be limited in time to a period of one year. This proposal proved unpopular with industry, which APRA found a little surprising at the time given it was designed to retain the concession in full for a year, and we anticipated this would be economically attractive over at least a two year period. Nevertheless, industry feedback was clear and negative.
In 2015 we put this subject back to industry to propose potential solutions, noting that in the absence of any viable option being identified APRA would simply treat warehouses as any other securitisation – either capital relief or funding only depending on the degree to which each arrangement meets the relevant requirements.
The feedback we received generally asked for the existing concession to remain indefinitely, and as APRA had said, that was unsustainable. So on warehouses, the consultation process did not offer any viable alternatives.
The final APS 120 accommodates warehouses, but with no special treatment when compared to other forms of securitisation. APRA hopes that efficient funding structures are agreed between market participants so the benefits of warehouse arrangements can continue.
From these examples you can see that the final form of APS 120 is different to how it would have appeared if it was finalised even just two years ago, and very different to how it would have appeared if it was finalised a year or two prior to that. APRA has materially changed some policy positions and modified others as a direct result of consultation. In a few areas, where the prudential stakes were sufficiently high, APRA did not change its basic position – though the consultation process brought healthy challenge to APRA’s approach and caused us to consider aspects of the policy from a new perspective. In both cases – where policy was changed and where it was not – a constructive consultation process proved essential to arrive at the best possible prudential policy.
Looking forward we all hope to see the Australian securitisation market grow and prosper. Having a much larger funding-only market would provide ADIs the opportunity to strengthen their balance sheet resilience by accessing new sources of term funding, hopefully at relatively attractive pricing. With the more straight-forward approach to achieving capital relief, securitisation can also be valuable for capital management purposes, perhaps this is particularly so for smaller ADIs and this may bring benefits to the competitive environment.
APRA is soon to finalise the Net Stable Funding Ratio (NSFR) to be applied to 15 larger, more complex ADIs, and this is expected to be implemented in 2018 alongside the securitisation reforms. The Australian banking system has some notable features that are not very common around the globe. On the asset side the banking system essentially funds lending for housing on its collective balance sheet, whilst on the liability side the Australian banking system has a relatively low deposit to loan ratio. Whilst the affected ADIs are reasonably well placed to meet the NSFR requirement, new opportunities to strengthen funding profiles will assist in strengthening this measure over time – and this strengthening will make the system more resilient.
Whilst a much larger Australian securitisation market depends on market forces, which have ebbed and flowed considerably in recent years, it seems certain that over time opportunities to grow the market will present themselves. The updated prudential framework, and accommodating bullet maturity structures in particular, places ADIs well to take advantage of those opportunities as they arise.
New securitisation guidelines from APRA may benefit competition, provide improved prudential outcomes, provide efficiency offer a stable long term funding source.
In Australia, securitisation has typically been a material share of funding for a number of ADIs. Smaller ADIs e.g. domestic banks (other than the major banks), credit unions and building societies (CUBS), in particular, use securitisation to generate a greater proportion of funds than larger ADIs.
Securitisation of loans and other assets can be an important and cost-effective mechanism by which an ADI can obtain funding for its business. Australian ADIs have used securitisation successfully for many years to diversify their funding base and make efficient use of capital.
APRA has been working to update its regulatory framework for securitisation to incorporate the most recent internationally agreed regulatory reforms, as well as to reflect the lessons of the global financial crisis and provide a more sustainable basis for the securitisation market going forward.
APRA’s reforms to apply simpler approaches to assigning regulatory capital for securitisation exposures will reduce the differential treatment of ADIs using advanced and standardised approaches to regulatory capital for credit risk, which may benefit competition.
The main amendments to the draft revised APS 120 and APRA’s clarifications relate to:
reducing the scope of exposures where a Common Equity Tier 1 Capital (CET1) deduction is required;
including more flexible arrangements in regard to funding-only securitisations; and
additional flexibility for ADIs making use of warehouse arrangements that may qualify for regulatory capital relief.
APRA also decided not to modify its proposals in several areas, after considering industry submissions. APRA proposals that remain unchanged include:
removal of the advanced modelling approaches to calculating regulatory capital requirements;
treatment of securitisations of revolving credit facilities, ABCP, and synthetic securitisations; and
the treatment of shared collateral.
The final revised APS 120 also reflects APRA’s implementation of the Basel Committee’s revised securitisation framework (Basel III securitisation framework), with appropriate Australian adjustments.
To better reflect underlying risk, and to address the lessons learned from the global financial crisis, APRA’s initiatives and the Basel III securitisation reforms include more conservative regulatory capital requirements for some types of securitisation exposures. However, the underlying operational requirements for securitisation are either unchanged or have been simplified.
In responding to submissions on the revised APS 120, APRA has sought to reach an appropriate balance between the objectives of financial safety and efficiency, competition, contestability and competitive neutrality, whilst promoting financial stability. APRA considers the final revised APS 120 will, on balance, provide improved prudential outcomes and provide efficiency and competitive benefits to ADIs.
The explicit recognition of securitisation for funding purposes in the prudential standard is expected to improve the ability of ADIs to secure long-term, stable wholesale funding.
APRA’s reforms to apply simpler approaches to assigning regulatory capital for securitisation exposures will reduce the differential treatment of ADIs using advanced and standardised approaches to regulatory capital for credit risk, which may benefit competition. Further, APRA’s clarification of the regulatory capital requirements for warehouse arrangements may also assist smaller ADIs in improving access to term wholesale funding, without creating undue prudential risk.
The revised APS 120 will take effect from 1 January 2018. APRA is currently consulting on the draft revised APG 120. In the coming months, APRA will separately consult on revised reporting requirements for securitisation that would take effect at the same time as the revised prudential standard and prudential practice guide.
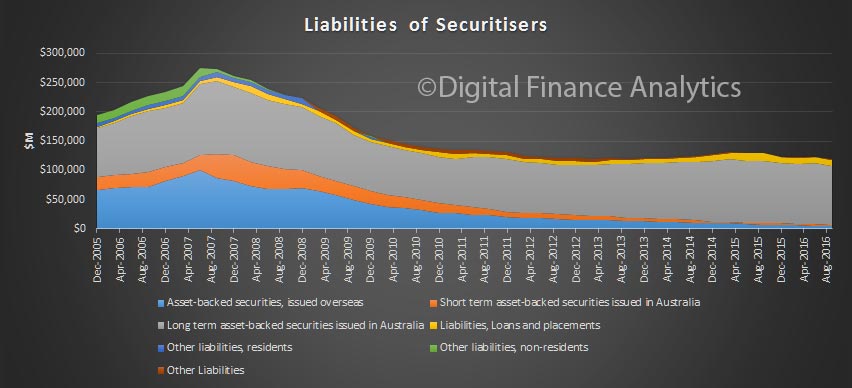
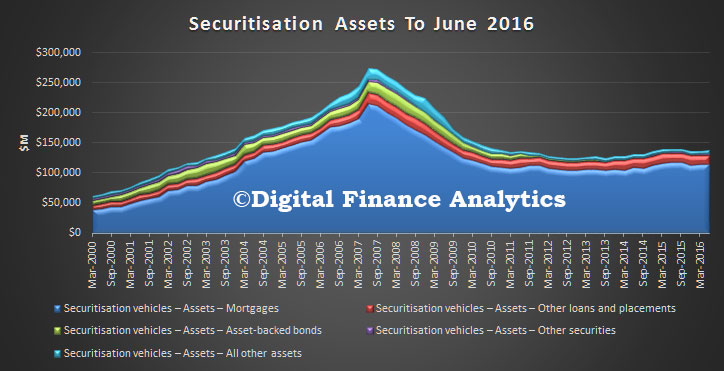
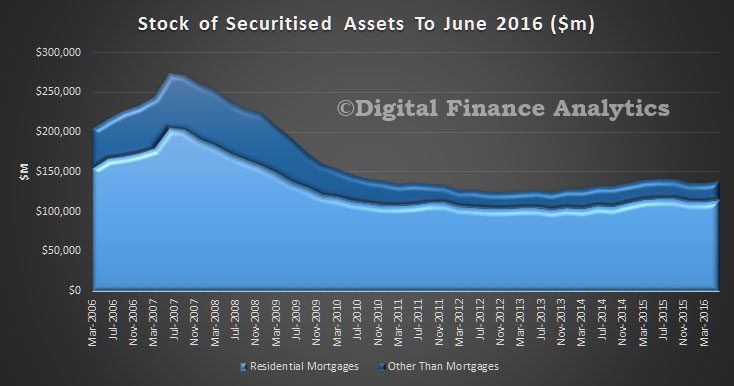
The RBA statistics gives a view of the state of play of in particular mortgage backed securitisation. Prior to the GFC this form of financing was accelerating, but since then has been less popular – due to higher regulatory requirements, lower overseas demand, and the emergence of other funding structures. The costs of issuance, which before the GFC were significantly lower than more traditional funding alternatives, has largely been negated.
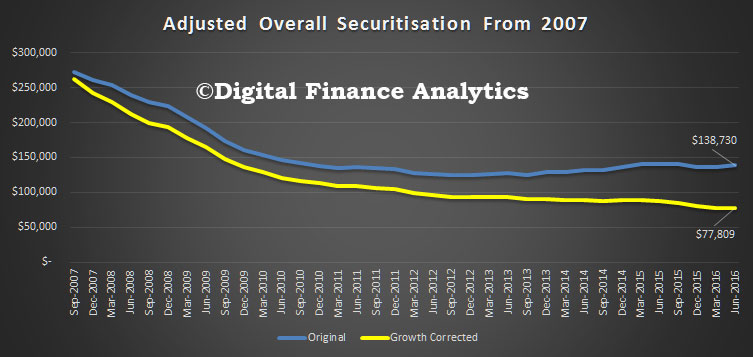
As a result, total mortgage backed assets fell 0.37% month on month to $114 billion. Compare this with a peak of $215 billion in June 2007.
Remembering that bank credit has been growing significantly, the fall is, in real terms, even more stark. The chart above depreciates the total securitisation pool of ~$138 billion by credit growth, from its peak in 2007. It shows that in 2007 terms, the fall is even greater, to ~$78 billion, a significant drop from its peak of $274 billion.
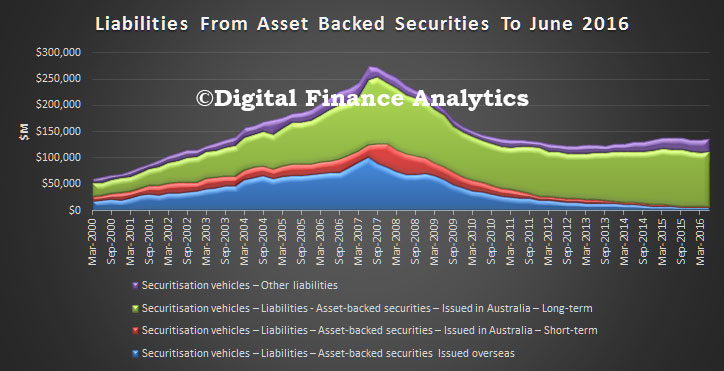
The other significant fact is that now 94% of securitisation deals are being sold in Australia, of which 75% are short term, and 19% long term. Overseas issuance, which peaked in 2007, remains close to their lows, at around 1.6%.
According to Moody’s on 15 September, Deutsche Bank AG announced in a filing that it has commenced negotiations with the US Department of Justice (DoJ) aiming to settle civil claims in connection with the bank’s underwriting and issuance of residential mortgage-backed securities (RMBS) and related securitization activities between 2005 and 2007. Eliminating the claims’ litigation tail risk at a manageable cost would be credit positive for Deutsche Bank, but negotiations have just begun and the final cost of settlements of complex capital markets litigation remains very difficult to predict.
At the end of the second quarter of 2016, Deutsche Bank had €5.5 billion of litigation reserves, for a variety of legal matters, but the bank has not disclosed the size of reserves for any specific action. For the analysis below, we have assumed that at least half of the litigation reserve could be made available for a possible DOJ settlement. If Deutsche Bank can eliminate this tail risk and settle within or near the assumed reserve of €2.75 billion (or $3.1 billion), it would be positive for bondholders.
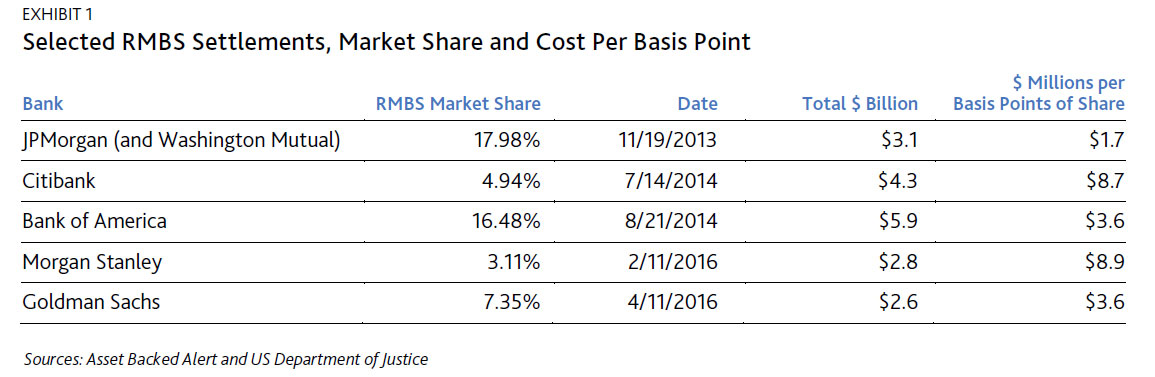
Deutsche Bank has indicated its willingness to consider settlements at a cost broadly in line with peers’ prior settlements. However, as Exhibit 1 indicates, peers’ settlements have varied widely, ranging from $1.7 million to $8.9 million per basis point of RMBS league table share. Based on Deutsche Bank’s 6.4% market share, a settlement in the low end ($1.7 million per basis point) or even at the mid-point ($3.6 million per basis point) of the settlement range would be well covered by our assumed DOJ settlement reserve. However, a DB settlement at the high end of announced peer settlements ($8.9 million per basis point) would total $5.7 billion. A settlement of $5.7 billion would require an addition to our assumed DOJ settlement reserve of €2.4 billion, which would dent 2016 profitability (pretax earnings for first-half 2016 totaled €1 billion), a credit negative. Basing litigation exposure solely on market share is a crude approximation, but it helps dimension the adequacy of reserves and potential income statement effect.
The commencement of these negotiations is not surprising since Deutsche Bank management set a strategic objective to resolve crisis-related litigation and remove uncertainty hanging over the bank. As the complex negotiations proceed, we also expect that management have strong incentives to resist a quick settlement with the DOJ that is more expensive than the prior settlements of peers. These incentives include preserving flexibility with respect to paying coupons on its additional Tier 1 (AT1) securities. Even a settlement requiring an additional $2.4 billion of reserve should still leave Deutsche Bank with sufficient flexibility to pay its 2017 AT1 coupons. We expect this flexibility to increase given the EBA’s announced intention to bifurcate Pillar 2 capital requirements into required and guidance components, with only the required component factoring into the calculation of the Maximum Distributable Amount for AT1 coupon payments.
Finally, Deutsche bank’s current Baa2 rating and stable outlook already incorporates the possibility of a modest loss (and substantial litigation costs) in 2016 and the potential for limited profitability in 2017.
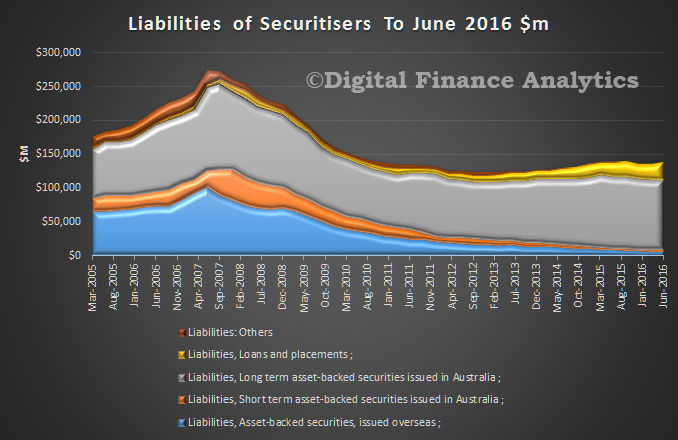
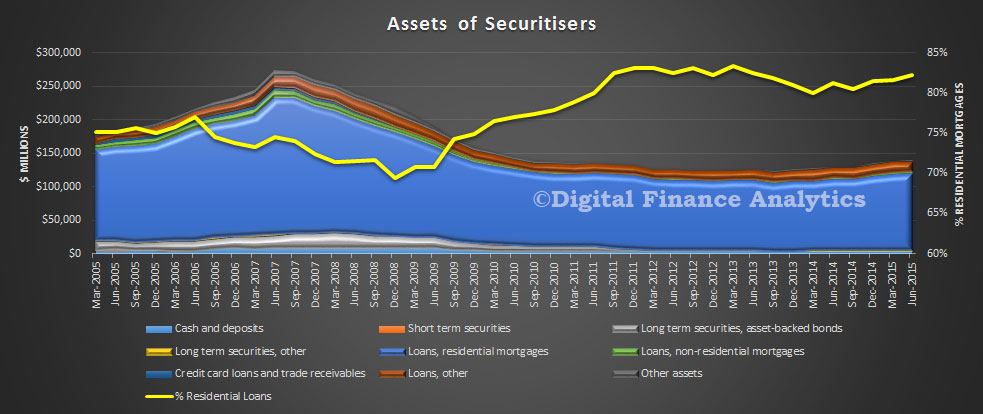
The latest ABS data covering the Assets and Liabilities of Australian Securitisers was released today, to June 2016. Total assets of Australian securitisers were $138.7b, up $2.6b (1.9%) on 31 March 2016, though still well below the GFC peak. The increase in total assets was mainly due to an increase in residential mortgage assets (up $1.4b, 1.2%), other loans (up $0.8b, 5.4%) and; cash and deposits (up $0.2b, 4.5%). This rise is linked to the momentum in the mortgage market, and includes the non-bank sector, who are lending more, using securitised funding.
The bulk of issuance was within Australia, quite different from pre-GFC. Asset backed securities issued in Australia as a proportion of total liabilities decreased to 76.4%, down 0.9% on the March quarter 2016 proportion of 77.3%. Asset backed securities issued overseas as a proportion of total liabilities increased to 4.6%, up 0.1% on the March quarter 2016 proportion of 4.5%.
At 30 June 2016, total liabilities of Australian securitisers were $138.7b, up $2.6b (1.9%) on 31 March 2016. The increase in total liabilities was due to an increase in loan and placements (up $1.7b, 7.1%), long term asset backed securities issued in Australia (up $1.1b, 1.1%), and asset backed securities issued overseas (up $0.3b, 4.2%).
Films like The Big Short have shaped many people’s view of residential mortgage backed securities (RMBS).
Like all types of investing, RMBS come with their share of risks and they’re easy for Hollywood to dramatise. However, James Austin, chief financial officer of local non-bank lender Firstmac, says RMBS unfairly carry the load for everything that went wrong in the US in 2007.
“The reality is that in the US, RMBS was simply the tool,” says Austin. “It’s a bit like a builder blaming his hammer. In actual fact it’s the loans themselves and the way those loans were written that were the problem, not the underlying structure or tool.”
The lack of regulation in US markets prior to the global financial crisis also contributed to the mishandling of mortgage backed securities. This is important to understand when considering RMBS in Australia, which is a very different market.
The scoop on securities
RMBS serve two main functions: on the one hand they give investors access to the mortgage market, while on the other they help financial institutions free up or raise capital. Home loans are traditionally private transactions that stay on a lender’s balance sheet for the duration of the mortgage, which means all the capital that’s paid remains tied up.
However, by pooling many loans together into a ‘security’, which is basically a bond (or IOU) that’s legally backed by home loans, this capital is moved off the lender’s books and made available. So, in short, RMBS are debt securities that investors can purchase from financial firms, with a view to earning interest on the entire pool.
There are also different classes of securities called tranches, which are just packages of loans. These let investors target a segment of home loans based on their quality and duration.
“The bond will have a rating from the rating agency, so as an investor you can trade off your risk appetite with the return you want to get,” says principal of consultancy Digital Finance Analytics, Martin North. “For example, you might decide to go for a junk bond [high risk – high yield] with a very a high coupon, but if people in that tranche started defaulting on their mortgages, then that bond would become worthless.
“Whereas a triple-A [low risk – low yield] bond puts you right at the top of the tree and you’d need to have major ruptures in the marketplace to lose your coupon.”
As such, returns on RMBS will vary depending on both the size of the issuance and the tranche you buy into. For example, Firstmac recently completed a $500m sale of RMBS, which produced about a 3.35% return in its AAA tranche, over a weighted average life of around 3-4 years.
Meanwhile, Firstmac’s High Livez RMBS fund, which is a retail fund available to regular investors, holds RMBS from big banks such as Commonwealth Bank and Westpac and has achieved a total return of 6.66% per year since inception in 2011, according to Firstmac. It’s worth noting that RMBS yields can be impacted by general market appetite, interest rate levels and the cost of insurance that’s put in place by the issuing company, among other things.
Who’s investing?
Given that many lenders use RMBS, investors in them can span a number of groups, including super funds, insurance companies, high net wealth investors and the government. The Big Short touched on several of these investors, including government sponsored mortgage company, Fannie Mae.
In Australia, the government’s support of the RMBS market is equally important. According to Austin, RMBS were funding $50-60 billion worth of Australian home loans per year before the GFC, which equated to about 20-25% of all home loans. This was almost completely erased by the financial crisis however, and that’s when the Australian Government stepped in with a $20 billion programme to support RMBS.
Ratings agency Standard & Poor’s says that RMBS now represent around 10% of housing credit funding locally and has been trending upward since 2009.
Risky business
Many local experts don’t see securities markets of other countries as all that comparable to Australia because of our regulatory framework, which is crucially supported by lender’s mortgage insurance on loans issued for more than 80% of the purchase price. This helps to maintain a lower level of mortgage arrears and historically low numbers of defaults.
S&P says that Australian regulators focus on prudent lending standards and this also provides an important safeguard to the local market. There are other factors that make RMBS favourable to local investors, such as Australia’s strong migration levels, which underpin the constant demand for housing, and an ongoing shift away from other financial sectors like mining, says S&P.
At the same time, Australian borrowers must pass strict credit checks by lenders and show other assets in their name, whereas some US home loans are non-recourse, meaning that the only security for RMBS investors in those instances are the properties themselves. When homes plummeted in value during the GFC, many borrowers just walked away.
“In Australia you can’t walk away,” says Austin. “They [authorities] will still come after your other assets or garnish your wages. Australians pay their mortgages, as a result.”
Additionally, Australian loans are only serviced by the lender and are not passed onto other parties, the way they typically are in the US.
Where are RMBS now?
North says that up until the GFC there was momentum in securitised mortgages in Australia, but that since 2008 issuances have been relatively modest.
Still, at the end of 2015 S&P reported a significant upswing in the issuance of RMBS over the last two years, due to a variety of factors that include increased domestic and offshore investor interest. Overall, more than $20bn worth of RMBS were issued in Australia last year, as per S&P.
By contrast, this year hasn’t started as strongly, with around $5bn issued as of April 30, S&P reports. Managing director and lead analytical manager at S&P, Kate Thomson says that global uncertainty in response to China’s slowdown, as well as the Brexit referendum in the UK, APRA’s proposals for APS 120 and Basel regulations, Transparent and Standardised (“STS”) Securitisations in Europe, and amendments to the EU Capital Requirements Regulation have all impacted RMBS growth lately.
Nonetheless, there are still major players in Australia, including Commonwealth Bank and Macquarie Bank, which are the top two RMBS issuers over the 12 month to March 31, S&P says. Other notable issuers include Westpac, ING and Citigroup, and smaller firms like Pepper Home Loans, Firstmac, Heritage Bank and Liberty Bank.
So there’s still a range of opportunities in RMBS for different investors and while it may not be as prominent a vehicle as it once was, the concept is still interesting, says North.
“It [RMBS] manages capital differently, turning cash flow into capital,” he says. “And so if the market ever freed up, it could reassert itself.”
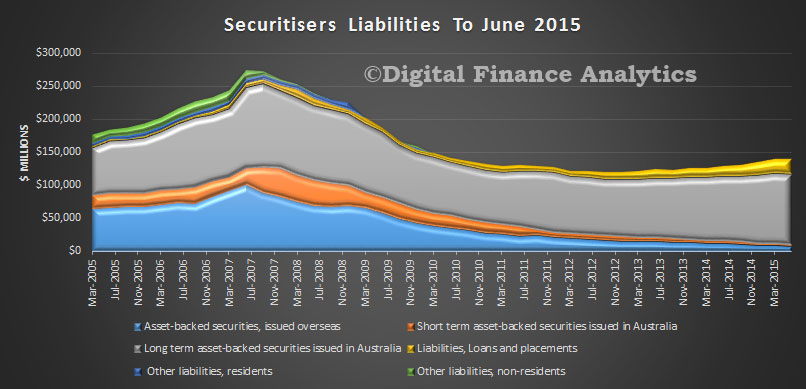
Data from the ABS shows that in the quarter to June 2015, balances with Securitisers grew. At 30 June 2015, total assets of Australian Securitisers were $140.4b, up $0.5b (0.3%) on 31 March 2015. During the June quarter 2015, the rise in total assets was due to an increase in residential mortgage assets (up $1.3b, 1.2%) and cash deposits (up $0.4b, 11.3%). This was partially offset by decreases in other loans (down $1.0b, 5.6%). Residential and non–residential mortgage assets accounted for 83.8% of total assets, were $117.6b at 30 June 2015, an increase of $1.3b (1.1%) during the quarter.
At 30 June 2015, total liabilities of Australian securitisers were $140.4b, up $0.5b (0.3%) on 31 March 2015. The rise in total liabilities was due to the increase in loans and placements (up $2.3b, 11.6%). This was partially offset by a decrease in long term asset backed securities issued in Australia (down $0.9b, 0.9%) and asset backed securities issued overseas (down $0.9b, 9.8%). At 30 June 2015, asset backed securities issued overseas as a proportion of total liabilities decreased to 5.9%, down 0.7% on the March quarter 2015 proportion of 6.6%. Asset backed securities issued in Australia as a proportion of total liabilities decreased to 77.1%, down 1.1% on the March quarter 2015 proportion of 78.2%.
We would expect to see further growth, because non-banks are likely to get more business as the majors dial back their investment lending, and because the securitisation market pricing has normalised from their heights of the GFC. That said, they are of course exposed to the global financial markets and events such as volatility in China are tending to lift rates a little. This may slow growth.
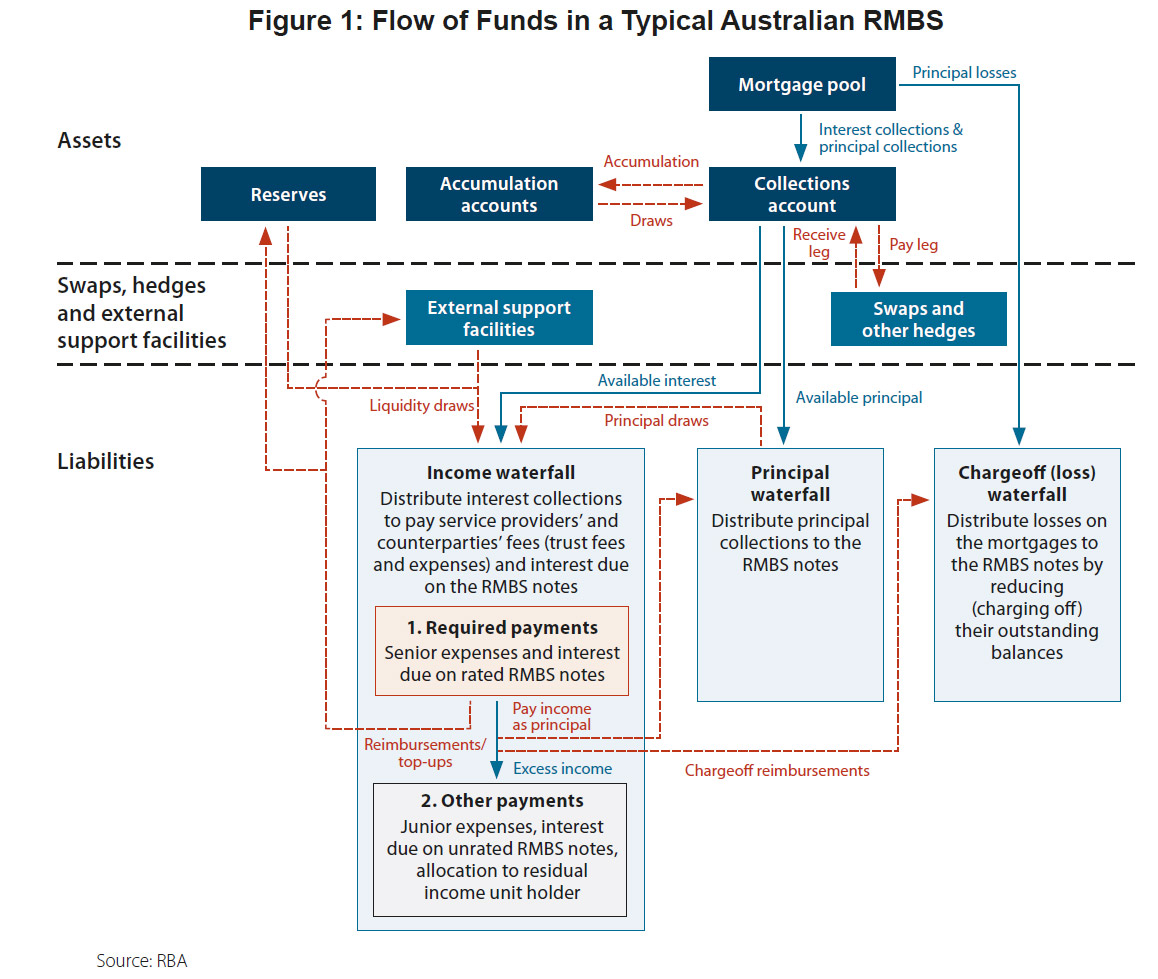
A residential mortgage-backed security (RMBS) is a collection of interrelated bonds that are secured by a dedicated pool of residential mortgages (the ‘mortgage collateral pool’). The payments of principal and interest on these bonds are funded from the payments of principal and interest made on the underlying mortgage collateral by the mortgagors. Historically, RMBS have provided an alternative to bank deposits as a source of funding for residential mortgages. This has been particularly important for smaller authorised deposit-taking institutions (ADIs) and non-ADIs that have limited access to deposit funding or term funding markets.
By allowing smaller institutions to raise funding in the capital markets, RMBS promote competition between lenders in the residential mortgage market. After increasing steadily in the early 2000s, issuance of Australian RMBS to third-party investors fell in the wake of the global financial crisis when these securities were adversely affected by a loss of confidence in the asset class globally despite the low level of mortgage defaults in Australia. The market has recovered somewhat over the past couple of years.
RMBS have been an eligible form of collateral in repurchase agreements (repos) with the RBA since 2007. During the height of the global financial crisis, RMBS formed a significant part of the RBA’s repo collateral and hence played an important role in the RBA’s response to the crisis. Currently, RMBS form the largest class of securities held under the RBA’s repos, although unlike the earlier episode, this has been in response to innovations in the payments system. From 1 January 2015, the RBA has provided a Committed Liquidity Facility (CLF) to eligible ADIs as part of Australia’s implementation of the Basel III liquidity standards. In total, the CLF provides ADIs with a contractual commitment to $275 billion of funding under repos with the RBA, subject to certain conditions. Given that RMBS are eligible collateral that could be provided to the RBA were the CLF to be utilised, they represent a substantial contingent exposure for the RBA and, hence, understanding RMBS is particularly important in terms of managing the RBA’s balance sheet.
While discussions of RMBS often focus on the mortgage collateral pool, as all payments to investors are made from the cash flows generated from this pool, the structural features of RMBS play an equally important part in determining the risks facing the holders of these securities. The ‘structure’ of an RMBS refers to the number and size of the interrelated bonds of the RMBS, the rules that determine how payments are made on these bonds and various facilities that support these payments.
This article provides a summary of the structural features typically found in Australian RMBS and how these have evolved over the past decade.
One element of note is tranching.
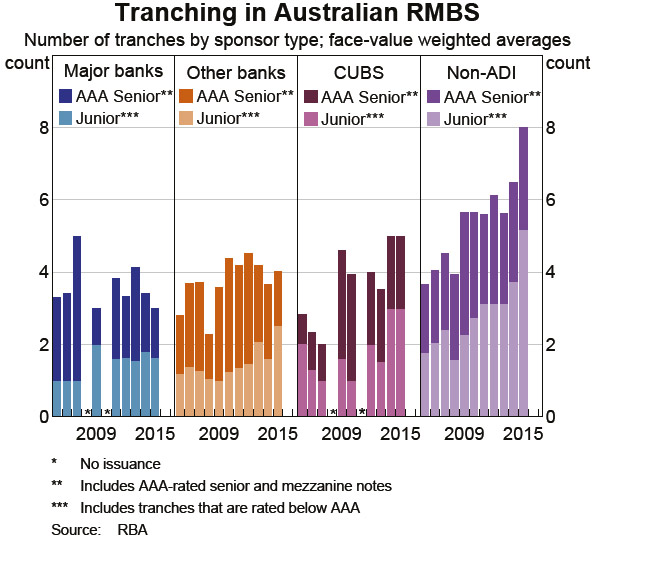
In summary, tranching enhances one part of the RMBS liability structure at the expense of another, by reducing credit and prepayment risk on the senior notes, while increasing these risks for the junior notes. Since 2005, there has been an increase in the degree of tranching in Australian RMBS. The average number of notes in an RMBS has increased from three in 2005 to four in 2015, with most of the increase occurring after 2008. The increase has been concentrated in the junior notes (which are typically rated below AAA), with the average number of such notes increasing by 1.5 per RMBS. The increase has been more pronounced in RMBS issued by non-ADIs.
The higher number of tranches for RMBS issued by non-ADIs reflects the need for non-ADI sponsors to fund their mortgage lending fully through RMBS issuance. This has led RMBS issued by non-ADIs to be structured with a larger number of tranches with different characteristics that appeal to a broad range of investor risk appetites.
The structures of Australian RMBS have evolved over time. Australian RMBS have generally become more structured over the past 10 years, especially since the global financial crisis: the tranching of both credit and prepayment risk has increased; the use of principal allocation mechanisms that vary over the life of the RMBS has become more widespread; bullet notes have been added; and various external and internal support facilities have continued to be used.
The increased structuring, which has developed to address changing market conditions, does not necessarily create more risk for investors, especially if they are provided with transparent and complete information about RMBS structures. Indeed, there has been a significant increase in the size of the credit enhancement provided to the most senior notes through the subordination of junior notes, with the increase in excess of the requirements of the credit rating agencies. The reliance on external credit support from LMI has also declined.
Understanding RMBS structures is essential to the effective risk management and valuation of RMBS because the RMBS structure determines how the risks generated from the securitised mortgages are borne by each particular RMBS note. Given the importance of RMBS as collateral in the RBA’s repurchase agreements, the RBA has a keen interest in understanding RMBS structures.
The RBA’s reporting requirements for repo-eligible asset-backed securities, which come in effect from 30 June 2015, will provide standardised and detailed information, not only on the mortgages backing RMBS, but also on the RMBS structures, including their cash flow waterfalls.

 During the September quarter 2016, the decrease in total assets was due to a decrease in residential mortgage assets (down $3.4b, 3.4%), other loans (down $0.8b, 4.9%) and; cash and deposits (down $0.3b, 7.0%).