Maxed Out: 4. Financial Stress Mapping

In the last part of our mini series we deep dive on aggregate financial stress mapping, as we identify the top hot spots across Australia.

See the methodology here: https://youtu.be/YIl4sh-WxIA
Part 1: Default Risk Mapping https://youtu.be/JSk0I7n-gXI
Part 2: Rental Stress Mapping https://youtu.be/KtzhX0YlCmo
Part 3 Investor Stress Mapping https://youtu.be/ckWAuw7lM7g

http://www.martinnorth.com/

Go to the Walk The World Universe at https://walktheworld.com.au/

Find more at https://digitalfinanceanalytics.com/blog/ where you can subscribe to our research alerts

Maxed Out: 3. Investor Stress Mapping

As we continue our series on stress mapping, we turn to investor stress and net yields, which are crushed in many areas. Which are most impacted?

See out earlier show here for the methodology: https://youtu.be/YIl4sh-WxIA

Part 1: Default Risk Mapping https://youtu.be/JSk0I7n-gXI
Part 2: Rental Stress Mapping https://youtu.be/KtzhX0YlCmo

http://www.martinnorth.com/

Go to the Walk The World Universe at https://walktheworld.com.au/

Find more at https://digitalfinanceanalytics.com/blog/ where you can subscribe to our research alerts

A Dose Of Reality, With Tony Locantro [Podcast]

I caught up with Tony Locantro from Alto Capital in Perth , to discuss the current dynamics across markets, property and more. Managed to fill my bingo card again, but the messages are so relevant given the current state of play!

https://www.altocapital.com.au/about

http://www.martinnorth.com/

Go to the Walk The World Universe at https://walktheworld.com.au/

Digital Finance Analytics (DFA) Blog
A Dose Of Reality, With Tony Locantro [Podcast]
Loading
/

Families in Financial Distress Are More Likely to Stay in Distress

According to the  latest from The St.Louis Fed On The Economy Blog, individuals who were in financial distress five years ago were about twice as likely to be in financial distress today when compared with an average individual.

Many households have experienced financial distress at least one time in their life. In these situations, households miss payments for different reasons (unemployment, sickness, etc.) and eventually file bankruptcy to discharge those obligations.

In a recent working paper, I (Juan) and my co-authors Kartik Athreya and José Mustre-del-Río argued that financial distress is not only quite widespread but is also very persistent. Using Federal Reserve Bank of New York Consumer Credit Panel/Equifax data, we reported that individuals who were in financial distress five years ago were about twice as likely to be in financial distress today when compared with an average individual.1

Consumer Bankruptcy

In this post, we focus our attention on a very extreme form of financial distress: consumer bankruptcy. We obtained financial distress data from the Survey of Consumer Finances (SCF), conducted by the Board of Governors. The data span from 1998 to 2016 with triennial frequency, and the respondents who are younger than 25 or older than 65 have been trimmed.2

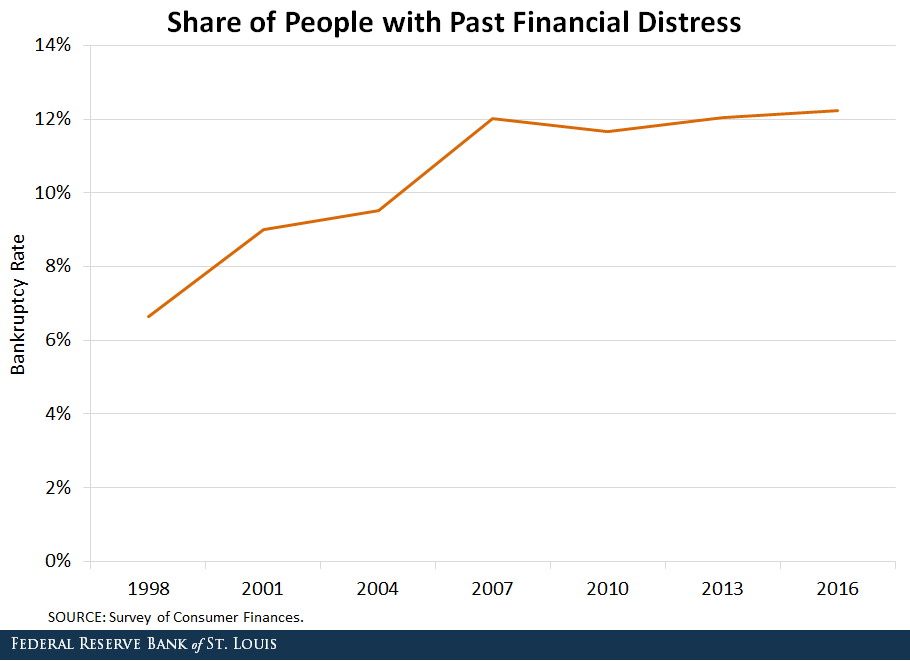
We first measured the share of households that had previously experienced an episode of financial distress by looking at people who filed for bankruptcy five or more years ago.3 The figure below shows that the share of households with past financial distress increased from approximately 6.6 percent in 1998 to 12.2 percent in 2016.


past distress


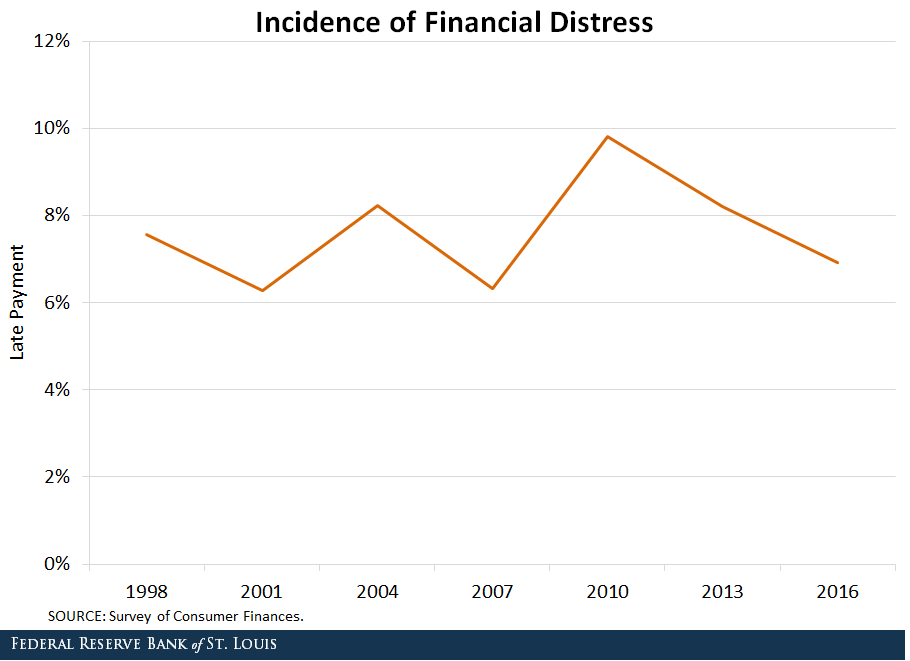
We then measured current financial distress by computing the share of households that delayed their loan payment on the year the survey was conducted.4 (We recognize that this measure is less extreme, as only a share of households that are late making payments will end up in bankruptcy.)5

The figure below shows that while there are minor fluctuations in the share of households with late payments throughout the sample period, the numbers remained around 8 percent.

current distress


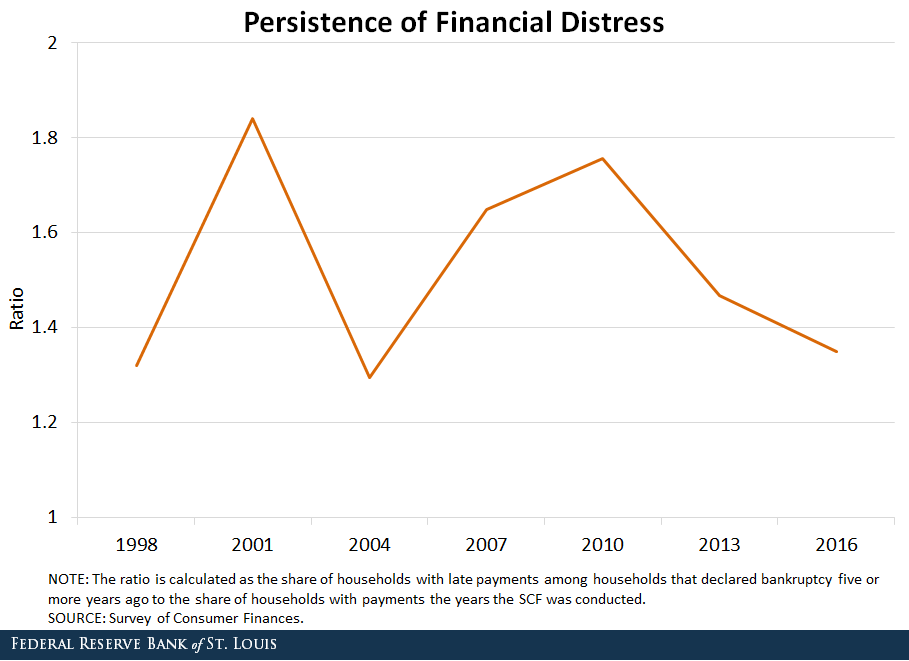
Finally, we created a ratio to measure the persistence of financial distress. It compares the share of households with late payments among households that declared bankruptcy five or more years ago to the share of households with late payments the year the SCF was conducted.

If financial distress was not persistent at all, both shares would be equal, and the ratio would be one. Thus, a value greater than one indicates the persistence of financial distress. The figure below shows the evolution of the persistence of financial distress over the years.

distress persistance

The ratio fluctuates around 1.5, implying that the households that have encountered an episode of financial distress in the past are 1.5 times more likely to delay payment today, compared to average households.

Debt agreements and how to avoid unnecessary debt traps

From The Conversation.

Debt agreements are the fastest growing form of personal insolvency in Australia. They were designed to offer debtors a low-cost way to make arrangements with their creditors, while avoiding bankruptcy and some of its more serious consequences.

When introduced, law reformers intended that debt agreements should be administered by volunteers rather than by commercial administrators who charge fees. However, in practice, debtors often pay substantial fees to debt agreement administrators.

In fact, many debtors pay more than 100% of their original debt, because of the high cost of administration fees. But there are cheaper options available for managing debt.

Debt agreements

Debt agreements are binding contracts made between debtors and their creditors in accordance with personal insolvency law. They are aimed at providing debtors in financial stress with the option of compromising with creditors. Not all debtors can enter into a debt agreement – there are income and debt limits.

In many cases, debtors pay their creditors an agreed reduced amount by instalments over a period of time. A debt agreement administrator assists in the negotiation process and distributes the payments to creditors.

Debt agreements have fewer adverse consequences than bankruptcy. One key advantage is that debtors may be allowed to keep their home.

Nonetheless, the adverse consequences of debt agreements include having a record on the National Personal Insolvency Index, and difficulties obtaining credit. Debtors’ ability to maintain a licence in various professions may be affected and the debt agreement must be disclosed in certain situations.

A growing problem in Australia

In 2016 there were 12,150 new debt agreements, comprising 41.5% of all personal insolvencies in Australia. While the number of debt agreements has increased steadily each year, bankruptcies have decreased since 2010.

Our research examines three sources of data to gauge the impact of debt agreements. These sources include statistics from the Australian Financial Security Authority (AFSA), an online survey of 400 debtors, and interviews with industry stakeholders.

Most debtors pay more under debt agreements than the amount they originally owed. This is due to the fees charged by AFSA and, in particular, for-profit debt agreement administrators.

In 2016, close to 23% of debtors’ payments went towards debt agreement administrators’ fees. The total amount of fees paid by debtors is higher when Australian Financial Security Agency fees and set-up fees paid to debt agreement administrators are included.

Many debt agreements are unsuitable

Debt agreements are useful for some people, such as those who have a home to protect from seizure in bankruptcy. However, consumer advocates find many instances of debt agreements unsuited to the needs of debtors. High administration fees are detrimental particularly for low income debtors.

Some debtors enter into debt agreements which they clearly cannot afford, aggravating their financial stress. If they are unable to make the payments required under a debt agreement and it is terminated, the fees cannot be recovered but the debts to creditors remain, leaving debtors in a worse position.

Debtors who rely primarily on Centrelink benefits are among the clearest examples of people unsuited to debt agreements. Centrelink benefits are meant to provide a basic standard of living, and diverting a portion of income towards debt agreements is likely to cause significant hardship.

People whose incomes comprise a disability or aged pension may in many cases be better off declaring bankruptcy, or seeking other forms of debt relief.

Better options available

There are several fee-free options for managing debt which do not involve the adverse consequences of debt agreements.

Financial hardship schemes commonly allow payment by instalments, or short term extensions of time, for debts owed to utilities or credit providers. Free independent dispute resolution offered by the Financial Ombudsman Service and the Credit and Investments Ombudsman is available to people who have disputes with financial service providers.

People often enter into debt agreements without seeking independent advice or accessing other options for managing debt. In 2016, 92% of debt agreement debtors relied on debt administrators as their primary source of information. Marketing often emphasises the advantages of debt agreements over bankruptcy.

Debtors often lack adequate knowledge of cheaper, better options for managing debt and of the adverse consequences of debt agreements. When the debt agreement system was established, it was not expected that private, profit-making debt administrators would assume a prominent role.

Law reformers noted in the 1996 Bankruptcy Legislation Amendment Bill that ‘if fees were charged, debt agreements would in many cases not be viable either for the debtor, or for his or her creditors’. They further noted that this would defeat the purpose for which debt agreements were introduced.

Recommendations

Reforms to the debt agreement system are currently being considered, but in order to be effective, these reforms should provide better safeguards for debtors. These should include stricter eligibility requirements for debtors entering into debt agreements such as a minimum income or ownership of assets which are protected from seizure in bankruptcy.

We need a more rigorous, legally binding assessment of debtors’ suitability on the part of debt agreement administrators; the provision of clearer information to debtors; and limits on administrators’ fees. Debtors should have access to free dispute resolution services when problems with debt agreement administrators arise.

Such reforms would reduce the risk of debtors being left worse off, financially, as a result of debt agreements that are unsuited to their circumstances.

Authors: Vivien Chen, Lecturer, Monash Business School, Monash University; Ian Ramsay, Professor, Melbourne Law School, University of Melbourne; Lucinda O’Brien, Research Fellow, University of Melbourne

Small Amount Credit Contract Reforms in Australia: Household Survey Evidence and Analysis

Last year we published a report on financially stressed households, including coverage of small amount credit contracts, using data from our household surveys.

Payment-PicNow Professor Gill North has published an important academic paper – see this link – “Small Amount Credit Contract Reforms in Australia: Household Survey Evidence and Analysis” which takes the analysis of the survey data much further. Here is the abstract.

A review of small amount credit contract regulation in Australia began in 2015 as mandated under section 335A of the National Consumer Credit Protection Act 2009 (Cth). The review panel sought comprehensive data on industry and consumer characteristics and trends. To provide such evidence, consumer groups commissioned original empirical research using data collected from a longitudinal survey that monitors the financial position and attitudes of Australian households. This data on household use of small amount credit contract loans was extracted for the last decade, allowing detailed analysis of the historical patterns and developing trends. The data indicates that overall demand for small amount short duration credit is growing in Australia, the consumer base is broadening, and the predominant form of lending today is online. Deeper analysis highlights the varying motivations of borrower households and their different stages and levels of financial difficulty. It also confirms the socio-economic, employment, educational and financial disadvantages of most households using these loans and their vulnerability to adverse changes in personal circumstances and negative external shocks.


DFA Analysis Of Highly Leveraged Households Featured In Nine News Segment

Nine News tonight, using data from the DFA household research programme, highlighted the highly leveraged status of many households who have bought into the property market in the past couple of years.

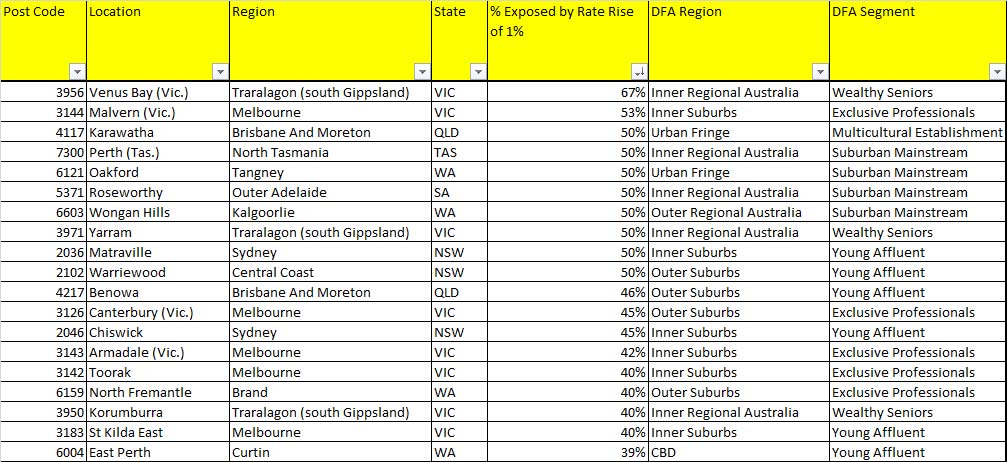
Our research has shown that in some eastern suburbs within the Sydney area for example, many households would find even a small rise in mortgage interest rates would create significant financial headaches. The most exposed suburbs nationally are listed below.

Affluent-STressThe analysis is based on responses to our survey which asks whether households feel they could cope with covering the costs of an additional 1% on their mortgage. Given that many have mortgages of more than $500,000, even a small rise is enough to create problems, especially given static income. Note also that more affluent segments are more at risk.

Read more about our research in our recent blog posts.

Debt Overhang and Deleveraging

What is the relationship between high consume debt levels, and consumption? This is an important question for Australia, given the current record levels of personal debt, and sluggish consumer activity. Also, what will happen should house prices slip back, and households shift to a deleveraging mentality? The short answer is it will have a significant depressive economic impact – if insights from a newly published paper are true.

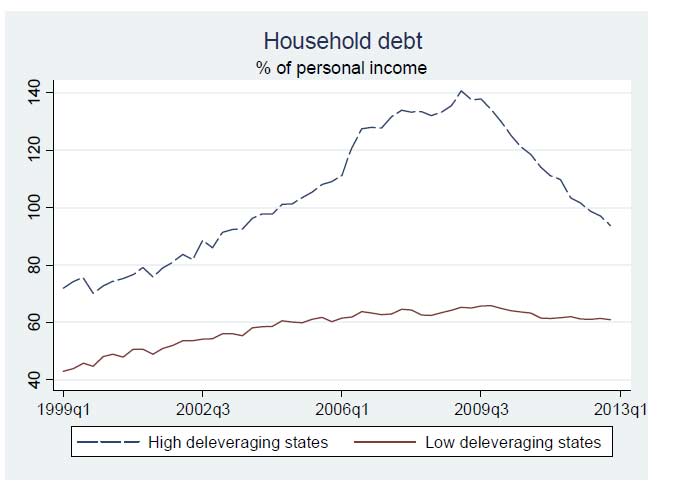
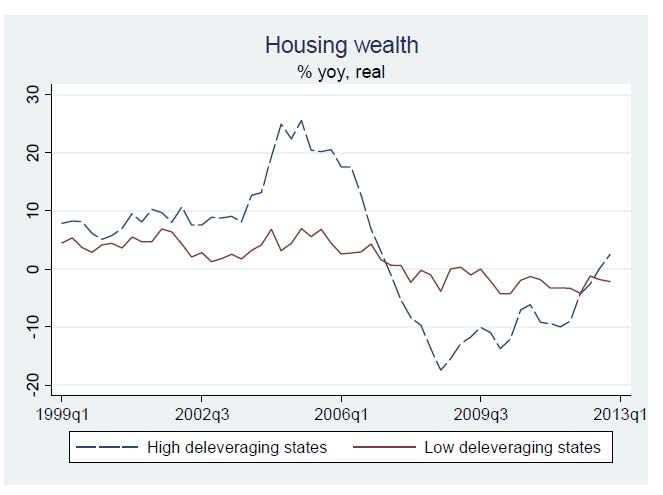
In a Bank of Canada Staff Working Paper, “Debt Overhang and Deleveraging in the US Household Sector: Gauging the Impact on Consumption” they use a dataset for the US states to examine whether household debt and the protracted debt deleveraging helps to explain the dismal performance of US consumption since 2007, in the aftermath of the housing bubble. By separating the concepts of
deleveraging and debt overhang—a flow and stock effect—they conclude that excessive indebtedness exerted a meaningful drag on consumption over and beyond income and wealth effects.

The leveraging and subsequent deleveraging cycle in the US household sector had a signifi cant impact on the performance of economic activity in the years around the Great Recession of 2007-09. A growing body of theoretical and empirical studies has therefore focused on explaining to what extent and through which channels the excessive buildup of debt and the deleveraging phase might have contributed to depressing economic activity and consumption growth.

They use panel regression techniques applied to a novel data set with prototype estimates of personal consumption expenditures at the state-level for the 51 US states (including the District of Columbia) over the period from 1999Q1 to 2012Q4. They include the main determinants as used in traditional consumption functions, but add in debt and its misalignment from equilibrium. They conclude that excessive indebtedness of US households and the balance-sheet adjustment that followed have had a meaningful negative impact on consumption growth over and beyond the traditional effects from wealth and income around the time of the Great Recession and the early years of the recovery. The e ffect is mostly driven by the states with particularly large imbalances in their household
sector. This might be indicative of non-linearities, whereby indebtedness begins to bite only when there is a sizable misalignment from the debt level dictated by economic fundamentals. They show that some states experienced significant deleveraging and a fall in household wealth.

Canada1Canada2 They argue that the nature of the indebtedness determines the ultimate impact of debt on consumption. The drag on US consumption growth from the adjustments in household debt appears to be driven by a group of states where debt imbalances in the household sector were the greatest. This suggests that the adverse e ffects of debt on consumption might be felt in a non-linear fashion and only
when misalignments of household debt leverage away from sustainable levels – as justfi ed by economic fundamentals – become excessive. Against the background of the ongoing recovery in the United States, where the deleveraging process appears to be already over at the national level, one might expect house-hold debt to support consumption growth going forward as long as the increase in debt does not lead to a widening of the debt gap.

Note that Bank of Canada staff working papers provide a forum for staff to publish work-in-progress research independently from the Bank’s Governing Council. This research may support or challenge prevailing policy orthodoxy. Therefore, the views expressed in this paper are solely those of the authors and may differ from official Bank of Canada views. No responsibility for them should be attributed to the Bank of Canada, the European Central Bank or the Eurosystem.

The Stressed Household Finance Report 2015 is Available

DFA has completed detailed analysis of households and their use of small amount credit contracts, a.k.a. payday lending.

Note this is looking at short term credit. If you are after our recent work on mortgage defaults and household financial stress, please follow this link:

The analysis, derived from our longstanding household surveys, was undertaken in conjunction with Monash University Centre for Commercial Law and Regulatory Studies (CLARS) and commissioned by Consumer Action Law Centre, Good Shepherd Microfinance, and Financial Rights Legal Centre.

Stressed-TitleWe review detailed data from the 2005, 2010 and 2015 surveys as a means to dissect and analyse the longitudinal trends. The data results are averaged across Australia to provide a comprehensive national picture. We segment Australian households in order to provide layered evidence on the financial behaviour of Australians, with a particular focus on the role and impact of payday lending.

To request the report, complete the form below. When submitted you will see an immediate acknowledgement, and receive the report via email after a short delay. Note this will not subscribe you to the DFA Blog. You can register to receive future updates here.

[contact-form to=’mnorth@digitalfinanceanalytics.com’ subject=’The Stressed Household Finance Report 2015′][contact-field label=’Name’ type=’name’ required=’1’/][contact-field label=’Email’ type=’email’ required=’1’/][contact-field label=’Comment If You Like’ type=’textarea’/][contact-field label=’Request Report’ type=’radio’ options=’Please Email Me The Report’/][/contact-form]