Research suggests bigger banks are worse for customers

From The Conversation.

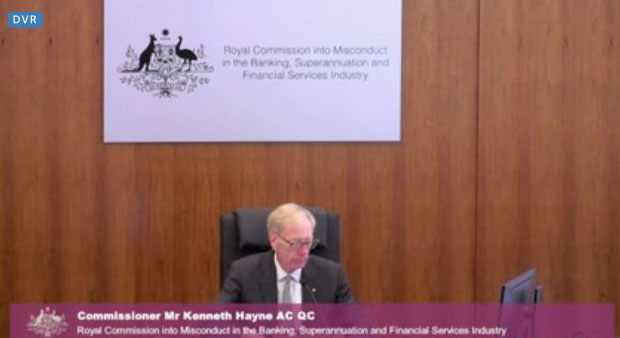
Yet again this week, the Hayne Royal Commission has brought disturbing news of misconduct toward customers of our largest financial institutions. This time super accounts have been plundered for the benefit of shareholders.

Recent research from economists at the United States Federal Reserve suggests this problem is not unique to Australia. If true, this supports the argument that larger financial institutions should be broken up or face more regulatory scrutiny.

The researchers found that larger banking organisations are more likely than their smaller peers to experience “operational losses”. And by far the most significant category (accounting for a massive 79%) within operational losses was “Clients, Products and Business Practices”.

This category captures losses from “an unintentional or negligent failure to meet a professional obligation to specific clients, or from the nature or design of a product”. When a bank is caught out engaging in misconduct toward customers, it is required to make good to customers – the so-called process of remediation.

It’s a category that perfectly captures the issues under review in the royal commission. Operational losses also include things like fraud, damage to physical assets and system failures.

In recent weeks we have heard a lot about Australian banks having to compensate customers. The cost to the bank is, however, far greater than the dollar value received by customers.

The administrative costs of such programs are significant, and then there are legal costs and regulatory fines.

While no-one feels sorry for banks having to suffer the consequences of their misconduct, regulators monitor these losses due to the possibility that they may increase the chance of bank failure.

Another aspect of the Federal Reserve’s study is the size of the losses. One example is where the five largest mortgage servicers in the United States reached a US$25 billion settlement with the US government relating to improper mortgage loan servicing and foreclosure fraud.

In another example, a major US bank holding company paid out over US$13 billion for mis-selling risky mortgages prior to the 2008 crisis. Settlements of this size have simply not occurred in Australia.

Why larger banks?

One might assume that economies of scale – reduced costs per unit as output increases – also apply to risk management. The larger the organisation, the more likely it has invested in high-quality, robust risk-management systems and staff. If this holds, then a large bank should manage risk more efficiently than a smaller one.

The possibility of unexpected operational losses should then be reduced. Larger financial institutions might also attract greater regulatory scrutiny, which might help to improve risk-management practices and reduce losses.

But the reverse seems to be true, based on the analysis of American banks from 2001-2016.

For every 1% increase in size (as measured by total assets) there is a 1.2% increase in operational losses. In other words, banks experience diseconomies of scale. And this is particularly driven by the category of Clients, Products and Business Practices.

In this category losses accelerate even faster with the size of the bank.

This could be the result of increased complexity in large financial institutions, making risk management more difficult rather than less. As firms grow in size and complexity, it apparently becomes increasingly challenging for senior executives and directors to provide adequate oversight.

This would support the argument that some financial institutions are simply “too big to manage” as well as “too big to fail”. If bigger financial institutions produce worse outcomes for customers, there is an argument for breaking up larger institutions or intensifying regulatory scrutiny.

Is the same thing happening in Australia as in the United States? The case studies presented by the royal commission suggest it could be, but it’s difficult for researchers to know exactly.

Australian banks are not required to publicly disclose comprehensive data on operational losses. APRA may have access to such information, but any analysis the regulator may have done of it is not in the public domain.

Perhaps this issue is something Commissioner Hayne should explore.

Author: Elizabeth Sheedy Associate Professor – Financial Risk Management, Macquarie University

Business investment is weak, but an unfunded company tax cut won’t fix it

From The Conversation.

Eight years after the global financial crisis (GFC), economic growth remains weak in many rich nations. Australia has been an exception to the malaise, but growth has slowed as the mining boom winds down.

Business investment is vital to economic growth and to lifting living standards, but a new Grattan report explores why Australian business investment is plummeting. Australia is now experiencing its biggest ever 5-year fall in mining investment, as a share of GDP. Non-mining business investment fell from 12% to 9% of GDP after 2009 and remains unusually low. Why is it low, and what should we do?

The shift to services has reduced investment

Most of the gap in investment between today’s non-mining investment rate and that of the early 1990s is due to long-term structural changes in the economy.

The non-mining market sector slowly became less capital intense, it shifted towards capital-light services, and it shrank as a share of GDP. Together, these factors have reduced non-mining business investment by almost 2% of GDP since the early 1990s. In the chart below, the decline in investment needed to offset “capital consumption” reflects declining capital intensity across the non-mining economy.


These declines are benign. Many non-mining industries now require less capital per dollar of output than they did in the past, because equipment is better and cheaper, in part thanks to the rise of China as a manufacturer. The shift to capital-light services largely reflects households choosing to spend more of their income on these services as their incomes grow.

The role of output growth

A less benign factor, slow output growth, has cut non-mining investment by about a percentage point of GDP compared to 1990, and about two percentage points since the boom years of the mid-2000s, when above-trend growth and buoyant financial conditions drove very strong investment. The role of growth can be seen in the chart above.

In turn, output has grown more slowly for two reasons: slower potential output growth, and a widening gap between actual and potential output.


The potential growth rate of the economy has declined in recent years. The International Monetary Fund (IMF) estimates that potential GDP is now growing at just over 2.5% a year, about a percentage point below its pace between 1995 and 2004.

Potential growth (the rate of output if all resources are being used efficiently) has declined mainly because productivity growth has slowed and the working-age population is growing more slowly. Productivity growth was exceptionally weak between 2004 and 2010. It recovered in recent years, but remains weaker than it was in the 1990s and early 2000s. The working-age population is growing more slowly, mainly because of a decline in net migration since its peak in about 2012 and, in part, because the population is ageing.

In addition, actual growth has been a bit slower than potential in recent years. The IMF estimates the gap between actual and potential output to be about 1.7% of GDP, though it is difficult to estimate with much precision. Several pieces of evidence suggest that actual output is below potential. Inflation is relatively weak and there is some spare capacity in the labour market. The capital stock is ample given the current level of output: office vacancy rates are high, while business capacity utilisation is close to its long-term average.

Transition from the mining boom may have made it difficult for the economy to operate at potential. As mining investment falls, demand for construction, in particular, weakens. In theory, as the terms of trade and mining investment decline, the real exchange rate and other prices can change to maintain full employment. But in practice, slow output growth is common after mining booms, perhaps because businesses and workers take some time to reassess their opportunities.

What next?

Looking ahead, if output growth remains subdued, the current level of non-mining business investment may be the “new normal”. If the economy continues to rebalance, non-mining investment is likely to increase. There are encouraging signs that non-mining investment responds to the exchange rate and other aspects of the business environment in the medium term: it has begun to pick up in NSW and Victoria. Output could even grow above potential for a few years, as the IMF and RBA both forecast. But investment is not likely to return to the levels of the mid-2000s.


Is a company tax cut the answer?

The government has proposed cutting the company tax rate from 30% to 25%, largely on the basis that the competition for mobile capital has intensified (see chart below). That would attract more foreign investment and could increase total business investment by up to half a percent a year. But such a cut would also reduce national income for years and would hit the budget. Committing to a tax cut before the budget is on a clear path to recovery risks reducing future living standards.


Other company tax changes could help. An allowance for corporate equity would make currently marginal investment projects more attractive, though highly profitable firms would pay more tax.

Accelerated depreciation would encourage investment, as would moving from today’s model to a cash flow tax. Both of them help firms to reduce tax paid at the time they make investments. But they would hit the budget hard in the early years, and would have to be phased in slowly.

An allowance for investment (for example, permitting firms to claim over 100% of depreciation) would support new investment without giving tax breaks on existing assets, but may be costly to administer, as firms could be tempted to relabel some operating expenditure as capital expenditure.

Government should ensure any company tax changes are offset by other tax increases or spending cuts.

What else should policymakers do?

Government stimulus and interest rate cuts can encourage business investment if there is spare capacity in the economy. Australia does have some spare economic capacity. But there are constraints on both arms of macroeconomic policy. The RBA is reluctant to cut interest rates from their already low levels, as it is concerned about risky lending. Public debt has grown (though it is still not high by international standards), though bank balance sheets remain large compared to GDP, limiting the scope to expand public sector debt.

Monetary policy should remain supportive, and tough prudential standards can help limit risky lending. There may be modest scope to build more public infrastructure, if governments can improve the quality of what they build.

Broader policies to support economic growth would also lead to more and better private investment. They include reducing tax distortions, boosting labour participation, encouraging competition, improving the efficiency of infrastructure and urban land use, tightening regulatory frameworks, and more reliable climate policy.

No single policy is a silver bullet, but together, they can help make better use of Australia’s existing assets and make new investment more attractive.

Author: Jim Minifie, Productivity Growth Program Director, Grattan Institute

Australia’s addiction to big houses is blowing the energy budget

From The Conversation.

Australia’s houses are getting bigger, but usually not more sustainable. In our recent study, we looked at the energy use of Australian houses, including the energy required to build, maintain and power our homes.

Perhaps unsurprisingly, we found that more energy goes into bigger houses. This is bad news not just for the environment, but also for our wallets. But these considerations are not always built into sustainability ratings.

So whether you’re building, buying, or just curious, what are the most important things to consider? And how much does house size affect total energy use?

Houses getting bigger

Over the past 60 years Australian homes have more than doubled in size, going from an average of around 100 square metres in 1950 to about 240 square metres today. This makes them the largest in the world, ahead of Canada and the United States.

At the same time, the average number of people living in each household has been declining. This means that the average floor area per person has skyrocketed from 30 square metres to around 87 square metres.

We know that larger houses require more heating and cooling and result in higher energy bills. They also need significantly more materials to build and maintain, and more energy to manufacture and replace these materials.

But how much more? That’s what we set out to find out.

Bigger houses, more resources

To systematically assess the relationship between house size and resource use, we analysed a typical new 6-star brick-veneer house in Melbourne’s climate.

We then modified the house size from 100 square metres to 392 square metres using 90 different size configurations (we’ve only shown four in the graphic below).

For each size, we measured both the energy embodied in the building materials and the energy required for replacing these over 50 years.

We also calculated the operational energy use over 50 years for two, three, four and five occupants. Finally, we accounted for energy losses across the energy supply chain.

Results show that larger houses use much more energy, but also that as size increases, the energy used in building and maintaining the house grows by more than the energy used to operate the house.

For instance, the energy embodied in a 392-square-metre house alone is larger than both the embodied and operational energy demands of a 100-square-metre house with three occupants, over 50 years. Logically, more occupants mean less energy per person, as the resources are shared.

The amount of additional resources needed for larger houses can be huge. Authors Own

Benefits of smaller, better-designed dwellings

Smaller dwellings tread more lightly on the planet and on your pocket. Based on data from Rawlinsons, each additional square metre of brick-veneer house in Victoria costs on average an extra A$1,245 for construction.

Combined with the resulting heating, cooling and lighting energy bills over 50 years, the total cost per square metre exceeds A$1,988. Removing a 12-square-metre bedroom from your next house can therefore save around A$24,000 and avoid the use of huge quantities of resources.

You might be thinking that smaller dwellings mean lower-quality dwellings. That’s not the case.

Examples of small, well-designed dwellings are all around us. These can be designed for durability and low energy use, as in-fill in dense urban surroundings, favouring natural daylight and ventilation, in symbiosis with nature or as smart urban apartments.

It is important for developers and architects to provide homes that are better designed for comfort and the environment while still being affordable.

The benefits of smaller dwellings go beyond the household itself and have repercussions at the city scale. Small homes – perhaps a mix of small houses on small plots, together with some larger apartment buildings – can save valuable space that can be used for communal infrastructure.

This would have to be done considering walkability, access to amenities and other factors, but can lead to much more efficient neighbourhoods from an infrastructure and transport perspective. So what needs to happen?

How do rules need to change?

Current energy efficiency regulations don’t account for the energy embodied in building materials, and so fail to adequately capture house size.

Most energy efficiency regulations also only measure energy use per square metre. Using this metric, larger houses appear to be more efficient because energy use increases at a slower rate than house size.

The Australian 6-star standard does include house size when considering heating and cooling, but other certifications don’t. Under these other certifications, a larger house would therefore be easier to certify, considering everything else constant.

This is ironic since larger houses use significantly more resources, both for construction and operation. We need to revise current energy efficiency regulations to include embodied energy and other measures of energy if we are to reduce the total energy and broader resource demands associated with buildings.

While our research investigated the relationship between house size and life cycle energy use, it did not consider apartment units. With a growing number of apartment buildings being constructed in Australia, the next steps include investigating a range of apartment design factors and their environmental implications.

By deepening our understanding of how to design better dwellings, we will ultimately help reduce resource use. We’ve studied house size, but that is not the end of the story.

Authors: André Stephan, Postdoctoral Research Fellow, University of Melbourne; Robert Crawford, Senior Lecturer in Construction and Environmental Assessment, University of Melbourne