Women are dominating employment growth, but what sort of jobs are we talking about?

From The Conversation.

One of the biggest transformations we have seen in advanced economies is the increased participation of women in the paid workforce. In recent Australian labour force trends, female participation is growing at nine times the rate of men’s. Women are dominating both full and part-time employment growth in Australia.

Why do changes in participation matter? Participation in the paid workforce – either being in employment or looking for work – is a key indicator of the overall health of any economy. It measures how much labour is being supplied relative to the population that we think should be engaged in the labour force – typically those aged 15-64 years.

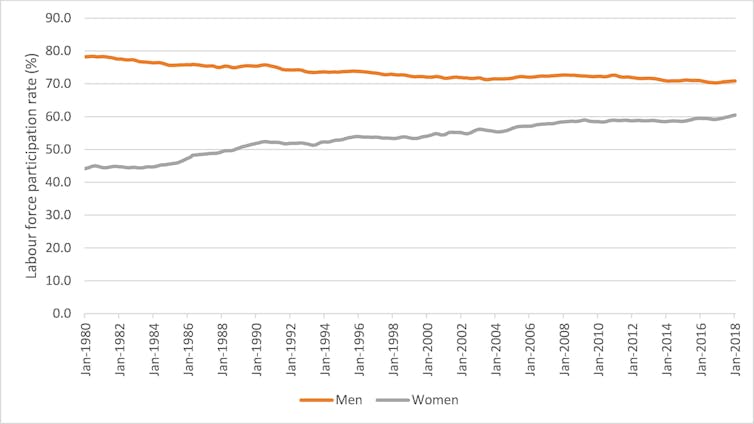
Over the past three decades female participation rates in Australia have increased dramatically – from around 40% to 60% – while male participation rates have fallen from 80% to 70%.

Labour force participation rate – men and women. ABS Cat No.6202.0, Labour Force, Australia

What is driving the increase for women? Gains in educational attainment, increased support through child care for women to engage in the paid workforce, and growth in female-dominated service sectors, such as health and education, are all strong contributors to these patterns.

On the other hand, several factors are likely to be contributing to the overall decline in male participation. These include a greater propensity to engage in post-school qualifications rather than go straight into the workforce, slower growth in traditional male-dominated sectors, such as manufacturing and wholesale trade, together with increased retirement support through the aged pension and superannuation.

These patterns are likely to continue. That means male and female labour force participation rates are likely to converge in the next 10-15 years.

Women have dominated job market growth

Job creation in the female-dominated health and education service sectors is driving both full-time and part-time employment growth in Australia.

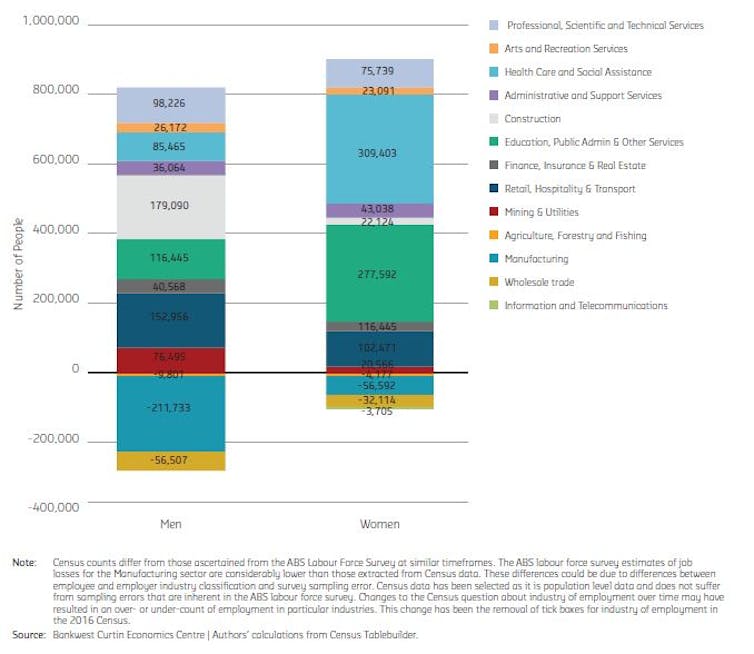
Analysis of the latest Census data reveal an increase of around 400,000 jobs in each sector. Most of these have gone to women.

Job losses and gains by sector, men and women, 2006 to 2016.

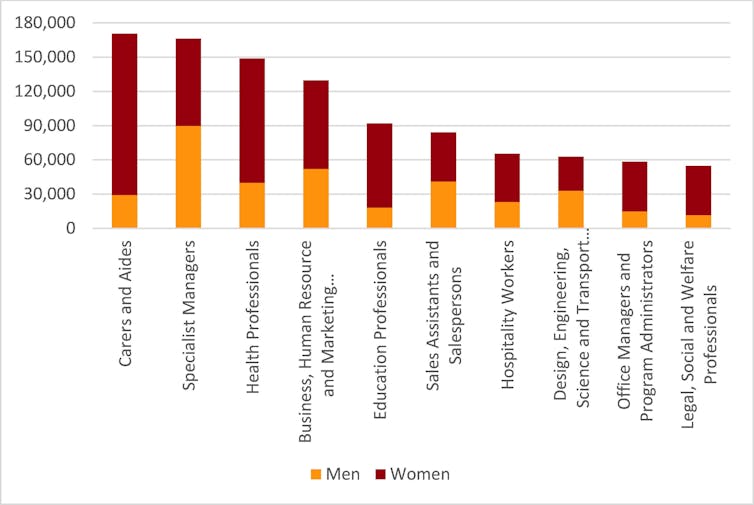
Reflecting the large growth in the health care and social assistance sector, around 170,000 more carers and aides are employed than there were ten years ago. And 150,000 of these workers are women.

Australia’s ageing and ailing population is no doubt playing a key role in this trend, with aged care and disability workers falling within this occupation category. This category also includes childcare workers.

The number of health professionals has also increased substantially – by around 150,000 workers in the ten years to 2016. Again, the majority of these extra workers are women.

Top ten growth occupations (volume), 2006 to 2016. Author's calculations from Census Tablebuilder

However, the way in which men and women engage in the paid labour force is very different. Women continue to dominate caring responsibilities and hence the part-time workforce. They typically use this employment arrangement as a means to balance work and family.

But we are seeing some changes on this front too. The rate of part-time employment is growing faster for men than for women. Male part-time work increased almost fourfold from 5% to 18% in the last four decades.

And both men and women are more likely to cite a preference for part-time work as the main reason for working part-time than they were ten years ago.

Where is the labour market headed?

The strength of the Australian labour market is currently founded in service sectors that are generally dominated by women.

This pattern will continue for the foreseeable future and beyond. Demand for “caring” occupations is unlikely to subside and automation is unlikely to produce any substantive substitute. Mining and construction booms may come and go, but these caring jobs are here to stay.

Many of these jobs are low-paying, however. This means that while we’re creating the jobs that are needed, we may not be assigning the appropriate value.

And while the future of work for the most part appears to be more “female” than “male”, this doesn’t necessarily mean men are unable to access these jobs, nor does it mean women are faring better overall in the labour market than men.

Author: Rebecca Cassells Associate Professor, Bankwest Curtin Economics Centre, Curtin University

Why the war on poverty in the US isn’t over, in 4 charts

From The US Conversation.

On July 12, President Trump’s Council of Economic Advisers concluded that America’s long-running war on poverty “is largely over and a success.”

While the council’s conclusion makes for a dramatic headline, it simply does not align with the reality of poverty in the U.S. today.

What is poverty?

The U.S. federal poverty line is set annually by the federal government, based on algorithms developed in the 1960s and adjusted for inflation.

In 2018, the federal poverty line for a family of four in the contiguous U.S. is $25,100. It’s somewhat higher in Hawaii ($28,870) and Alaska ($31,380).

However, the technical weaknesses of the federal poverty line are well known to researchers and those who work with populations in poverty. This measure considers only earned income, ignoring the costs of living for different family types, receipt of public benefits, as well as the value of assets, such as a home or car, held by families.

Most references to poverty refer to either the poverty rate or the number of people in poverty. The poverty rate is essentially the percentage of all people or a subcategory who have income below the poverty line. This allows researchers to compare over time even as the U.S. population increases. For example, 12.7 percent of the U.S. population was in poverty in 2016. The rate has hovered around 12 to 15 percent since 1980.

Other discussions reference the raw number of people in poverty. In 2016, 40.6 million people lived in poverty, up from approximately 25 million in 1980. The number of people in poverty gives a sense of the scale of the concern and helps to inform the design of relevant policies.

Both of these indicators fluctuate with the economy. For example, the poverty population grew by 10 million during the 2007 to 2009 recession, equating to an increase of approximately 4 percent in the rate.

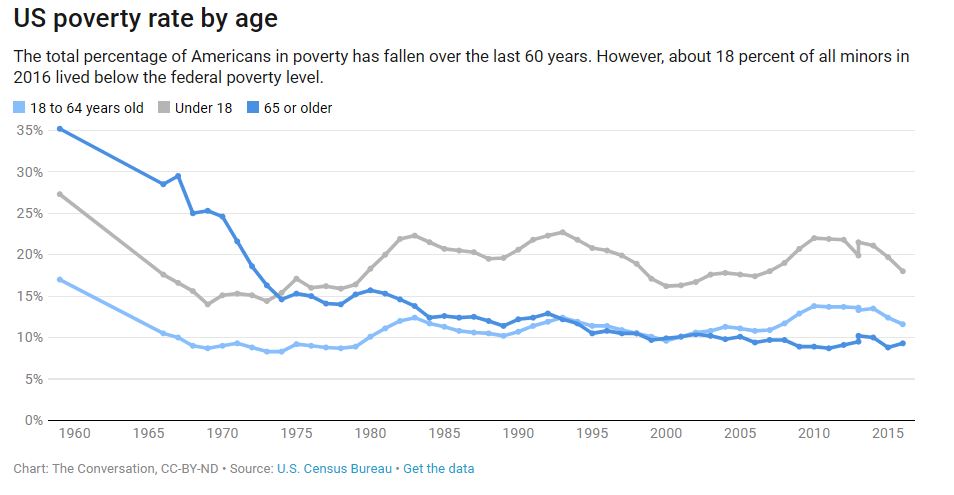
The rates of poverty over time by age show that, while poverty among seniors has declined, child poverty and poverty among adults have changed little over the last 40 years. Today, the poverty rate among children is nearly double the rate experienced by seniors.

The July report by the Council of Economic Advisers uses an alternate way of measuring poverty, based on households’ consumption of goods, to conclude that poverty has dramatically declined. Though this method may be useful for underpinning an argument for broader work requirements for the poor, the much more favorable picture it paints simply does not reconcile with the observed reality in the U.S. today.

Deserving versus undeserving poor

Political discussions about poverty often include underlying assumptions about whether those living in poverty are responsible for their own circumstances.

One perspective identifies certain categories of poor as more deserving of assistance because they are victims of circumstance. These include children, widows, the disabled and workers who have lost a job. Other individuals who are perceived to have made bad choices – such as school dropouts, people with criminal backgrounds or drug users – may be less likely to receive sympathetic treatment in these discussions. The path to poverty is important, but likely shows that most individuals suffered earlier circumstances that contributed to the outcome.

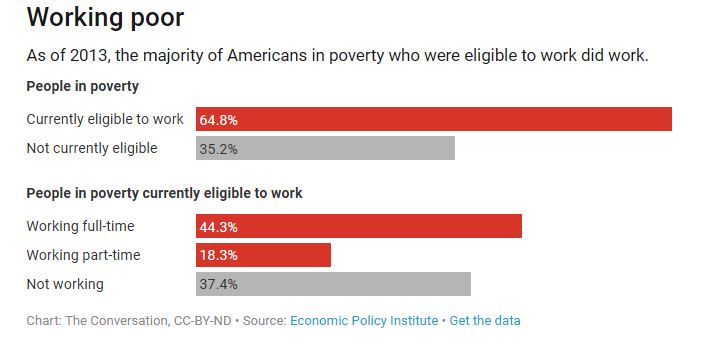
Among the working-age poor in the U.S. (ages 18 to 64), approximately 35 percent are not eligible to work, meaning they are disabled, a student or retired. Among the poor who are eligible to work, fully 63 percent do so.

Earlier this year, lawmakers in the House proposed new work requirements for recipients of SNAP and Medicaid. But this ignores the reality that a large number of the poor who are eligible for benefits are children and would not be expected to work. Sixty-three percent of adults who are eligible for benefits can work and already do. The issue here is more so that these individuals cannot secure and retain full-time employment of a wage sufficient to lift their family from poverty.

A culture of poverty?

The circumstances of poverty limit the odds that someone can escape poverty. Individuals living in poverty or belonging to families in poverty often work but still have limited resources – in regard to employment, housing, health care, education and child care, just to name a few domains.

If a family is surrounded by other households also struggling with poverty, this further exacerbates their circumstances. It’s akin to being a weak swimmer in a pool surrounded by other weak swimmers. The potential for assistance and benefit from those around you further limits your chances of success.

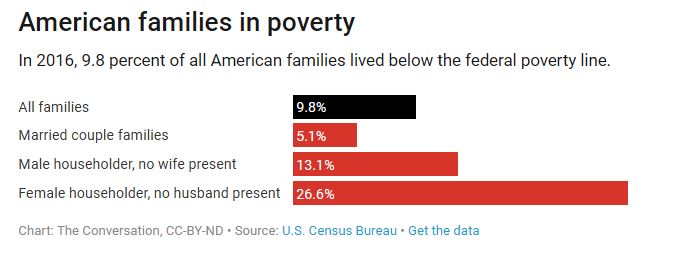
Even the basic reality of family structure feeds into the consideration of poverty. Twenty-seven percent of female-headed households with no other adult live in poverty, dramatically higher than the 5 percent poverty rate of married couple families.

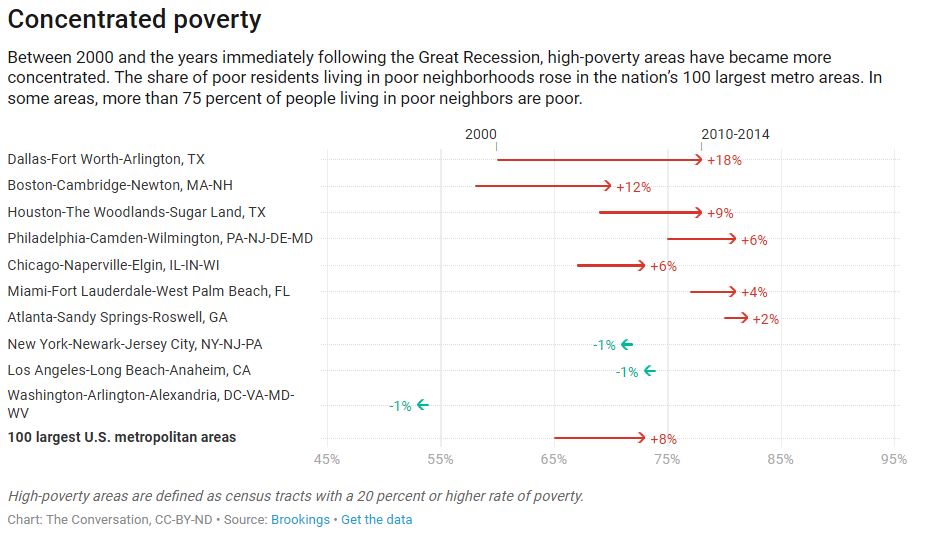
Poverty exists in all areas of the country, but the population living in high-poverty neighborhoods has increased over time. Following the Great Recession, some 14 million people lived in extremely poor neighborhoods, more than twice as many as had done so in 2000. Some areas saw some dramatic growth in their poor populations living in high-poverty areas.

Given the complexity of poverty as a civic issue, decision makers should understand the full range of evidence about the circumstances of the poor. This is especially important before undertaking a major change to the social safety net such as broad-based work requirements for those receiving non-cash assistance.

Author: Robert L. Fischer Co-Director of the Center on Urban Poverty and Community Development, Case Western Reserve University

Booming jobs numbers, but dig deeper and it’s not all rosy

From The Conversation.

The latest labour market data from the Australian Bureau of Statistics provide an instructive lens into the problems facing the federal government, the RBA, and the economy itself.

The number of people employed rose 50,900 from May to June in seasonally adjusted terms, which was well ahead of forecasts of around 16,500. And that wasn’t just a lot of new part-time jobs. Full-time employment rose by 41,200.

On a year-on-year basis that represents an increase in employment of 2.8%.

No doubt Treasurer Scott Morrison will tout these figures as evidence of the government’s focus on “jobs and growth”. Don’t get me wrong: it’s good that employment is going up.

But dig a little deeper and the story is not so rosy.

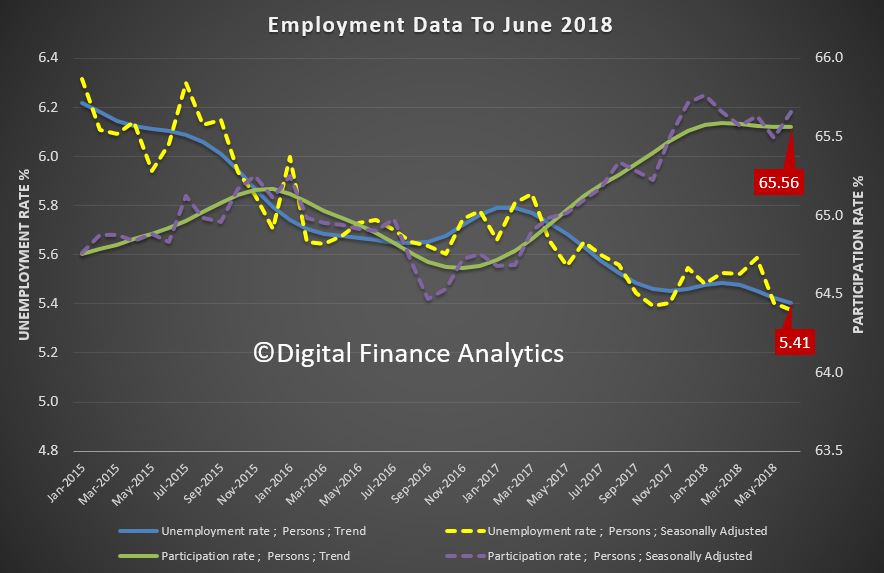
One might think that robust increases in the number of people employed reduce the unemployment rate a lot. Not so. The number of people unemployed fell from 715,200 in May to 714,100 in June.

That, of course, is explained by the so-called participation rate – the proportion of people participating or trying to participate in the paid labour market.

The participation rate rose from 65.5% in May to 65.7% in June, leaving the unemployment rate unchanged at 5.4%.

The Australian labour force participation rate is actually pretty high. A useful comparison is the United States – probably the world’s most robust labour market – where the current rate is 62.9%.

The key point is that if more people are going to come into the labour market when it looks better – as they have been consistently – then a continued reduction in the unemployment rate is going to require creating a whole lot more jobs.

So when the prime minister and treasurer point out what a large number of jobs are being created – 400,000 in 2017 – they are both right and wrong. Yes, 400,000 is a demonstrably large number. But it’s just not enough to get unemployment down.

What about wages?

What the data released Thursday did not reveal was anything about what people are paid. Perhaps the most concerning thing about the Australian labour market is that wages are not growing at anywhere near historic-average levels and this has been going on for several years.

Private-sector wages grew over the last year by 1.9% – the same rate as consumer prices (inflation).

In other words, real wage growth is zero.

Unemployment that seems stuck at around 5.4% and real wages growth that is zero. What to do?

The traditional approach would be for the RBA to cut interest rates – and some commentators still advocate this. There are at least three problems with this approach, however.

First, with the official cash rate at 1.5% there is not a lot of wiggle room. Although it is fair to point out that there is precisely 1.5% of wiggle room.

That bring us to problem two, which is that a further cut in interest rates is likely to fuel property prices and, perhaps more importantly, household debt. The RBA has repeatedly shown concern about this, and with good reason.

Third, and this is more subtle, if the RBA does cut rates much further then they will have nowhere to go in the case of a major economic downturn. That would force them to respond to a major downturn with unconventional measures such as quantitative easing.

Another approach would be for the government to run large deficits – also known as fiscal policy. But here, too, there are significant problems.

We have been running pretty large deficits for some time, which has put our credit rating in jeopardy. True, Australia’s net debt-to-GDP ratio of around 18.9% is low by international standards, but there seems little appetite on either side of politics to run that up further.

The final approach is to reform labour market institutions and make them more flexible – sometimes called “microeconomic reform”. It is plausible that this would have a decent chance of lowering unemployment.

But it would also push Australia closer to a United States-style labour model.

None of these options are without real downsides. And none of them seem likely to appeal to the voting public. That’s why the unemployment rate in Australia is a particularly challenging problem.

Author: Richard Holden Professor of Economics and PLuS Alliance Fellow, UNSW

No presents, please: how gift cards initiate children into the world of ‘credit’

From The Conversation.

Western children have more toys, games and possessions than ever before. And Australia has one of the highest rates of average spending per child on toys. Faced with a glut of children’s toys at home, more and more parents are presenting gift cards in lieu of presents.

Gift cards neatly bridge the risk between giving a tangible present, which might be returned or exchanged, and giving cash, which some cultures consider impersonal.

Children, and often very young children, are themselves asking for gift cards so they can choose their own presents. However, children process information very differently from adults. As a result, giving gift cards to children has implications for how they make consumer-related decisions and how they spend the “credit” a gift card provides.

How do young children decide on a purchase?

Children have a limited ability to process certain types of information. They tend to pay more attention to visual and auditory stimuli rather than textual information. At a very basic level, children are more easily influenced by colour and movement.

In terms of the developmental stages identified by Jean Piaget, children do not reach “formal operations” until around 11 or 12 years of age. Only then do they develop more abstract thinking and the ability to apply logic to all types of problems, including those inherent in purchase decisions and financial transactions. It is generally accepted that children are not “consumer literate” until they reach this stage of development.

There is evidence that children, particularly those under the age of seven, have a limited ability to detect the advertising content in a message. Indeed, they may regard an advertisement as just another type of program. They see advertisements as a type of information service to help people know what to buy and where to buy it.

It’s important to note that many children may not be able to understand the persuasive intent of advertising. To add to the problem, animated and other characters in children’s movies are increasingly merchandised as toys. An array of products, including foods and confectionery, is also being “placed” in movie content.

Depending on their age, children might not be able to discern the selling strategies being used here, nor appreciate that such content is not passive.

Gift cards represent ‘credit’

There are hundreds of different types of gift cards for use in retail stores or online. Popular gift cards for children can be exchanged for music and online games.

Australians spend around A$2.5 billion a year on gift cards. A gift card comes with responsibility for managing the “credit” that it bestows, and for children this is an important consideration. However, almost one-third of consumers (including children) who are gifted a card never actually exchange it for goods or services.

Young children also face the dilemma of overspending or underspending when they redeem the card. Overspending happens when the child selects a product that exceeds the value of the gift card and has to negotiate with their parents or carer to make up the difference, or decide on a different purchase. Conversely, they might select an item that costs less than the amount of the card, and not understand terms and conditions such as non-transference of value or non-cash redemption.

These scenarios can be problematic for adults, let alone children. Research shows that “disclaimers” are not well understood by children. This has implications for how effectively children can manage the notion of “credit”.

Another consideration is the rise in digital gift cards and e-vouchers. Although many young children are digitally literate, the digital format may present additional challenges for young consumers.

Because digital cards are sent electronically to the recipient, or in the case of a young child to their parents, in this situation children do not receive any sort of tangible gift. What impact does this have on nurturing gratitude and appreciation in young children?

Dear Santa

Researchers in the UK looked at the content of children’s letters to Santa and found a link between the amount and type of advertising they were exposed to, as well as their age. Children exposed to more advertising were more likely to include requests for branded items than children who watched less advertising.

Will we see more letters to Santa asking for gift cards? Probably. These cards continue to grow in popularity as gifts for young people, particularly at Christmas.

An Australian Youth Forum survey found some younger Australians are using gift cards in lieu of credit cards. The number of children given access to their parents’ credit cards is also growing. Children as young as eight and nine are being authorised to use credit cards. These young consumers might often not know the difference between a credit card and gift card.

Children do not have the cognitive skills to evaluate the marketing messages for toys and other products with the same scepticism as adults. Nor do they have the maturity to make many of the decisions required for spending the “credit” from gift cards. This makes them a particularly vulnerable group.


Authors: Louise Grimmer Lecturer in Marketing, Tasmanian School of Business and Economics, University of Tasmania; Martin Grimmer Professor of Marketing, Tasmanian School of Business and Economics, University of Tasmania

FactCheck: is Australia’s population the ‘highest growing in the world’?

From The Conversation.

One Nation leader Pauline Hanson has proposed a plebiscite be held in tandem with the next federal election to allow voters to have “a say in the level of migration coming into Australia”.

Hanson has suggested cutting Australia’s Migration Programme cap from the current 190,000 people per year to around 75,000-100,000 per year.

On Sky News, Hanson said Australia is “the highest growing country in the world”.

The senator added that at 1.6%, Australia’s population growth was “double [that of] a lot of other countries”.

Are those statements correct?

Checking the source

In response to The Conversation’s request for sources and comment, a spokesperson for Pauline Hanson said the senator “talks about population growth in the context of our high level of immigration because in recent years, immigration has accounted for around 60% of Australia’s population growth”.

The spokesperson added:

Australian Bureau of Statistics migration data for 2015-16 show that Australians born overseas represent 28% of the population, far higher than comparable countries like Canada (22%), UK (13%) or the US (14%).

World Bank data for 2017 show that Australia’s population growth was 1.6%, much higher than comparable countries with immigration programs like Canada (1.2%), the UK (0.6%) and the US (0.7%).


Verdict

One Nation leader Pauline Hanson was correct to say Australia’s population grew by 1.6% in the year to June 2017. But she was incorrect to say Australia is “the highest growing country in the world”.

According to the most accurate international data, the country with the fastest growing population is Oman, on the Arabian Peninsula.

Senator Hanson said Australia’s 1.6% population growth was “double than a lot of other countries”. It is fair to say that Australia’s population growth rate is double that of many other countries, including the United States (0.7%) and United Kingdom (0.7%), for example.

Since Hanson’s statement, Australia’s population growth rate for the period ending June 2017 has been revised upwards to 1.7%. But Hanson’s number was correct at the time of her statement, and the revision doesn’t change the outcome of this FactCheck.

In terms of the 35 countries in the Organisation for Economic Cooperation and Development (OECD), Luxemberg was the fastest growing country in 2016, with Australia coming in fifth.

Caution must be used when making international population comparisons. It’s important to put the growth rates in the context of the total size, density and demographic makeup of the population, and the economic stage of the country.


How do we calculate population growth?

A country’s population growth, or decline, is determined by the change in the estimated number of residents. Those changes include the number of births and deaths (known as natural increase), and net overseas migration.

In Australia, both temporary and permanent overseas migrants are included in the calculation of population size.

According to Australian Bureau of Statistics data, Australia’s population grew by 1.6% in the year to June 2017 – as Senator Hanson said.

Since Hanson’s statement, Australia’s population growth rate for the period ending June 2017 has been revised upwards to 1.7%. But as said in the verdict, Hanson’s number was correct at the time of her statement, and the revision doesn’t change any of the other outcomes of this FactCheck.

That’s an increase of 407,000 people in a population of 24.6 million.

All states and territories saw positive population growth in the year to June 2017, with Victoria recording the fastest growth rate (2.4%), and South Australia recording the slowest growth rate (0.6%).


Read more: FactCheck: is South Australia’s youth population rising or falling?


Is Australia’s population the ‘highest growing in the world’?

No, it’s not.

There are different ways of reporting population data.

Population projections are statements about future populations based on certain assumptions regarding the future of births, deaths and migration.

Population estimates are statistics based on data from a population for a previous time period. Population estimates provide a more accurate representation of actual dynamics.

World Bank data for 2016 (based on population estimates) provide us with the most accurate international comparison.

According to those data, Australia’s growth rate – 1.5% for 2016 – placed it at 86th in the world. The top 10 ranked countries grew by between 3-5%.

How does Australia’s growth compare to other OECD countries?

Comparison of Australia’s average annual population growth with other OECD countries shows Australia’s rate of population growth is among the highest in the OECD, but not the highest.

This is true whether we look at annual averages for five year bands between 1990 and 2015, or single year data.

Looking again at the World Bank data, Australia’s rate of population growth for 2016, at 1.5%, was double that of many other OECD countries, including the United Kingdom (0.7%) and United States (0.7%).

Permanent vs temporary migration levels

Hanson has proposed a national vote on what she describes as Australia’s “run away rates of immigration”.

The senator has suggested reducing Australia’s Migration Programme cap from the current level of 190,000 people per year to 75-100,000 people per year. The expected intake of 190,000 permanent migrants was not met over the last few years. Permanent migration for 2017-18 has dropped to 162,400 people, due to changes in vetting processes.

The greatest contribution to the growth of the Australian population (63%) currently comes from overseas migration, as Hanson’s office noted in their response to The Conversation.

The origin countries of migrants are becoming more diverse, posing socioeconomic benefits and infrastructure challenges for Australia.

Sometimes people confuse net overseas migration (the total of all people moving in and out of Australia in a certain time frame), with permanent migration (the number of people who come to Australia to live). They are not the same thing.

Net overseas migration includes temporary migration. And net overseas migration is included in population data. This means our population growth reflects our permanent population, plus more.

Temporary migrants are a major contributor to population growth in Australia – in particular, international students.

In the most recent data (2014-15), net temporary migrants numbered just under 132,000, a figure that included just over 77,000 net temporary students.

The international student market is Australia’s third largest export.

Looking back at Australia’s population growth

Population changes track the history of the nation. This includes events like post-war rebuilding – including the baby boom and resettlement of displaced European nationals – to subsequent fluctuations in birth rates, and net overseas migration.

We can see these events reflected in the rates of growth from 1945 to the present.

The rate of population growth in Australia increased markedly in 2007, before peaking at 2.1% in 2009 (after the height of the global financial crisis, in which the Australian economy fared better than many others).

Since 2009, annual population growth has bounced around between a low of 1.4% and a high of 1.8%.

The longer term average for population growth rates since 1947 is 1.6% (the same as it is currently).

Interpreting population numbers

It’s worth remembering that a higher growth rate per annum coming from a lower population base is usually still lower growth in terms of actual numbers of people, when compared to a lower growth rate on a higher population base.

There can also be significant fluctuations in population growth rates from year to year – so we need to use caution when making assessments based on changes in annual rates.

Economic factors, government policies, and special events are just some of the things that can influence year-on-year population movements.

Other factors we should consider when making international comparisons include the:

  • total size of the population
  • population density
  • demographic composition, or age distribution, of the population, and
  • the economic stage of the country (for example, post industrialisation or otherwise).

Any changes to the migration program should be considered alongside the best available research. – Liz Allen


Blind review

The FactCheck is fair and correct.

The statement about Australia’s population growth rate over the year to June 30, 2017, is correct. The preliminary growth rate published by the Australian Bureau of Statistics at the time of Senator Hanson’s statement was 1.60%; the rate was subsequently revised to 1.68%.

It is also true that many developed countries have lower population growth rates than Australia, but some have higher rates. According to United Nations Population Division population estimates, Oman had the fastest growing population between 2014 and 2015 (the latest data available).

With regards to misinterpretations of net overseas migration, it should also be stated that some people think this refers to the number of people migrating to Australia. It is actually immigration minus emigration – the difference between the number arriving and the number leaving. – Tom Wilson

Author: Liz Allen Demographer, ANU Centre for Social Research and Methods, Australian National University; Reviewer
Tom Wilson Principal Research Fellow, Charles Darwin University



Think carefully before buying Bitcoin – and don’t buy the ‘safe haven’ claims

From The Conversation.

The sharp rise and subsequent fall in Bitcoin’s value places it among the greatest market bubbles in history. It has outpaced the 17th-century tulip mania, the South Sea bubble of 1720, and the more recent Japanese asset price and dot-com bubbles.


The rapid price rise garnered attention from an increasing number of academics and investment advisers. Some have suggested that Bitcoin improves portfolio performance and can even be used as a potential “safe haven” asset in place of gold.

Our work finds that much of this research is flawed and overlooks some important attributes that any investor should consider before allocating funds to such a speculative investment.

This is particularly relevant if investing in Bitcoin is rationalised as a prospective safe haven in times of market turmoil.

Hard to value

The first attribute investors consider is how to value Bitcoin. Typically, assets are valued based on the cash flows they produce. Bitcoin lacks this property.

This leads to ongoing debate as to the true value of Bitcoin and other cryptocurrencies. Some, such as the Winklevoss twins and other Bitcoin entrepreneurs, believe the price will soar far higher. Others, including Nobel prize winner Eugene Fama and esteemed investor Warren Buffett, believe the real value is closer to zero. Another Nobel winner, Robert Shiller, suggests the correct answer is “ambiguous”.

There is even wide variation in price across the various Bitcoin exchanges. This is common in fragmented markets and makes it difficult for an investor to find the best market price at any point in time – a process called price discovery.

High price volatility

Bitcoin prices also have a high level of variation (volatility) when compared to other possible investments including bonds, stocks and gold. Even tech stocks such as Twitter, which are considered relatively volatile, are found to have less price variation. This adds to the difficulty investors face when trying to value Bitcoin and any portfolios that contain it.

This is of particular concern given the large daily losses that Bitcoin has experienced in its relatively short life. The largest one-day decline experienced by the popular S&P500 index since 2011 is 4.2%. Bitcoin has had nearly 200 days that were worse (and over 60 days worse than the biggest decline in the gold price of 10.2%).

Put another way, Bitcoin has had 200 days worse than the worst day on the stock market. This hardly seems like an enticing investment for most.

Low liquidity

Investors should also consider the ease with which they are able to buy and sell any assets in which they invest. One method used to measure this liquidity attribute is the bid-ask spread – the difference in the price at which one is able to buy and sell the asset.

More liquid assets have a narrow bid-ask spread. Bitcoin’s bid-ask spread varies from one exchange to another, but in general it is much larger than for other assets.

While bid-ask spreads provide one measure of implicit trading costs, investors also consider the explicit transaction fees they are charged when trading. Transaction fees for trading traditional investments are typically well known and have trended down over time.

While Bitcoin fees have recently declined, they have proven to be highly variable, ranging from over $30 to under $1. The time taken to process a transaction can also be greater than 78 minutes. This is much longer than for stocks or bonds and creates another layer of uncertainty for investors.

Only for the most risk-loving

Bitcoin is harder to value, more volatile, less liquid, and costlier to transact than other assets in normal market conditions. Potential investors should be wary and carefully consider whether such highly speculative assets are appropriate additions to any portfolio.

Given safe havens are typically in demand during financial crisis, when markets are more volatile and less liquid, it is highly unlikely that Bitcoin is even worth considering as a safe-haven asset.

Author: Lee Smales Associate Professor, Finance, University of Western Australia

Restructuring alone won’t clean up the banks’ act

From The Conversation.

Many entrenched motivations for misconduct in the banking sector have been uncovered by the ongoing royal commission. Not least are the conflicts of interest inherent in the major Australian banks providing financial, insurance and mortgage advice and selling related products.

The banks, most recently the Commonwealth Bank (following the lead of ANZ and NAB), are already separating their wealth-management arms – services such as mortgage broking, insurance and financial planning and advice – in a bid to resolve these conflicts of interest.

These restructures are a step in the right direction. But they are not enough to overcome the fundamental problem: the banks’ sales-driven culture. This goes much deeper and seemingly pervades all of their operations, as the royal commission has highlighted.

The nature of this problem lends weight to an Australian Securities and Investments Commission (ASIC) proposal to embed regulatory staff in the major banks to help change the culture.

Bankers’ priorities laid bare

The evidence made public by the forensic analysis of Rowena Orr QC, counsel assisting the commission, has revealed many instances of the banks’ “toxic” culture. It’s one that puts profits and growth – in particular their associated incentive systems – above customers’ interests.

This has been evident from the outset. The first round of hearings in March 2018 revealed allegations of significant cash bribes, forged signatures and manipulation of incentives within NAB’s “Introducer Program”. This generated billions of dollars in home loans for the bank, with introducers paid 0.4-0.6% of home loan totals.

We have had belated “apologies” to customers who were treated unfairly or, worse, fell victim to unscrupulous or wrongful behaviour; admissions that the banks breached their own codes of conduct; and assurances that changes in governance systems aimed at improving culture have been made or will be. Yet the banks are still in denial that systemic cultural issues have been at play or persist in their organisations.

A stark example is provided in the evidence of Rabobank executive Bradley James at the most recent hearings that dealt with issues of farming finance. Orr questioned James about a A$3 million loan made on the advice of a manager of this rural lender to a Queensland grazing family, the Brauers. They had no ability to repay it. The motivation for the manager was to meet his lending KPIs to earn a bonus.

Asked whether he saw any difficulty with that from a customer perspective, James’s response was: “Absolutely not!” This shows a complete failure to understand the bank’s incentive structure – linking staff bonuses to the number of loans brought in – and the culture that goes with it as a potential source of misconduct.

James defended the bank’s system, saying it enabled the business to grow. This demonstrates that, in putting profits and growth ahead of customers’ needs, banking culture is out of touch with community expectations and societal values.

Regulators must step in

Little wonder, then, that trust in the financial sector is at an all-time low. ASIC chair James Shipton speaks of a “trust deficit”.

Shipton is seeking government funding to embed specialist ASIC supervisors in the major banks to help drive cultural change and rebuild trust. This should be done, signalling as it does a new, more intrusive regulatory style.

However, ASIC should do more. It needs to take enforcement action. Most notably this would include prosecution in cases of criminal wrongdoing by the banks and their top executives. The latter have been conspicuously absent at the royal commission, raising important questions about bank accountability.

Another corporate regulator, the Australian Competition and Consumer Commission (ACCC), last month brought criminal proceedings against ANZ and several other companies and individuals over an alleged cartel arrangement. Commentator Nathan Lynch observed that, irrespective of the outcome, one message reverberates: senior management accountability:

Governments and regulators have had enough of financial services firms that are still talking about improving culture and conduct. A decade on from the financial crisis … they now want to see a healthy dose of fear and respect in the market.

Lynch quotes strategic consultant Ben Quinlan:

Regulators are now at the point where they’re saying, ‘It’s impossible for things of this magnitude to happen without the people right at the top knowing what was going on.’

If ASIC also took such action, it would go a long way to overcoming concerns about an accountability deficit for the scandals and wrongdoing. This could be a catalyst for real cultural change in the industry to reduce misconduct in the future.


Why isn’t restructuring enough?

As for the current bank restructures, certain aspects are problematic.

In the first place, not all will result in a full separation of their businesses. The CBA will split off its wealth management, mortgage broking and insurance businesses, but retain its financial advice business. ANZ has sold its wealth management business to IOOF, but will not sell its life insurance business.

In addition, the banks remain keen to distribute products to retail customers. For example, ANZ’s sale to IOOF includes a 20-year deal to make IOOF super and investment products available to its retail customers.

These moves raise concerns that, despite these demergers, conflicts of interest and the banks’ failure to act in customers’ interests will continue.

At a minimum, Shipton’s plan to put ASIC agents in banks is more important than ever when the indications are that the banks cannot be left to self-regulate.

Author: Vicky Comino Lecturer in Corporations Law and Regulation of Corporate Misconduct, The University of Queensland

FactCheck Q&A: did the Coalition ‘deliver more than a million jobs in the last year’?

From The Conversation.

On Q&A, Liberal MP Sarah Henderson made the case for company tax cuts, saying the Coalition government’s “focus on backing business” was paying dividends.

“We are seeing a renewed sense of confidence because of our focus on backing business – small, medium and large – giving them the incentive to grow, to invest and to employ more people.”

Henderson said the Coalition had “delivered more than a million jobs in the last year, and 65,000 or so new businesses have started up”.

The member for Corangamite added that “in Labor’s last year, 61,000 businesses closed”.

Are those numbers correct?

Checking the source

In response to The Conversation’s request for sources, Henderson pointed to Australian Bureau of Statistics Counts of Australian Businesses data that show:

  • an increase of 66,755 businesses in the 2016-17 financial year, and
  • a decrease of 61,614 businesses in the 2012-13 financial year (the last financial year of the Labor government).

Regarding the employment figures, Henderson told The Conversation she had made an error, and had meant to say that more than one million jobs had been created over nearly five years.


Verdict

Liberal MP Sarah Henderson’s statement that the Coalition government “delivered more than a million jobs in the last year” was incorrect.

As Henderson noted in her response to The Conversation, growth in employment of “more than a million jobs” took place over more than four years.

Depending on which interpretation of “last year” we use – whether financial, calendar or year-to-date – the growth in the number of people employed was between 251,500 and 383,000.

In terms of whether the Coalition “delivered” these jobs, it’s important to remember that government policy is only one of many factors that determine employment dynamics. Changes in employment levels are never solely due to the efforts of any one government.

Regarding the numbers of businesses opening and closing, Henderson was correct.

In 2016-17 (the last financial year for which data are available), the total number of businesses in Australia increased by 66,755.

In the last financial year of the Labor government (2012-13), the total number of businesses decreased by 61,614.

It appears that the annual balance between business entrants and exits is correlated with the economic cycle.


Did the Coalition deliver ‘more than a million jobs in the last year’?

No.

As Henderson noted in her response to The Conversation, this statement was incorrect.

The growth in the number of people employed in “the last year” was between 251,500 and 383,000, depending on which interpretation of “last year” we use – whether financial year, calendar year or year-to-date.

The latest available employment data are the Australian Bureau of Statistics Labour Force figures ending in May 2018.

The labour force survey includes three different series of employment data: original, trend, and seasonally adjusted.

The “original” series simply counts how many people are employed at any given time.

The “seasonally adjusted” series adjusts the original series to account for regular fluctuations in employment due to the calendar or seasonal pattern of certain economic activities – for example, tourism.

The “trend” component tells the story of the underlying, longer-term dynamics of employment by smoothing out the peaks and troughs due to short-term fluctuations in economic activity.

Any of the three measures can be used, but trend or seasonally adjusted employment are typically more relevant when it comes to economic policy-making. So in this FactCheck, I’ll look at the trend data.

These show that for the 12 months from June 2017 to the end of May 2018, the number of people employed in Australia increased by 277,300.

If we look at the last financial year for which we have complete data, ending June 2017, trend employment increased by 251,500 people.

And if we look at the last completed calendar year – 2017 – then the increase in employment amounts to 383,000.

To count “more than a million jobs”, we need to look back around four or five years.

Trend employment data show an increase of one million people employed between June 2014 and May 2018, and looking a little further back, between September 2011 and June 2017.

In terms of whether the Coalition “delivered” these jobs, it’s important to remember that government policy is only one of many factors that determine employment dynamics in a given period of time. Changes in employment levels are never solely due to the efforts of any one government.

Other factors that influence employment levels include (and are certainly not limited to):

  • federal policies
  • economic conditions in trading partner countries
  • changes in the international price of commodities, and
  • variations in the level of the interest rate and/or the exchange rate.

It’s difficult to establish with certainty the relative contribution to employment growth of each of these factors.

How many businesses started and closed?

To test these claims, we can look to the Australian Bureau of Statistics Business Register. The register provides a count of actively trading Australian businesses, excluding those with turnover below $75,000 that have not registered for GST.

In the 2016-17 financial year – the last full year of data under this Coalition government – 328,205 new business were registered and 261,450 existing businesses were closed.

This leaves us with a net increase of 66,755 businesses – in line with the “65,000 or so” quoted by Henderson.

Labor’s last term in government ended in September 2013. In the 2012-13 financial year, 239,229 new businesses were registered and 300,843 existing businesses were closed.

The net balance was a loss of 61,614 businesses. Again, this figure is in line with Henderson’s statement.

The annual turnover rate (the sum of exits and entries in proportion to total business) between 2007 and 2017 was around 30%.

It appears that that the annual balance between business entrants and exits is correlated with the economic cycle. That is – the more severe economic contractions are associated with higher exits, and lower entries. – Fabrizio Carmignani


Blind review

The conclusions in this FactCheck are correct.

I would have used employment changes from the same month in the previous year.

The practice of politicians to claim that they have “delivered” the change in total employment over a period is erroneous.

Isolating the contribution of government policy to employment growth is a much more complex exercise. – Tim Robinson

Fabrizio Carmignani Professor, Griffith Business School, Griffith University;
Reviewer: Tim Robinson Research Fellow, Melbourne Institute, University of Melbourne


Royal commission scandals are the result of poor financial regulation, not literacy

From The Conversation.

Thousands of Aboriginal people were sold unsuitable financial products and vulnerable consumers are targeted by instant cash loan machines because the financial landscape supports predatory practices.

And insurance agents were able to exploit and target Aboriginal people because the industry isn’t fully regulated.

The cultural, economic and political arrangements that allow this to happen are called “practice architectures”. They include the complex language used to deceive consumers into buying unsuitable products, incentivised high pressures sales tactics, and a lack of care and concern for vulnerable consumers.

All of these aspects are within the scope of financial regulators. The funeral insurance industry can push dodgy products because no one is watching. Predatory financial practices will continue until governments and/or regulators do something about it.

Changing exploitative and predatory financial practices

To change predatory financial practices requires regulatory action to constrain the ability to exploit vulnerable consumers. Educating consumers about predatory financial practices and fostering critical thinking skills is also needed.

But financial literacy education alone is not enough when deliberate deception in financial products and services is permitted.

Research shows Indigenous Australians are too trusting in the role of government to regulate financial matters and can fall prey to predatory lenders. For example, the researchers found there was a belief the Australian Securities Investment Commission would check the accuracy of all prospectuses and that personal loan interest rates are legislated.

To ensure vulnerable consumers are protected requires a lot more than financial education. It requires regulation.

Earlier this year the royal commission revealed, among other things, mortgage brokers were paid a commission based on the size and duration of the loans they issued.

This meant an applicant going to a broker was more likely to end up with a larger mortgage over a longer term than one who dealt directly with their bank, a finding that was revealed in a review of the industry.

Consumers best interest must put be above those of the agents when it comes to insurance products and mortgages.

Much like how certified financial planners are now mandated under the corporations act to work in the best interest of their clients.

The royal commission has also revealed funeral insurance agents gave the appearance of being an Aboriginal organisation, while deliberating exploiting Aboriginal people.

Fixing the problem requires the Australian Securities Investment Commission to change the predatory financial practices so the financial landscape can operate ethically.

In the case of mortgage brokers, exploitative practices were encouraged based on the way brokers are remunerated. So how brokers are remunerated has been changed to align with the best interest of the client.

Selling insurance similarly has a number of cultural, social and financial elements that can be acted upon. There are the cultural aspects of what it means to be a broker, the economic incentives to push clients towards certain products, and social elements that encourage agents to put their own needs ahead of those wanting insurance to protect and cover their loved ones.

Together, these arrangements form practice architectures which make it possible to constrain the practices used in mortgage broking and the insurance industry. Different practice architectures are required to make possible other, non-predatory, methods of mortgage-broking and selling insurance.

Once what it means to be an ethical mortgage broker or an ethical funeral insurance agent becomes the norm, then the social and cultural concern for others’ well-being may be realised.

Predatory financial practices will not go away without effective regulation. The finance and insurance industry needs more effective regulation that forces higher ethical standards to be met in order to establish new financial practices.

This change can begin by asking whether the financial practices that have already been exposed are rational, reasonable, productive, sustainable, socially just or inclusive. And since they aren’t, what action can be taken to change the unjust financial practices? More and better regulation to protect consumers.

Author: Levon Ellen Blue Lecturer, Queensland University of Technology

Royal commission shows bank lenders don’t ‘get’ farming, and rural economies pay the price

From The Conversation.

The Financial Services Royal Commission has exposed the fraught relationship between farmers and financiers. We have heard about loan terms being changed without notice or consultation, loans revalued to suit the agendas of financiers, and heartless and harsh treatment of farmers once the loans are revoked.

A number of factors have contributed to this, including instability in the market value of farms, policy changes that make farms more reliant on financial instruments, and shifts in the global positioning of farm land relative to other forms of property.

The commission has heard that local lending brokers were not qualified to value farm properties, and that farm valuations have become fluid and unpredictable.

Sometimes farms and farmland were deliberately overvalued. Higher values enable farmers to borrow more money for farm improvements, and the local lending branch manager to earn higher commissions.

Not only do the central administrators in banks lack the information and expertise to question these assessments, their business models have encouraged overvaluation and overborrowing as a means to grow their businesses.

Across the Murray Darling Basin banks have taken the separation of water from land – a precursor to the marketisation of water – as a cue to devalue land.

This has provided a reason to void existing loan agreements and to offer refinancing under more arduous conditions. Farmers have no option to refuse, and so borrow with the expectation that a couple of good years will put them back on track.

And if the good years don’t materialise, farms fall into financial stress.

This confronts a third issue, which is that in the bad years farms are harder to sell so their market value plummets. This compounds the problem.

Farmers are more reliant on banks

Policy changes have made farms more reliant on banks.

Since Australia adopted open-market policies in the 1980s and agricultural markets have become global, farmers have been exposed to global price changes.

The removal of single-desk marketing boards like the Australian Wheat Board, which protected farms from price fluctuations, increases the impact of price changes. Farmers are now expected to purchase financial products to reduce the risk of this volatility.

Drought assistance has also been reoriented to rely on market-based instruments, such as loans from banks rather than grants from governments. In the wake of the deregulation of the financial system, and the post-financial crisis consolidation of the farm lending sector, many farm-specific loan products have disappeared. So banks tend to treat farms as businesses like any other.

The open-market policies also create an imperative to expand landholdings (“get big or get out”) and to invest in the latest equipment and technologies. Since this requires borrowing, it thrusts farmers onto a credit treadmill.

Of course, low interest rates have also stimulated borrowing for farm expansion.

Increasing corporate control of farm inputs (seeds, fertiliser etc.) and outputs is squeezing farmers’ capacity to earn enough to service their loans.

To make matters worse, the declining terms of trade impel farmers to increase productivity just to stand still.

The farmers before the royal commission have mostly managed to stay on the treadmill, but only until the banks’ rule changes cranked up the speed to throw them off.

It’s clear that despite their crucial role, many banks still don’t really “get” the vagaries of farming. They don’t understand how different farm lending is – or should be – to commercial and housing lending. Neither do they seem to appreciate the broader social and economic dimensions of the role they have in managing farm risks.

Dramatic revisions to land valuations, as discussed in numerous cases described in the commission, can undermine an entire farming region’s equity.

The accelerated thinning out of the farming population impacts on local economies and sporting teams, among others. In the lead-up to and during the whole process of deregulation, farmers were continually reassured – in reports by the Productivity Commission, for example – that the credit market would evolve to meet their needs.

The evidence that the commission has heard in many respects represents a case of market – and regulatory – failure.

Since the global financial crisis, farm land has become an attractive investment for wealthy families and institutional investors, and for governments worried about food security.

As this pushes up land values, banks can be more aggressive towards failing farms. Foreclosures free up land for deep-pocketed investors.

It would be a mistake, then, to conclude that the stories coming out of the commission are an isolated issue relating to the one bank’s heavy-handed mopping up after the failure of a specialised rural lender – as was the case with ANZ and Landmark.

On the contrary, there are many stories of different banks imposing financial risk frameworks on farmers that are ill-equipped to accommodate the vagaries of farming production and pricing.

When farmers jest about being owned by the banks, they aren’t joking.

We should ask why the government took so long to acknowledge the problems of rural finance and the effects on farming communities.


After the commission concludes, it is likely that banks and regulators will tighten the risk parameters on farm lending and make it harder for smaller family farmers to access finance.

Vulnerable farms will not be able to borrow as much money as in the past. This might be prudent from a financial risk perspective.

However, if city bankers don’t understand farming and don’t make allowances for the volatile and uncertain economies of farming, there’s still no guarantee that tighter rules will translate into better decisions and more positive outcomes.

Rather, tighter rules are likely to have uneven consequences, further disadvantaging smaller family farms relative to deep-pocketed agribusinesses. So, in effect, restricting credit is likely to accelerate the transfer of farmland from family farms to more corporate entities including transnational corporations.

Author: Sally Weller Reader, Australian Catholic University; Neil Argent Professor of Rural Geography, University of New England