Superannuation is still mired in the same old issues

From The Conversation.

The Productivity Commission’s latest report on superannuation asks whether the current system is working for members – and answers firmly in the negative.

The report identifies four factors that can chip away at super fund members’ retirement benefits:

What is also clear from the evidence laid out in the report that the not-for-profit sector, including industry super funds, generally outperforms the retail sector. Generally they offer lower fees and higher returns, although there are some industry funds that rank among the lowest-performing.

Despite recent reforms such as the 2013 launch of MySuper, the superannuation system is still beset with the same problems of rising fees and patchy performance. And there is still no substitute for just hopping on the internet and proactively checking that your super is in the best possible hands.

The situation is made complex by the highly segmented nature of Australia’s superannuation system. Besides the public sector funds, the most significant sectors are the retail sector and the not-for-profit funds, including industry funds (see figure 1.5 here). These sectors compete for as large a slice as possible of the overall pool.

Self-managed superannuation funds are also a rapidly growing sector of the market, however the regulatory framework applied to these funds has some significant differences to the rest of the market.

Tracking your super

Most employees have the right to choose their superannuation fund (although around one million don’t), and if they don’t nominate a fund, employers will pay contributions into a default fund.

As the new report points out (see figure 1.2 here), up to 40% of superannuation members hold multiple super accounts. In some cases this may be a deliberate choice – someone with a self-managed super fund may might, for example, choose to have their employer contributions paid into a conventional fund. But often multiple funds are a consequence of employees being enrolled into a new default fund instead of paying contributions into an existing fund.

A range of tools is now available to help people consolidate their super, so as not to lose any of their savings. In the 2018 federal budget the government announced that it would reduce the paperwork involved in this process by allowing the Australian Taxation Office to consolidate inactive super accounts with balances less than A$6,000.

MySuper

The primary aim of MySuper, introduced in 2013, was to provide a simple default product that meets the needs of members who are not engaged with their superannuation. They have no entry fees, offer simpler insurance and services, and lower administration fees that are charged on a cost-recovery basis.

But although the effects of MySuper are generally positive, the 2013 reforms may also have contributed to the erosion of funds identified by the new review.

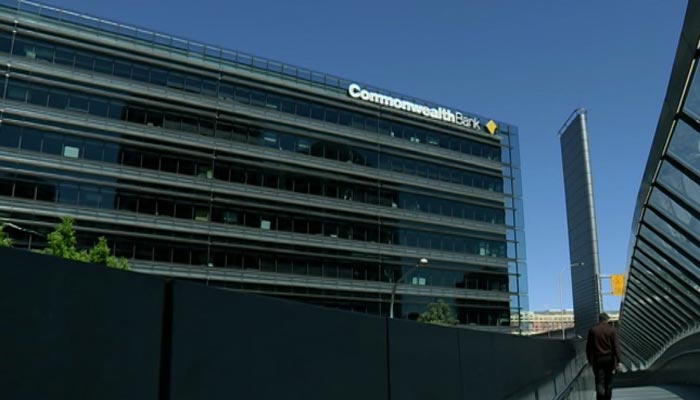
This report confirms (see chapter 3, p.127 here) that super fund fees in Australia are among the highest in the OECD, and the upward pressure on fees continues. Just this month, the Commonwealth Bank announced that it would pass the costs of regulation onto some superannuation products.

One of the consequences of introducing the fee charging limitations for MySuper accounts was that the previous member protection standards that limited fees on low-balance accounts was repealed. In the 2018 federal budget the government announced that fees would be capped in respect of certain low balance accounts.

MySuper products must provide also life insurance on an opt-out basis. Insurance in superannuation has also been under scrutiny, with inappropriate or junk policies being included in superannuation. The government has announced proposals to change this to an opt-in system.

This report adds to the evidence that overall the current structure of not-for-profit funds is serving members well. Although it supports proposals to require the trustees of industry funds to increase the number of independent directors, the Productivity Commission highlights the need for a stronger focus on trustee skills and addressing conflicts of interest.

Take responsibility for your super

It is concerning that many of the problems identified by the new report are the same ones that arose in the 2014 Financial System Inquiry, the 2015 Cooper Review, and in the evidence to the Financial Services Royal Commission.

Most of these issues raised have been part of the discussion for the past decade. The fact that they are still on the table shows a level of inertia in the system, and a reluctance by the industry to address its problems.

So how can we, as individuals, protect our retirement nest egg? The key is to engage with the superannuation system, and not just as we approach retirement.

Compare your super fund’s fees and returns with those of the best performing funds, and then choose accordingly. Reduce your fees and insurance premiums by consolidating your accounts, and make sure that any insurance in the fund meets your needs.

The difference at retirement is worth it – up to A$407,000 for a 21-year-old by the time they finish their career.


Author: Helen Hodgson, Associate Professor, Curtin Law School and Curtin Business School, Curtin University

Evidence from the banking royal commission looks like history repeating itself

From The Conversation.

Do banks learn from the past? From watching the questioning of elderly disability pensioner Carolyn Flanagan at the Financial Services Royal Commission, it seems not.

In the High Court of Australia on May 12 1983, one case tested the limits of a concept called “unconscionability”. This is a difficult area of law to prove, as the parties involved usually have signed a commercial agreement.

You are normally legally bound by what you sign, in the form of a contract. This was established in an English case in 1934 called L’Estrange v F Graucob Ltd and has been since followed in UK and Australian law.

However, sometimes the law intervenes because the party signing the contract is at such a disadvantage that it is inequitable in the eyes of the court.

The 1983 case involved Mr and Mrs Amadio, who were Italian migrant parents. A bank manager went to their home and asked them to sign a mortgage (secured against their family home) for their son to open a business. No one explained that the son did not have the experience to run a business and that the outcome of not paying back the loan was to lose their home.

The Amadio family did not speak much English and no one provided a translator nor independent legal advice. The mortgage documents were signed on March 25 1977. The son soon failed to make repayments and the Commercial Bank of Australia, foreclosed on the parents’ property (the family home).

The High Court ruled in May 1983 that the bank had acted unconscionably and that the contract should be terminated on equitable grounds.

Over 30 years later, Westpac Bank is signing a guarantee for a daughter’s business loan, with an elderly and partially blind mother. As Commissioner Hayne noted, Ms Flanagan had signed the documents but not understood them or their consequences. The commissioner was unimpressed with any “independent advice” supposedly provided to the parties.

Westpac tried to regain the property as per the financial guarantee and did reach a settlement that Ms Flanagan could stay in the home until she sold it or passed away. This sounds very similar in law and facts to the Amadio decision.

The original unconscionable case of Amadio, was based on the law of equity (a branch of case law, based on concepts of fairness). This compares to federal and state government laws such as the Trade Practices Act 1974, which the Australian Consumer Law replaced in 2010. Section 20 of this law preserves the concepts of unconscionability under the “unwritten law” (a way of saying common laws and equitable laws).

More significantly, an unconscionable conduct laws were introduced to cover the provision of goods and services under the Commonwealth law in section 21 of Australian Consumer Law.

The government regulator that enforces such laws is the Australian Competition and Consumer Commission (ACCC). Unfortunately, as with many things, the law is more complex and if financial services are involved, then the Australian Securities and Investments Commission (ASIC) also gets involved.

ASIC in its own legislation covers unconscionable conduct and misleading conduct. There are also other agencies that can have jurisdiction to investigate and bring legal actions as necessary, such as State Consumer Affairs Commissions or Small Business Commissions.

Unfortunately this appears not to have helped Carolyn Flanagan and many others who made submissions to the royal commission.

This is another great example of how we in Australia can have plenty of laws and regulations, but the real questions: are the laws actually enforced and do we ever learn lessons from history?

Author: Michael Adams, Dean, School of Law, Western Sydney University

Housing costs are actually the same as in 1993, but renters still struggle

From The Conversation.

Even though house prices have risen substantially over recent decades, housing costs as a share of income have barely shifted in over 20 years. Costs relative to disposable income for housing are largely unchanged, at 17% since 1993, although there has been some increase since 2000.

There is no agreed measure for defining housing affordability, but just looking at house prices can be deceptive. Australian households are roughly equally split between purchasing, renting or owning their house outright.

There is no doubt that house prices increased substantially over recent decades. According to CoreLogic over the past 20 years the median house price in Australia increased from A$140,000 in December 1997 to A$540,000 by December 2017 – an annual increase of 7%. Relative to disposable income this represents a 68% increase over the 20-year period.

Australian households are roughly equally split between purchasing, renting or owning their house outright. Highly inflated house prices are more concerning to people wishing to move from renting to purchasing a house (mostly potential first home buyers).

Housing affordability looks very different when we look at actual housing costs relative to income, rather than just house prices. Housing costs increased substantially between 1984 and 1993.

This was a combination of weak income growth and strong increases in housing costs, particularly mortgages with interest rates increasing sharply over this period. Since peaking in 1993 costs remained relatively stable with rents increasing modestly over the past 10 years, while mortgage costs declined.

Overall, actual housing costs relative to income have remained stable since 1993 at around 16% of disposable income.

We split households into five equal groups from lowest 20% of disposable income up to highest 20%, after adjusting for type of family and household size. Clearly, low-income households spend a lot more on housing relative to their income than higher-income households. The share of housing costs for the lowest income quintile has increased in recent years but is not substantially different from longer term averages.

All other income groups have increased their share of spending relative to income since 1984. Since 1993 the changes have been mixed with the lowest income households and highest income households both spending less as a share of income, while the middle income categories have increased their spending, albeit modestly.

Housing was much more affordable in 1984 with average housing costs at just 11.3% of disposable income.

A number of important changes have occurred over the past 25 years. Interest rates are much lower, living standards have increased substantially for low, middle and high income families and savings rates have also increased – implying that housing costs are increasingly a larger share of expenditure.

Another common measure of housing affordability is housing stress. We use the “30/40” stress rule – a household paying more than 30% of their disposable income on housing costs and also in the bottom 40% of the income distribution.

Using this housing stress measure, we see a significant increase in renter stress, firstly between 1984 and 1993 and then from 2007. Mortgage stress is largely unchanged since 1988 following an increase between 1984 and 1988.

Housing stress rates are similar for major states. The highest rate is in Queensland with 13.5% of households in stress whereas the combined ACT and NT region has the lowest stress rate at 8.1%, thanks to relatively high incomes. The NSW rate is lower than both Victoria and Queensland.

Home ownership rates in Australia have slowly declined since 1984 from around 72% to around 68% by 2015-16. Ownership rates of households headed by people aged under 35 dropped from 50% in the 1980s to around 35% in 2015-16. Households headed by people aged 35 to 49 have experienced a similar percentage point decline but from a higher base.

The downward trend in ownership rates for younger households has been ongoing since 1988. Surprisingly, the house price boom between 1999 and 2005 in Australia does not appear to have made a significant difference to pre-existing trends.

However, home ownership trends are complex, and are likely driven by a range of factors such as interest rates, higher rents in the 1980s, broader societal changes such as people marrying and having children later in life and a higher divorce rates. Another possibility is a shift away from home ownership, with younger people preferring the flexibility that renting offers.

Overall, housing costs in Australia have been relatively stable as a share of disposable income since the early 1990s. This average does mask problems for low-income renters who are paying an increasing share of their income on housing costs, and rent stress levels have also increased over the long term.

Changed economic circumstances provide risks for housing affordability. Were interest rates or unemployment to increase sharply there would be risks to households and flow on effects to the broader economy.

House prices have indeed increased sharply since the late 1990s, well above incomes or inflation. This poses a problem for those wishing to move from the rental market to owning a home as higher house prices imply larger deposits.

While elevated house prices are a concern, the more pressing social problem for Australia remains the lack of affordable rental housing for lower-income families that is close to jobs and services in our capital cities. This has been an ongoing problem in Australia for a number of decades. An ageing population with potentially lower home ownership rates will add to this problem in future years

Author: Ben Phillips, Associate Professor, Centre for Social Research and Methods, Australian National University

Airbnb: who’s in, who’s out, and what this tells us about rental impacts in Sydney and Melbourne

From The Conversation.

The rapid growth of the giant online accommodation-sharing platform, aka Airbnb, is creating serious concerns about equity and the impacts on our cities and neighbourhoods as we know them. Our recent research shows that the patterns of Airbnb listings in Australia’s biggest cities are highly uneven. The findings suggest impacts on rental housing are likely to be biggest in high-end areas that appeal to tourists. Low-income areas are less affected.

Our research – focusing on the Sydney and Melbourne metropolitan regions – looked into three important questions:

  • Where are the listings?
  • Who is hosting Airbnb?
  • What are the impacts on rental markets?

Where are Airbnb listings located?

The maps below show the distribution of Airbnb offerings in the Sydney and Melbourne metropolitan regions. These also show the composition of listings: entire (house/apartment, shown in red) versus partial (room only or shared room, in blue).

In Sydney (shown above), Airbnb offerings are mostly concentrated in popular tourist areas. Interestingly, partial house/apartment listings spread out more to the middle and fringe suburbs. Entire house/apartment listings are more concentrated around the city centre and eastern beaches.

We see a similar pattern in Melbourne (above). Airbnb listings aggregate around the city centre but also extend beyond the inner core to the residential outskirts. However, the composition of listings (entire versus partial) has less effect on their distribution in Melbourne than in Sydney.

Interestingly, the cities have very different Airbnb market sizes. The populations of the two regions are almost on a par, but Sydney has almost twice as many Airbnb listings as Melbourne. The difference in entire house/apartment listings is even greater.

Who is hosting Airbnb?

To understand who is participating on the Airbnb platform as host and who is not, we analysed Airbnb listings data against the Australian Bureau of Statistics Census-based SEIFA, the most widely used nationwide measure of socioeconomic status.

SEIFA is a suite of four summary measures created from Census information. For each index, every geographic area is given a SEIFA score. This shows how that area compares with others in Australia.

All areas are ordered from lowest to highest SEIFA score. This ranges from the lowest 10% of areas, which are given a score of 1, up to the highest 10%, with a score of 10.

Our analysis showed the sheer scale of inequity of Airbnb listings distribution. Over 95% of all entire house/apartment listings and about 87% of partial house/apartment listings (room only or shared room) in Sydney are in the socio-economically best-off areas (SEIFA deciles 9 and 10).

Airbnb offerings in Melbourne follow a similar pattern. Over 80% of entire house/apartment listings and about 70% of partial house/apartment listings are found in the best-off areas.

Our data analysis establishes that Airbnb hosting mainly occurs in the most affluent pockets of both regions.

What are the impacts on the rental market?

We also looked at the ratio of the size of the rental market to the size of Airbnb listings with specific attention to the socioeconomic status (using SEIFA) of each local government area in Melbourne and Sydney. This produced a few interesting observations, which help illustrate how local long term rental housing stock is, or could be, lost by conversion to Airbnb short-term listings.

In Sydney, there are no low socio-economic areas (SEIFA scores of 1-5) with high numbers of rental dwellings that also have high numbers of entire house/apartment Airbnb listings. This means that, to date, Airbnb is not displacing the rental stock in the most disadvantaged pockets of the Sydney metropolitan region.

Nevertheless, in a small number of high socio-economic areas (SEIFA scores of 8-10), the Airbnb market (entire listing only) represents sizeable proportions of the rental market. For the beachside location of Waverley (decile 10), for example, the number of Airbnb entire listings is almost equivalent to a quarter of the number of rental dwellings. Similarly, in Manly and Pittwater (both 10), Airbnb entire home listings are about 20% of the rental market size.

In other words, considering the very small size of Airbnb in comparison to the total rental market in Sydney – less than 3.5% – the overall impact can be expected to be minimal. However, the impact is not equally distributed, either geographically or socio-economically.

Indeed, the impact of Airbnb on the rental market is of concern in a limited number of areas in Sydney, mainly strategic tourism locations such as beachside areas. Although these are at the highest end of socio-economic spectrum, there is a danger of some local residents being pushed out of the most sought-after areas so tourists can move in.

The pattern in Melbourne is slightly different or, in a sense, less intense than in Sydney. Again, the general trend of high Airbnb listings in high socio-economic areas is observed.

The Melbourne CBD, which has a SEIFA score of 8, has the most Airbnb entire house/apartment listings. These listings represent the highest proportion, about 8%, when compared to the size of the local rental market. The pressure on the rental market, then, is far less than what we see in popular Airbnb spots in Sydney, such as Waverley, Manly and Pittwater.

We also see in Melbourne that popular rental areas in lower SEIFA areas have low numbers of entire house/apartment Airbnb listings. This confirms the Sydney hypothesis that the loss of rental supply is not yet a major concern at the lower end of the rental market.

The patterns we observed suggest that the pressure Airbnb puts on the rental market – at least at this point of time – is limited to a small number of high-end areas, mainly locations that are attractive to tourists. This represents a concern in terms of rental supply in these areas, where some local residents in the long-term rental market might be losing out to the short-term tourism market.

Authors: Tooran Alizadeh, Senior Lecturer, Director of Urban Design, University of Sydney; Reza Farid, Adjunct Research Fellow, Griffith University; Somwrita Sarkar, Senior Lecturer in Design and Computation, University of Sydney

More Regulation Wont Solve Banking’s Ethical Issues

From The Conversation.

The Financial Services Royal Commission hearings are illustrating both the weaknesses of human nature and of the culture and structure of the financial sector – regulated and regulator. The response to this has been more regulation and codes of conduct.

But we should also be considering our own ethics.

The time-honoured approach to removing ethical temptations to greed is to prohibit conflicts of interest. This goes way back beyond 1896, when the argument was made in a famous court judgment that “human nature being what it is, there is danger … of the person holding a fiduciary position being swayed by interest rather than by duty”.

Both superannuation and corporate law assume that conflicts of interest will persist, and that simple disclosure is enough to manage the problem.

But simple disclosure hasn’t been enough. The royal commission has unearthed many examples of banks and financial services companies both making and selling financial products to their customers, with the latter frequently suffering in the aftermath.

We are already moving away from the payment of commissions for personal financial advice, in favour of fees. But we need to go further. Europe is leading the way as it now forces banks and brokers to explicitly charge for the investment research they produce. We need to remove all conflicts of interests.

Flattening hierarchies and reducing temptations to arrogance

There are other time-honoured approaches to overcoming the temptation to arrogance. The power of leaders needs to be limited.

One organisational principle is subsidiarity, which calls for devolving power to the lowest level where it can be effective. The steep hierarchies of organisations in English-speaking countries create huge jumps in power at higher levels.

Boards need to act on this problem, but regulation could help by ensuring that independent directors have independent power bases and are less beholden to CEOs. If the CEO invites someone to sit on the board, for instance, it is extraordinarily difficult for that person to turn around and tell the CEO: “You are paid too much.”

Many European countries give seats on their boards to union representatives. This may go some way to explaining why executive remuneration is not nearly as steep in those countries.

Some companies in the United States have experimented with proportional representation of shareholders. This would mean that different directors can rely on support from different groups of shareholders.

The new Banking Executive Accountability Regime links pay to performance, but fails to address excessive levels of remuneration in the financial sector.

Codes of ethics and less regulation

We cannot remove all temptations, so we also have to try to provide people with more ways to resist them. One of these is an appropriate code of conduct: actively subscribing to a code of conduct has been shown to make people more likely to behave virtuously.

The Bankers’ Oath should be encouraged; maybe even made compulsory like the proposed financial advisers’ code.

While codes of conduct may help, the tsunami of financial regulation over the past few decades has swept aside much of the sense of personal accountability.

We would surely be better off without the half-million words that make up the Superannuation Industry Supervision Act and Regulations and the 2001 financial sector changes to the Corporations Act.

The royal commission has produced a paper on the latter legislation that illustrates its complexity and goes some way to explain why it has been a failure.

Reducing complex regulation would also free regulators to focus on enforcement. It may be that punishments comfort victims as much as they create incentives not to offend, but both are important. Successful prosecutions are important, so we need to deal with the Australian Securities and Investments Commission’s failures to prosecute, and its cosiness with the businesses it regulates.

Reduce the temptations, strengthen the principles of conduct and punish offenders. All good, but not enough for a financial sector that plays its proper role in a flourishing democratic society.

The role of the financial sector is to implement payments, allocate capital and provide financial security. In doing so it can make money for itself. But if making money is all it can think about, it should continue to be subject to ongoing and stringent scrutiny.

As with all ethical questions, we need to end with ourselves. In whatever way we make our living, can we reinvigorate our resolve, and the institutions in which we serve, to build a flourishing society?

Author: Anthony Asher, Associate Professor, UNSW

We still don’t have proof that cutting company taxes will boost jobs and wages

From The Conversation.

If you read these headlines you might think we finally have proof that cutting company taxes will boost employment and investment:

These stories are based on analysis of the 2015 company tax cut by consultants AlphaBeta. But the study, as well as some of the media coverage of it, show a worrying misunderstanding of how company tax cuts work.

Simply comparing companies that receive a tax cut with those that don’t isn’t the right methodology to conclude that the 2015 tax cuts created more employment or higher wages.

Cutting taxes lets companies keep more of their profits, allowing them to invest in new equipment and premises for example. The company then needs to hire more workers to work with these new assets. The newly created jobs require businesses to compete for workers and this increased demand pushes up wages across the entire economy.

Suppose a retail company gets a tax cut and opens a new store. It advertises for workers, many of whom are already employed by a rival store that didn’t get the tax cut. The first company will need to offer the workers higher wages to entice them away. The rival store will need to consider matching the wages in order to keep the workers.

In other words, even workers in companies that don’t receive the tax cut should see a wage rise.

Going through the AlphaBeta report

In 2015, the federal government cut the tax rate from 30% to 28.5% for businesses with less than A$2 million in revenue. Eligible businesses saved around A$2,940 on average because of the tax cut.

AlphaBeta used transaction data from 70,000 businesses to compare businesses just below the A$2 million threshold to companies that were just above it.

The analysis looked at the differences between the two groups of firms in terms of whether they hired new workers, invested in their businesses, increased worker wages, or kept some of the cash as a reserve.

AlphaBeta chalked any differences between companies that received the tax cut and those that didn’t to the company tax cuts.

As reported in The Australian, AlphaBeta found that companies that received the tax cut increased their employee headcount by 2.6%. The companies that didn’t receive the cut increased employment by just 2.1%.

This difference turned out to be “statistically significant”, meaning it is very unlikely to be the result of random chance.

As the Sydney Morning Herald pointed out, AlphaBeta also concluded that 51% of the tax cut was kept as cash, 27% went towards new investment, but only 3% was paid to workers in higher wages.

In other words, wages increased by just A$1.44 per week. This is not only a small amount, it was also found to be not statistically significant.

Problematic methodology

The main issue with this study’s methodology is actually noted by AlphaBeta in the report itself (and echoed in the coverage by the ABC and Sydney Morning Herald).

The problem is that we cannot draw any conclusions about the effect of company tax cuts on jobs or wages by studying a bunch of firms that received them and another bunch that did not, even if the firms are only slightly different.

This is because, as noted above, the effect of company tax cuts on jobs and wages take place in the entire labour market. An increase in demand for labour flows through to all business, and therefore, so do higher wages.

So we should not expect to see wages rising only in those businesses that receive the tax cuts. The finding that an increase in wages is small and insignificant is exactly what we would expect to see from this study.

Another problem is that we do not know whether the characteristics of the companies in AlphaBeta’s sample. Were some industries with particularly pronounced employment or wage increases over represented in one group but not the other, for instance?

Studying the effect of company tax cuts on employment and wages also requires a longer time period – sometimes years – and careful control of other factors affecting jobs and wages in some firms relative to others.

Blind review:

The analysis in this review is generally fair and reaches a sound conclusion regarding the AlphaBeta report. However, the logic behind company tax cut raising wages is somewhat simplified.

A cut in company tax lowers the costs of production and can flow to labour, capital (including equipment and buildings) and consumers. Economics tells us that who actually benefits from a tax cut depends on what is more responsive to the tax – labour, capital or output.

The lower production costs from a company tax cut can lead to greater output and lower prices as consumers buy more goods and services. This depends, of course, on how responsive consumers are to changes in price.

In the short-run labour is more mobile than capital, which is usually regarded as fixed. Therefore, in the short-run most of the benefit is borne by owners of capital (the companies) in the form of higher after-tax profits.

However, over the longer term, companies invest their after-tax profits in the business. So most of the benefit of the tax cut goes to workers though higher wages as the increased “capital stock” (such as equipment) makes labour more productive.

It follows that there is no reason to expect a significant increase in wages over a period of one or two years (as the AlphaBeta report covers). Indeed, such a result would be somewhat surprising. – Phil Lewis

Author: Ross Guest, Professor of Economics and National Senior Teaching Fellow, Griffith University

Reviewer: Phil Lewis, Professor of Economics, University of Canberra

Most of the benefits from the budget tax cuts will help the rich get richer

From The Conversation

In the federal budget, Treasurer Scott Morrison promised tax cuts to all working Australians in the form of an offset and changes to tax income thresholds. But our analysis of Treasury data shows that while the government advertised these as payments to low and middle income Australians, most of the benefits would flow through to high income earners in future years.

If all of the stages of the tax plan passed parliament, there would be a sharp increase in benefits for people earning above A$180,000, due to the reduction of their marginal tax rate from 45% to 32.5%.

Taxes in most countries are progressive. This means that the more you earn, the higher your marginal rate (the additional amount you pay for each dollar earned).

There are good reasons for this – progressive tax systems mean those on a lower income pay a lower average tax rate, while those on higher incomes pay a higher average tax rate. This reduces income inequality – as you earn more, for each dollar you earn, you will pay more in tax than someone on a lower income.

With the 2018-19 budget, the proposal is for a “simpler” tax system from 2024-25. This means a reduced number of tax brackets, and a lower rate of 32.5% to those earning between A$87,001 and A$200,000.

Treasurer Scott Morrison said following the budget:
Well, you’ve still got a progressive tax system. That hasn’t changed. In fact, the percentage of people at the end of this plan, who are on the top marginal tax rate is actually slightly higher than what it is today.

However this new tax system from 2024-25 is less progressive than the current system. It means higher income inequality – the rich get more of the tax cuts than the poor.

As part of the new proposal, low and middle income earners get a tax offset in 2018-19, with high income earners getting very little. This part of the plan is progressive – more money goes to lower income earners.

However, by 2024-25, the tax cuts means high income earners gain A$7,225 per year, while those earning A$50,000 to A$90,000 gain A$540 per year, and those earning A$30,000 gain A$200 per year.

Of course, another factor of tax cuts is that they only benefit those who are employed. Tax cuts don’t benefit people like the unemployed, pensioners, students (usually young people) and those on disability support pensions.

The conversation Australians need to have is how we should be spending the revenue boost we are seeing over the next few years. We can either spend this windfall gain on benefits to high income earners, in the hope that this will flow through spending to everyone else; or maybe we should encourage young people into housing through an increase to the first home owners grant, or increased funding for our schools, universities and health system.

We’ve developed a budget calculator so you can see how your family is affected by the 2018 budget.

Author:Robert Tanton, Professor, University of Canberra; Jinjing Li, Associate Professor, NATSEM, University of Canberra

Morrison’s budget tax plan is another missed opportunity

From The Conversation.

Even though this year’s budget is pretty good politics and reasonable economics, on almost every front, it is a missed opportunity to be bold.

Last year’s budget was a bank-bashing bombshell, with 4-5% of profits for five of Australia’s biggest banks yanked away, not for financial stability reasons, but because, as Treasurer Scott Morrison hinted at the budget press conference, people don’t like the banks very much.

With that populist mission accomplished, this year’s budget is more mundane.

The much-vaunted return to surplus is now planned for 2019-20 at just 0.1% of GDP. In 2017-18 we are told to expect a deficit of 1% of GDP ($18.2 billion). That’s before the forecast 3% real GDP growth from 2018-19 onward kicks in. An heroic assumption.

Compare that to an actual of 2.1% in 2016-17. That topline forecast is not insane, but it is certainly bullish. One is tempted to ask the Treasurer whether he would bet a year’s salary that real GDP will be above 3% compared to below that. I suspect he wouldn’t.

A new personal income tax plan

Having previously introduced, but not wholly managed to get through the Senate, a 10-year plan to reduce the company tax rate from 30% to 25%, this year the government has a seven-year “Personal Income Tax Plan”.

Under the “PIT plan” (pun absolutely intended) the number of tax brackets will be reduced from five to four. By 2024-25 the tax-free threshold will remain at $18,200 and a 19% tax rate will apply up to income of $41,000, at which point the 32.5% rate will kick in. The top marginal rate of 45% will apply to incomes above $200,000.

One good thing the plan does address (at least in part) is “bracket creep,” where wage growth coupled with fixed tax thresholds, leads taxpayers to pay more. Under the new plan, 94% of Australians will pay no more than a 32.5% marginal tax rate. That compares to 63% of Australians who pay that rate or less, under existing policy settings.

In terms of tax relief, it’s relatively modest. A person earning $50,000 will be $530 better off in 2018-19. Because of changes to the Low and Middle Income Tax Offset, this falls to $215 for someone earning $120,000 (and less still beyond that).

Now $530 post-tax dollars, for someone on $50,000 a year, isn’t nothing. But it doesn’t really make up for wage growth so sluggish (2.2% on average last year) that it barely keeps up with inflation.

This is all part of the government’s newly announced, but thoroughly leaked, mantra that taxes should be no more than 23.9% of GDP. The rationale is, as the budget papers put it “so we do not unfairly burden Australians, nor allow taxes to chase ill-disciplined spending”.

In some sense that’s a fair point, but the 23.9% is completely unscientific. It appears to be the average of what tax as a share of GDP was during the Howard government, which has left most economic commentators wondering “so what?”

The black economy and superannuation

There’s a “crackdown” on the black economy with a $10,000 limit on cash transactions. Who knows how that will be enforced. Perhaps our good friends the banks will start complying with anti-money laundering provisions.

In any case, I prefer a $0 limit on cash transactions by transitioning over three years to a cashless Australia. That would likely raise $5-6 billion a year every year, maybe more.

The sneakiest thing of all is taxing tobacco 12 weeks earlier when it leaves the warehouse, rather than at present upon entry into Australia. That will boost tax receipts once, and once only, in 2019-20 by $3.27 billion. Without that timing trick the return to surplus would be pushed back a year to 2020-21.

Having attacked retirement savings last year, the government is now “reuniting Australians with lost super”. Hard to be against that, but hard to get too excited either. Exit fees on superannuation accounts will also be banned, which is a very good idea and should help consolidation of accounts.

One step better would be making it a net zero cost to transfer all banking arrangements (mortgage, accounts, credit cards, etc) from one bank to another, through a mandate on banks and a subsidy for customers. That would help with competition in the banking sector, which has come under recent scrutiny.

Another small but sensible initiative is increasing the Pension Work Bonus from $250 to $300 per fortnight, which permits pensioners to earn up to that amount without affecting their pension eligibility.

On a more disappointing note there is a reasonably large amount of fanfare but very little substance about “backing regional Australia”. There is $200 million for a third round of the Building Better Regions Fund to support infrastructure on top of the $272 million from the Regional Growth Fund.

That’s fine but falls well short of a systematic plan for regional infrastructure and does not address regional unemployment, particularly youth unemployment, in a meaningful way. Tackling that would require the kind of place-based policies like targeted wage subsidies and reduced payroll taxes that I have advocated before.

There are a host of so-called “integrity measures” to do with taxation. There’s the oft-talked about tightening of thin capitalisation rules, whereby companies load worldwide debt onto an Australian entity to increase interest charges in Australia, instead of in low taxing jurisdictions like Ireland. This is in addition to other attempts to get multinationals to pay more tax. These are more likely to get multinationals to pay lawyers more, but it’s now customary padding in every budget.

The forecasts are pretty rosy in this year’s budget, but they always are. Overall, it’s a hard budget to hate, and a hard budget to like. But it is a classic political pre-election budget.

Author: Richard Holden, Professor of Economics and PLuS Alliance Fellow, UNSW

Our Growing Tax Problem: What Abandoning Tax Reform Means For Taxpayers

From The Conversation.

As we move closer to Treasurer Scott Morrison’s third budget, what we do know is this – Australia has a revenue problem. A more global and digital economy; an ageing population with fewer taxpayers and sluggish wage growth make future predictions of revenue even more precarious. There’s never been a better time for tax reform.

But as governments have tried to reform (and stumbled) over the years the burden has shifted to individual taxpayers and the latest budget is likely to be no different.

We looked at revenue data over the last 20 years drawing from budget papers, government finance statistics and the Australian Tax Office. To compare revenue over time, we have adjusted for the effect of inflation by using real measures.

Tax revenues have risen 26% in Australia since the global financial crisis, from A$310.3 billion in 2009 to A$389.8 billion by 2016.

Income tax has contributed most to this growth and some is driven by rising wages and jobs growth. Between 2009-10 and 2016-17, individual income tax revenue grew by 37% – an average of 5% each year.

But bracket creep also comes into play as personal tax thresholds have not kept pace with inflation, causing average tax rates to rise among middle income earners in particular.

The growth in business tax revenue leading up to the global financial crisis was heroic – averaging 11% each year and well above any budget forecasts. In the ten years to 2007, business tax revenue grew by almost 130% – from A$41.4 billion to almost A$95 billion.

But what goes up must come down, and business tax fell by 6.3% between 2008 and 2016. However we can see strong growth between the last two periods, with business tax receipts growing by 10.7% from A$72.6 billion to A$80.3 billion.

Revenues from GST and sales taxes have risen, by 16% since 2009.

The relationship between Australia’s economic output and its tax revenue looks somewhat different. The tax-to-GDP ratio reached nearly 25% prior to the global financial crisis, but dropped to 20.5% in 2010-11. It recovered to around 22% by 2012 and has remained essentially flat since then.

A history of reform attempts

Successive governments have attempted to create an efficient tax system that’s fair and reliable with few distortions. Prior to the turn of the century the Howard government argued the tax system was out of date, complex and inequitable, heavily reliant on individual and company tax, and prevented Australia competing on a global level.

The Howard government’s new tax system in 2001 was an answer to this. This new tax system seemed to have all the reform solutions needed – income tax cuts for hard working Australians and at long last the introduction of a goods and services tax, along with some pretty big welfare reforms.

Everything appeared to be going quite well with the new tax system – revenue from company tax was way, way above any Treasury official’s forecast.

But fast-forward 10 years and cracks began to show, prompting a new review into the effectiveness of Australia’s tax system. The Henry Review, provided some 138 recommendations for tax reform, yet very few saw the light of day. And just five years later, another review was conducted with then Treasurer Joe Hockey at the helm, which since seems to have been not so much parked as abandoned.

Income taxes from individuals have always made up the greatest share of tax revenue in Australia. Prior to the introduction of the Howard government’s tax system, income tax from individuals made up 57.3% of the total tax pool – it now accounts for 51.0% of total tax revenue.

The Howard reforms included a reduction in personal income tax rates. During the next ten years Australian businesses shouldered a greater share of the tax burden, with their share rising from 17.9% in 2000-01 to 27.4% in 2007-08 at the peak of the resource boom. This has since fallen to 20.6%.

The contribution of taxes on goods and services has remained fairly steady since moving from sales tax to the GST in 2001. GST revenue is consistently around 16% of all tax revenue.

The share of tax revenue from customs duties, excises and levies has been falling since 2001, from 14.5% to 9.5%. Other tax revenue has been fairly consistent over time, contributing less than 2% of total tax revenue. However, in 2012-13 this increased to around 4%, with the introduction of the short-lived carbon pricing mechanism.

The problem with predicting future revenue

Taxation revenues were consistently underestimated prior to the global financial crisis, but have fallen below expectations since its end. The tax-to-GDP ratio has been anchored close to 22% since 2012-13. This is despite eight successive federal budgets since May 2010 projecting future tax revenues in excess of 24% of GDP.

And where does the greatest divergence lie between forecast revenues and out turns?

Company tax revenues are consistently – and by some margin – the most difficult to predict. Receipts fell short of forecast estimates of around 5% of GDP, by around one percentage point over four years, since the May 2010 budget.

Estimates of company tax receipts for 2017-18 were revised upwards by A$4.4 billion in the latest MYEFO update in December 2017. Should this eventuate, it will take total company tax revenues for 2017-18 to A$83.8 billion (around 4.6% of GDP).

The government may well feel that this creates space for a company tax cut and personal income tax cuts in the upcoming budget.

Revenue from individual income tax has been projected to rise to around 12.5% of GDP over the forward estimates, in each budget, since May 2013. Revenue has risen from 9.5% of GDP in 2009 to 11.4% by 2016 before dropping marginally by 0.2 percentage points in the latest Mid-Year Economic and Fiscal Outlook (MYEFO) forecasts.

But wages have not played the leading role that they have been cast in, in every budget going back to May 2011. Since this time wage growth has been forecast at an elusive 3% mark or thereabouts, yet has fallen well short of this each year and currently stand at 2.1%.

Tax thresholds remained fixed between the 2012 and 2016 budgets, and the only change since has been to lift the 32.5% tax threshold from $80,000 to $87,000, effective 1 July 2016. Tax revenue growth up to now has certainly been driven by the effects of bracket creep.


Unless tax thresholds in the future are increased at least in line with inflation, this means that average taxes will continue to rise.

Plans for a 0.5% increase in the Medicare Levy rate from July 2019 have been shelved, which would have raised around A$8.2 billion over the next four years to support the National Disability Insurance Scheme.

Expectations have been raised for tax cuts to businesses as the government advocates for the “trickle-down” benefits to Australian households.

It’s hard to see how this will lead to anything other than a shift in the tax burden towards individual taxpayers – at least in the short term. This is unless company tax cuts are balanced with substantial, not modest, cuts to personal income taxes as well.

It seems Scott Morrison will be banking ever more on a strengthening economy to support Australia’s taxation revenues into the future.

Author: Rebecca Cassells, Associate Professor, Bankwest Curtin Economics Centre, Curtin University; Alan Duncan, Director, Bankwest Curtin Economics Centre and Bankwest Research Chair in Economic Policy, Curtin University

After damning the Commonwealth Bank’s management, regulators want the bank to fix itself

From The Conversation.

A report on the Commonwealth Bank’s governance, culture and accountability has stripped away the bank’s delusion that it is well run and a model of good governance.

The report by the Australian Prudential Regulation Authority (APRA) is a damning indictment of every aspect of CBA management, from the board of directors to executive management and even the lower levels of the bank. However, APRA has done little more than rap CBA on the knuckles.

Responsibility for fixing up CBA has been turned over to the bank itself. More could have been done, including placing conditions on CBA’s banking licence and removing board members and executives.

APRA has applied a A$1 billion add-on to CBA’s minimum capital requirement. These are the financial assets that the Commonwealth Bank is required to hold to ensure a stable banking system.

APRA has also accepted an enforceable undertaking from the CBA. This is essentially an agreement under which CBA accepts the report’s findings (but does not expressly agree with them) and promises to prepare a plan to respond to its recommendations.

There are indications in the APRA report that there will be further investigations of the conduct of bank employees.

What penalties?

The A$1 billion add-on to CBA’s capital requirements is not a penalty, despite commentary to that effect. APRA can and does require top-ups of this kind from time to time under the Banking Act to ensure security and confidence in the banking sector.

Given the Commonwealth Bank’s size and leading role in the sector, the additional capital requirement is prudent but hardly controversial. The funds will be returned to CBA when it completes the actions proposed by the enforceable undertaking.

At best, the capital requirement is a temporary but not significant inconvenience for CBA. It represents a mere 0.103% of its total assets as of the last financial year

That leaves the CBA enforceable undertaking as the principal outcome from the APRA report.

The enforceable undertaking is mostly a procedural document. For instance, CBA must submit its remedial action plan by June 30 2018.

It must have a clear and measurable set of responses and a timetable for each response, and must nominate a person responsible from the CBA executive team. CBA must also appoint an independent reviewer, approved by APRA, to report to APRA on compliance with the enforceable undertaking and the completion of items in the plan. CBA must report separately on executive pay issues.

In essence APRA has handed over the responsibility for cleaning up the management mess found at the CBA to the bank itself, despite finding that it is culturally unfit to properly manage itself.

Why should anyone take comfort from that arrangement?

APRA’s report also makes clear that the problems at the Commonwealth Bank do not stem from one specific issue. The problems affect the whole organisation of more than 45,000 employees with A$967 billion in assets.

An independent reviewer will vet what is being done and report on its success or otherwise to APRA. But that report will be made to APRA, not to the general public. We may never know what measures the bank implements as APRA has no obligation to disclose anything.

What else could have been done?

An enforceable undertaking can save the regulator the time, cost and uncertainty of taking legal action, as well as enable it to craft specific remedial actions to fit the circumstances.

But there is very little tailoring in the Commonwealth Bank’s enforceable undertaking. APRA has opted to wait and see what remedial action the bank comes up with. The regulatory touch is so light that even describing it as featherweight would be an exaggeration.

APRA could have done much more than it did. Banks require a licence and APRA is empowered by Banking Act to place conditions on these licences that restrict or limit how banks can operate.

APRA could have used this power to place immediate restrictions on CBA’s business practices, including on the size and calculation of executive compensation. One of the major findings of APRA’s report is that CBA executive compensation schemes did not provide sufficient incentives for senior executives to account for risk in their decision-making. Certainly, the criticisms of CBA management in the APRA report are sufficient to warrant this kind of action.

APRA has the power to remove a bank director or senior manager if the person does not meet one or more of the criteria for fitness and propriety. That APRA did not do this may be because there have already been resignations and new directors at the Commonwealth Bank.

APRA should have queried whether these changes were sufficient. Perhaps this is part of the wait-and-see approach implied in the enforceable undertaking.

The APRA report highlights systemic problems in Australia’s leading company and premier bank, including a culture of complacency, defensiveness, insularity and overconfidence. But for all of that, and despite the financial and emotional costs borne by the Australia community, APRA’s response appears to be no more than “wait and see”.

Author: Helen Bird, Course Director, Master of Corporate Governance & Research Fellow, Swinburne Law School, Swinburne University of Technology