Treasury memo misses the real impact of Labor’s negative gearing policy

From The Conversation.

Labor MPs might be rubbing their hands together with glee at a Treasury memo that shows the federal opposition’s negative gearing policy will have a “small” impact on the property market. But insights from behavioural public policy, as highlighted by the 2017 Economics Nobel laureate – Richard Thaler and his colleague Cass Sunstein, tell us that how people respond to this policy will be more about how the government frames it.

The Treasury memo showed the Labor policy of limiting negative gearing to existing homeowners will have a limited impact as the changes are unlikely to encourage investors to sell quickly. Also, owner-occupiers dominate the housing market and the costs of selling are high.

However, this assumes that people are forward-looking, well-informed, good with numbers and perfectly responsive to new information. Behavioural economics shows us that people do not always think so deeply and logically about their choices.

How any changes to negative gearing are sold to us – as a loss or gain, as a one-off or ongoing, in terms of short versus long term costs and benefits – will impact how Australians react.

Most of us aren’t whizzes with mathematics. As Nobel prize winner Herbert Simon has shown, in place of complex mathematical algorithms we use heuristics. These are simple rules of thumb that draw on our intuitions, experience and gut feel.

Heuristics and biases

One common example of a heuristic is the availability heuristic. This is when we make decisions based on easily available information such as recent events and highly emotive experiences. Our brains work better with narratives and stories than with facts and figures.

Nobel economics laureates George Akerlof and Robert Shiller have applied a similar insight to analyse people’s perceptions of housing market fluctuations. They noted that we hear lots of stories about how house prices are on an upward trend. Via the availability heuristic, we easily remember these emotionally engaging stories, much better than we can remember the dry facts about the history of house price instability and housing market crashes.

This leads us to overestimate the chances of continuing house price rises, and to underestimate the chances of a fall, driving unsustainable house price increases – as witnessed, for example, in the American sub-prime property markets before the global financial crisis.

While heuristics can help us to decide quickly, they sometimes lead us into systematic mistakes – “behavioural biases”. This does not mean that we’re all hopelessly irrational. But for negative gearing it matters how a potential change is framed, and how that fits into our heuristics and biases.

Most economists (including those at Treasury) assume that one dollar is a perfect substitute for any other dollar. Whether we save A$100 via a tax break, win A$100 from a scratch card or earn A$100 from working overtime, it makes no difference.

Contrary to this view, behavioural economics has shown that the way we treat money is different depending on the contexts in which we earn and spend it. We have different “mental accounts” for consumption, wealth, regular income and windfalls. We are more likely to splurge money we’ve won from a scratch card than money we’ve earnt doing overtime.

This is another reason why framing is important. How the government frames a negative gearing change will determine the mental account to which we assign it, and therefore how we respond.

If negative gearing changes are considered a one-off hit – the opposite of a scratch card windfall – then property owners won’t worry so much. On the other hand, if the change to negative gearing is seen as an ongoing drain on our incomes, then they will worry a lot.

Another factor that will come into play is loss aversion – people are much more likely to worry about losses than gains. Evidence from behavioural experiments shows that home-owners over-estimate the value of their properties. This makes them reluctant to sell at reduced prices in a falling market.

It also means that Australians will resist negative gearing changes if these are framed as a loss, creating political pressures for a policy u-turn. It is difficult to predict how people might respond, but behavioural economics shows that any ructions might be avoided if the negative gearing change is framed as a gain.

For instance, Treasury predicts that the additional revenue raised from restricting negative gearing could be up to A$3.9 billion. Therefore, the negative gearing changes could cover more than 80% of federal government expenditure on veterans and their families.

In the long and short term

Treasury’s modelling notes there might be downward pressure on house prices in the short term from changing negative gearing, but that this will be small overall.

But a range of models and experiments have shown that people are disproportionately focused on tangible, short-term outcomes. For example, most of us find it hard to persuade ourselves to go the gym: the short-term costs are inconvenience and discomfort and the benefits seem intangible and distant. This is called “present bias”.

Recent work in behavioural economics confirms that framing (alongside a range of other socio-psychological influences) has a strong impact on our choices. Framing will determine how we perceive the policy, which mental account we will use to process it and how the various heuristics and biases identified by economics and psychologists will play out.

In the debates around negative gearing policy changes, these behavioural insights have not been highlighted. So perhaps Treasury could have added some psychology, alongside the economics, in arguing that house price falls are likely to be limited.

Author: Research Professor at the Institute for Choice, University of South Australia

People on low incomes are sacrificing basic goods to take out insurance

From The Conversation.

[Insurance] is the one thing I will not skimp on, because we don’t know what’s around the corner with my husband being unwell and a disabled son. And now I’ve hurt my foot. I mean, accidents happen. I don’t know what’s around the corner. That’s the first thing that gets paid.

Maggie (all names in this article are psuedonyms), is a single woman in her 50s who lives with her husband and son with disability. She feels health insurance is essential to prepare for seemingly inevitable risks.

To afford insurance, Maggie cuts down on expenses by not buying clothes; she gets free clothes from charity organisations. She also saves money by only purchasing the cheapest marked-down foods that will expire soon and avoiding public transport to save money. And when things are tight she skips meals to make do.

Some people on low incomes put insurance cover first – even if it means doing without basic goods, our research finds. Yet low-income households are the most likely to lack private insurance cover.

Insecure work, low and unstable incomes, and increasingly haphazard and unreliable social protections in education, health, transport and housing continue to make the lives of low-income households risky. Insurance can mitigate some of the harms low-income people face.

To understand how households with low or precarious incomes manage short and longer-term risks, we surveyed 70 people in three areas of suburban Melbourne that experience high levels of financial insecurity. We asked questions about household income and expenditure and how they coped with unexpected expenses.

We found that in order to pay for insurance people were cutting down on heating, food and outings.

Weighing up the odds

The financial problems faced by people on a low income are often explained by poor financial skills, knowledge and behaviours. Yet our research shows that low-income households are also constrained by uncertain and inadequate incomes, unaffordable housing and unexpected high energy costs.

Some of the people we surveyed weighed up their risk of serious incidents and went without insurance because the everyday risks they experienced were more pressing than potential future risks.

Ted, a single man in his fifties receiving the Newstart Allowance, would have liked to have insurance but explained that it was:

just cost prohibitive. I’d rather try and get a roof over my head…than being insured should something happen down the track.

Malcolm, a casually employed factory worker also receiving the Newstart Allowance, said his car was “not worth insuring” for property damage, even though not having insurance exposed him to risk if he damaged another person’s car.

It’s a financial balancing act. Most things that could get damaged on my car I could fix myself…It’s just unnecessary for me. And if it gets written off, it gets written off, and I move on.

Mending the safety net to reduce avoidable risks

Increasingly, private insurance is filling the gaps left by government policies. Instead of enduring the indignities of income support, people are encouraged to take out income protection insurance.

Private health insurance is promoted as a way of avoiding the queue for health care. Inadequate public transport means an increased reliance on private transport – with all the risks and costs that entails.

Insurance providers are aware of the increased risks of inequality. The data insurance companies gather provides fine grained information about the nature of risks to which individuals and insurance companies are exposed.

Research commissioned by the Actuaries Institute notes that because of this data gathering, a growing proportion of the population will be deemed so risky that the price of insurance will become too great for them.

Poor people who already lead risky lives will then be faced with even more risk. The Actuaries Institute report argues that there will be a greater need for government subsidised compulsory insurance to protect those who are exposed to risk beyond their control. But greater access to insurance isn’t the only answer.

Our research suggests that investment in the social safety net could reduce some of the avoidable risks that come with poverty. The government should be ensuring low-income households have access to adequate, predictable income; affordable, quality housing, accessible, affordable public transport and health care. All of these things reduce risks for individuals and contribute to a less divided and risky society.

Authors: Dina Bowman, Principal Research Fellow, Research & Policy Centre, Brotherhood of St Laurence and Honorary Senior Fellow, University of Melbourne; Marcus Banks, Senior Research Fellow, Work & Economic Security, Research & Policy Centre, Brotherhood of St Laurence. Social policy and consumer finance researcher, School of Economics, Finance and Marketing, RMIT University

Mobile Apps Can Be a Double-edged Sword

From The Conversation.

Intense retail competition has led old standbys, such as Sears, to close dozens of stores. Walmart is venturing online more. And Amazon is expanding offline, opening stores and buying Whole Foods. The fight for retail dollars is fierce, and the battleground will soon migrate into the palms of customers’ hands – via apps on their smartphones.

This isn’t just happening with mega-retailers. Moviechains and pet supply stores are increasingly connecting with their customers through their own branded apps. Zumiez, a specialty clothing chain with 600 stores in the U.S., has an app. Scooter’s Coffee, an Omaha-based coffee chain with 200 stores, has one too. So does New York Pizza Oven, a single pizza parlor in Vermont.

Mobile apps are becoming key ways for customers and retailers to interact. Our recent analysis of data from a large U.S. retailer of video games and electronics (whose name we agreed to keep confidential) found that apps can even affect consumers’ offline buying habits.

Growth in use – and spending

The number of people who have the option to use mobile apps is skyrocketing. More than 70 percent of the world population will own a smartphone by 2020. And they’ll spend more than 80 percent of their on-phone time using task-specific apps.

Is there no line because people are ordering ahead on their mobile phones? jessicakirsh/Shutterstock.com

Letting buyers learn about products, discover deals, locate nearby stores and even place orders in advance is a huge business opportunity. At Starbucks, for example, an app allowing people to order and pay on the go – just swinging into the store for pickup – helped customers avoid standing in line and waiting: Over five years, 20 percent of its sales shifted to online transactions.

Research has also begun to show that people who use mobile shopping apps buy more than they might otherwise. After individual shoppers started purchasing using eBay’s mobile app, their purchases from eBay’s website increased. Similarly, a tablet app from major Chinese e-tailer Alibaba led customers to spend about US$923.5 million more each year with the company than they would have without the app. Some of that increased spending is from shoppers using the app to buy impulsively – making one-off purchases of items they are interested in, or adding items to larger orders.

Our research recently found a new dimension to this app-related spending boost. Over 18 months, customers who downloaded the branded app of the retailer we studied spent 30 percent more in stores than they would have without the app. We can infer this by looking at data on customers’ spending before and after the app was installed, and by comparing that to the spending of a random sample of customers who had similar demographics and shopping behavior before the app launched.

We learned that most of the increase was because customers used the app to find out about products before buying them. For example, by closely analyzing the data on app use and purchases, we could see these customers started increasing purchases of lesser known video games when they started using the app.

App users return products more

While shoppers who use a retailer’s mobile app tend to buy more online and in stores, we find that they are also more prone to subsequently returning the products they purchased.

In particular, customers who use a retailer’s app tend to return products most often when they purchased those products on discount, and within seven days of making the original purchase. Apps often make it easier to purchase items on impulse. When customers receive some of the items and are dissatisfied, they regret the decisions and return the items.

Even taking into account the high rate of returns, app users spend more both online and in physical stores. But that’s when the apps work as customers expect them to.

App failures –- and consequences

Apps that load information slowly or crash frequently can deter not only online purchasing, but in-person spending, too. Surveys show that more than 60 percent of users expect an app to load within four seconds. And our ongoing research suggests that more than half of users will abandon an app that freezes or crashes frequently.

App slowdowns can be costly. One estimate suggests that if each Amazon webpage took just one second longer to load, the company’s sales could drop as much as $1.6 billion a year. For smaller retailers, a similar drop of 2 to 3 percent would be a smaller dollar amount but still a significant blow.

Our ongoing research with Stanford’s Sridhar Narayanan suggests that poor app performance reduces users’ in-store spending too. Specifically, we studied how shoppers react when an app is not accessible for five or six hours, due (users were told) to a server error. Our preliminary results suggest that in the following two weeks, those shoppers spent 3 to 4 percent less in stores than they would have otherwise. Less-frequent customers reduced their spending even more than the company’s more regular shoppers.

Unnati Narang discusses her ongoing research on failures in mobile shopping apps.

Interestingly, customers who experience app failures spend less in stores, but their online spending remains unchanged. A deeper analysis indicates that when a retailer’s app fails, shoppers often go to the retailer’s website to complete their intended transactions. But the negative experience from app failure discourages them from buying more in the retailer’s store.

Our research illustrates some ways mobile apps can be a double-edged sword for customers and retailers alike. Shoppers can use apps to learn more about prospective purchases, be inspired on the fly and save time at the cash register. But if the software fails, they may be frustrated, discouraged and even spend less at physical stores. Retailers can see increased sales and faster transactions, but may have to handle more returns – though they’ll still make more money. The longer-term effects of mobile apps on the retail business have yet to be seen, of course, but in an ever-changing landscape, companies and customers alike will be exploring the options.

Authors: Venkatesh Shankar, Professor of Marketing; Director of Research, Center for Retailing Studies, Texas A&M University; Unnati Narang, Ph.D. student in Business Administration (Marketing), Texas A&M University


Global inequality is on the rise – but at vastly different rates across the world

From The Conversation.

Inequality is rising almost everywhere across the world – that’s the clear finding of the first ever World Inequality Report. In particular, it has grown fastest in Russia, India and China – places where this was long suspected but there was little accurate data to paint a reliable picture.

Until now, it was actually very difficult to compare inequality in different regions of the world because of sparse or inconsistent data, which lacked credibility. But, attempting to overcome this gap, the new World Inequality Report is built on data collection work carried out by more than a hundred researchers located across every continent and contributing to the World Wealth and Income Database.

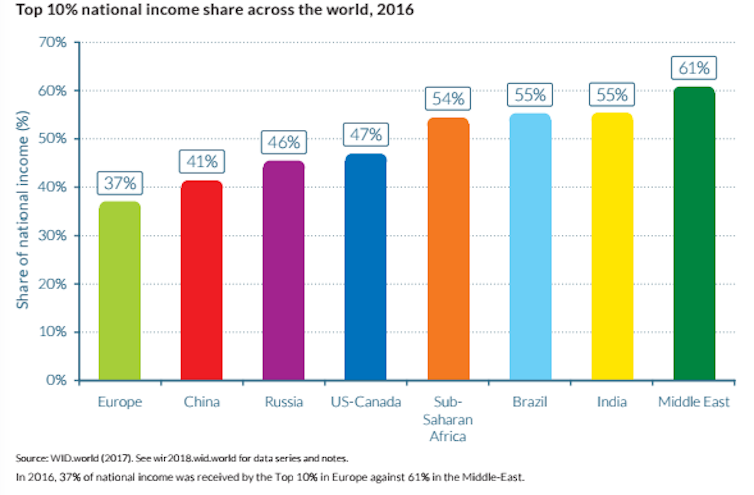
Europe is the least unequal region of the world, having experienced a milder increase in inequality. At the bottom half of the table are Sub-Saharan Africa, Brazil and India, with the Middle East as the most unequal region.

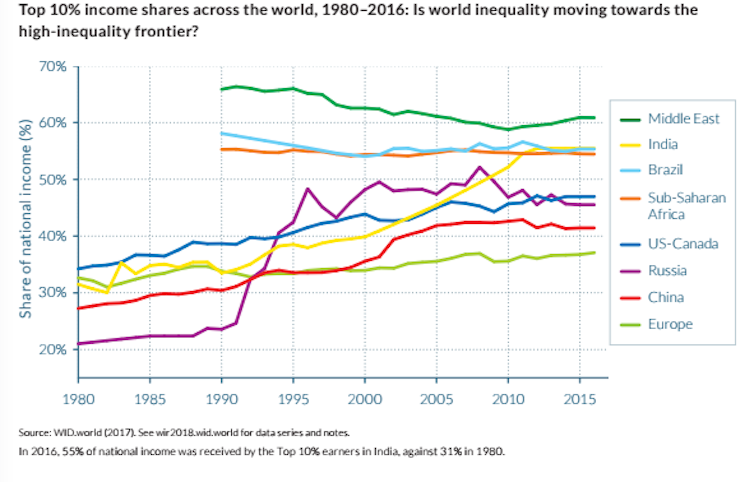
Since 1980, the report shows that there has been rising inequality occurring at different speeds in most parts of the world. This is measured by the top 10% share of income distribution – how much of the nation’s income the top 10% of earners hold.

Places where inequality has remained stable are those where it was already at very high levels. In line with this trend, we observe that the Middle East is perhaps the most unequal region, where the top 10% of income earners have consistently captured over 60% of the nation’s income.

Inequality is always a concern

Even in Europe, where it is less pronounced, equality always raises ethical concerns. For example, in Western Europe, many do not receive a real living wage, despite working hard, often in full-time employment. Plus, the data shows that the top 10% of earners in Europe as a whole still hold 37% of the total national income in 2016.

Rising income inequality should be focal to public debate because it is also a factor which motivates human behaviour. It affects how we consume, save and invest. For many, it determines whether one can access the credit market or a good school for our children

This, in turn, may affect economic growth, raising the question of whether it is economically efficient to have unequal societies.

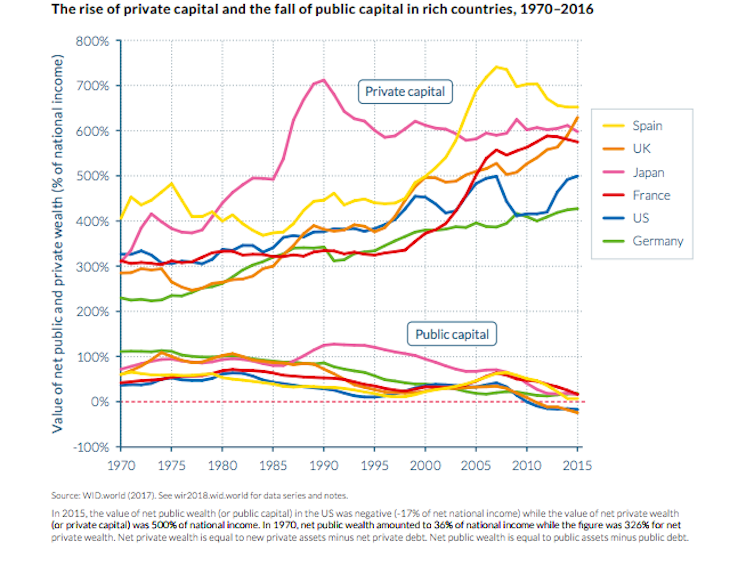
Going into the details of what drives the rise in income inequality, the report shows that unequal ownership of national wealth is an important force. National wealth can be either publicly owned (for example, the value of schools, hospitals and public infrastructure) or privately owned (the value of private assets).

Since 1980, very large transfers of public to private wealth occurred in nearly all countries, whether rich or emerging. While national wealth has substantially increased, public wealth is now negative or close to zero in rich countries. In particular, the UK and the US are countries with the lowest levels of public capital.

Arguably, this limits the ability of governments to tackle inequality. Certainly, it has important implications for wealth inequality among citizens. It also indicates that national policies shaping ownership of capital have been a major factor contributing to the rise of inequality since 1980.

Inequality in the developing world

Resource rich economies are traditionally considered to be prone to conflict or more authoritarian in terms of how they are governed. What this new report tells us is that some resource rich economies, such as “oil economies”, are also extremely unequal. This was often suspected because natural resources are often concentrated in the hands of a minority. Until this report, however, there was no clear evidence.

The World Inequality Report appears to show us that the Middle East region may be even more unequal than Central and South America, which have long been held up as some of the most unequal places on Earth.

Another significant finding is that countries at similar stages of development have seen different patterns of rising inequality. This suggests that national policies and institutions can make the difference. The trajectories of three major emerging economies are illustrative. Russia has an abrupt increase, China a moderate pace and India a gradual one.

The comparison between Europe and the US provides an even more striking example – Western Europe remains the place with the lowest concentration of national income among the top 10% of earners.

Compared with the US, the divergence in inequality has been spectacular. While the top 1% income share was close to 10% in both regions in 1980, it rose only slightly to 12% in 2016 in Western Europe, while it shot up to 20% in the US. This might help explain the rise in populism. Those left behind grow impatient when they do not see any tangible improvement (or even a worsening) in their living conditions.

It is not just important to reduce inequality to make society more fair. Equal societies are associated with other important outcomes. As well as political and social stability, education, crime and financial stability may all suffer when inequality is high.

With this new data at our fingertips, we can now act to learn from the policies of more equal regions and implement them to reduce inequality across the world.

Author: Antonio Savoia, Lecturer in Development Economics, University of Manchester

A bubble? We don’t even know how to value Bitcoin

From The Conversation.

Bitcoin is a “speculative mania” according to the governor of the Reserve Bank of Australia. But it’s not so easy to say that Bitcoin is a bubble – we don’t know how to value it.

Recent price rises (close to A$18,000 in the past three months) may be too great and can’t continue. But the Bitcoin market is only just maturing as an investment and as a currency, and so it may still have room to grow.

A bubble is when the price of an asset diverges from its “fundamentals” – the aspects of an asset that investors use to value it. These could be the income that can be earned from a stock over time, a company’s cash flow, the state of a country’s economy, or even the rent from property.

But Bitcoin does not pay out profits (like shares) or rent (like property), and is not attached a national economy (like fiat currencies). This is part of the reason why it is hard to tell what the underlying value of Bitcoin is or should be.

In the search for fundamentals some have suggested we should look at the supply of Bitcoins in the market (which is regulated by the technology itself), the number of Bitcoin transactions through the market, or even the energy consumed by Bitcoin miners (the computers that validate transactions and are rewarded with Bitcoins).

Diverging from fundamentals

If we take a close look, we can see how the price of Bitcoin may be diverging from these fundamentals. For instance, it is becoming less profitable to be a miner, especially as the energy required increases. At some stage the cost may exceed the price of Bitcoin, making the network less worthwhile to both mine and invest.

Bitcoin may be the best known cryptocurrency but it is also losing marketshare to other cryptocurrencies, such as Ethereum and Litecoin. Bitcoin currently accounts for 59.4% of the total global cryptocurrency market, but at the beginning of 2016 it was 91.3%. Many of these other cryptocurrencies have more functionality than Bitcoin (such as Ethereum’s ability to execute smart contracts), or are more efficient and use less energy (such as Litecoin).

Government policy, such as taxation or the establishment of national digital currencies, may also make it riskier or less worthwhile to mine, transact or hold the cryptocurrency. China’s ban on Initial Coin Offerings earlier this year reduced the value of Bitcoin by 20% in 24 hours.

Without these fundamentals the price of Bitcoin largely reflects speculation. And there is some evidence that people are simply buying and holding Bitcoin in the hope it will keep rising in value (also known as Greater Fool investing). Certainly, the cap on the total number (21 million) of Bitcoins that can exist, makes the currency inherently deflationary – the value of the currency relative to goods and services will keep increasing even without speculation and so there is a disincentive to spend it.

Bitcoin still has room to grow

Many big investors – including banks and hedge funds – have not yet entered into the market. The volatility and lack of regulation around Bitcoin are two reasons stopping these investors from jumping in.

There are new financial products being developed, such as futures contracts, that may reduce the risk of holding Bitcoin and allow these institutional investors to get in.

But Bitcoin futures contracts – where people can place bets on the future price of stocks or markets – may also work against the price of Bitcoin. Just like gamblers place bets on horse races rather than buying a horse, investors may simply buy and sell the futures contracts rather than Bitcoin itself (some contracts are even settled in cash, rather than Bitcoin). All of this could lead to less actual Bitcoin changing hands, leading to less demand.

Although the rush to invest is apparently encouraging some people to take out mortgages to buy Bitcoin, traditional banks won’t lend specifically for that purpose as the market is too volatile.

But it’s not just on the finance side that the Bitcoin market is set to expand. More infrastructure to support Bitcoin in the broader economy is rolling out, which should spur demand.

Bitcoin ATMs are being installed in many countries, including Australia. Bitcoin lending is emerging on peer-to-peer platforms, and new and more regulated marketplaces are being created.

Many companies are accepting Bitcoin as payment. That means that even if the speculation dies down, Bitcoin can still be traded for some goods and services.

And finally, although the fundamentals of Bitcoin are still up for debate, when it comes to transaction volume through the network there appears to be a lot of room for growth.

It’s good to remember that people have been calling Bitcoin a bubble for a long time, even when the price was just US$35 in 2013.

In the end, this is uncharted territory. We don’t know how to value Bitcoin, or what will happen. Historical examples may or may not apply.

What we do know is that the technology behind most cryptocurrencies is enabling new models of value transfer through secure global consensus networks, and that is causing excitement and nervousness. Investors should beware.

Authors: Alicia (Lucy) Cameron, Senior Research Consultant, CSIRO;
Kelly Trinh, Data Scientist, CSIRO

The ‘utopian’ currency Bitcoin is a potentially catastrophic energy guzzler

From The Conversation.

The recent upsurge in the price of Bitcoin seems to have finally awakened the world to the massively destructive environmental consequences of this bubble.

These consequences were pointed out as long ago as 2013 by Australian sustainability analyst and entrepreneur Guy Lane, executive director of the Long Future Foundation. In recent months, the Bitcoin bubble has got massively bigger and the associated waste of energy is now much more widely recognised.

In essence, the creation of a new Bitcoin requires the performance of a complex calculation that has no value except to show that it has been done. The crucial feature, as is common in cryptography, is that the calculation in question is very hard to perform but easy to verify once it’s done.

At present, the most widely used estimate of the energy required to “mine” Bitcoins is comparable to the electricity usage of New Zealand, but this is probably an underestimate. If allowed to continue unchecked in our current energy-constrained, climate-threatened world, Bitcoin mining will become an environmental disaster.

The rising energy demands of Bitcoin

In the early days of Bitcoin, the necessary computations could be performed on ordinary personal computers.

But now, “miners” use purpose-built machines optimised for the particular algorithms used by Bitcoin. With these machines, the primary cost of the system is the electricity used to run it. That means, of course, that the only way to be profitable as a Bitcoin miner is to have access to the cheapest possible electricity.

Most of the time that means electricity generated by burning cheap coal in old plants, where the capital costs have long been written off. Bitcoin mining today is concentrated in China, which still relies heavily on coal.

Even in a large grid, with multiple sources of electricity, Bitcoin mining effectively adds to the demand for coal-fired power. Bitcoin computers run continuously, so they constitute a “baseload” demand, which matches the supply characteristics of coal.

More generally, even in a process of transition to renewables, any increase in electricity demand at the margin may be regarded as slowing the pace at which the dirtiest coal-fired plants can be shut down. So Bitcoin mining is effectively slowing our progress towards a clean energy transition – right at the very moment we need to be accelerating.

How much energy is Bitcoin using?

A widely used estimate by Digiconomist suggests that the Bitcoin network currently uses around 30 terawatt-hours (TWh) a year, or 0.1% of total world consumption – more than the individual energy use of more than 150 countries.

By contrast, in his 2013 analysis, Guy Lane estimated that a Bitcoin price of US$10,000 would see that energy use figure climb to 80 TWh. If the current high price is sustained for any length of time, Lane’s estimate will be closer to the mark, and perhaps even conservative.

The cost of electricity is around 5c per kilowatt-hour for industrial-scale users. Miners with higher costs have mostly gone out of business.

As a first approximation, Bitcoin miners will spend resources (nearly all electricity) equal to the price of a new Bitcoin. However, to be conservative, let’s assume that only 75% of the cost of Bitcoin mining arises from electricity.

Assuming an electricity price of 5c per kWh and a Bitcoin price of US$10,000, this means that each Bitcoin consumes about 150 megawatt-hours of electricity. Under current rules, the settings for Bitcoin allow the mining of 1,800 Bitcoins a day, implying daily use of 24,000MWh or an annual rate of nearly 100TWh – about 0.3% of all global electricity use.

Roughly speaking, each MWh of coal-fired electricity generation is associated with a tonne of carbon dioxide emissions, so a terawatt-hour corresponds to a million tonnes of CO₂.

So much energy, so few users

An obvious comparison is with the existing financial system.

Digiconomics estimated that Visa is massively more efficient in processing transactions. A supporter of Bitcoin, Carlos Domingo, hit back with a calculation suggesting that the entire global financial system uses about 100TWh per year, or three times as much as the Diginconomics estimate for Bitcoin.

As a defence, this is far from impressive. First, as we’ve seen, if the current high price is sustained, total annual energy use from Bitcoin mining is also likely to rise to 100TWh.

More importantly, the global financial system serves the entire world. By contrast, the number of active Bitcoin investors has been estimated at 3 million. Almost all of these people are pure speculators, holding Bitcoin as an asset while using the standard financial system for all of their private and business transactions.

Another group is believed to use Bitcoin for illicit purposes such as drug dealing or money laundering, before converting these funds into their own national currency. The number of people who routinely use Bitcoin as a currency for legitimate transactions might be in the low thousands or perhaps even fewer.

Shifting the whole global financial system to Bitcoin would require at least a 200-fold increase, which in turn would entail increasing the the world’s electricity use by around 500%. With the current threat of climate change looming large globally – this constitutes an unthinkably large amount of energy consumption.

Better alternatives to Bitcoin

The disastrous nature of Bitcoin’s energy consumption should not lead us to abandon the associated idea of blockchain technology altogether.

There are alternatives to the “proof of work” method of validating changes to the blockchain, such as “proof of importance”, which is analogous to Google’s page ranking systems. Projects such as Gridcoin are based on calculations that are actually useful to science. But these ideas are in their infancy.

For the moment, the problem is Bitcoin and how to deal with it. There is no obvious way to fix the inherent problems in its design. The sooner this collective delusion comes to an end, the better.

Author: John Quiggin, Professor, School of Economics, The University of Queensland

Being middle class depends on where you live

From The Conversation.

Politicians are fond of pitching to the “average Australian” but judging by the income of Australians, whether you are middle class depends on where you live. And where we live tells a rich story of who we are as a nation – socially, culturally and economically.

Income is at the heart of access to services and opportunities, which are differing and unequal based on where you live.


Our ability to afford housing that meets our needs largely determines where we live. In turn, where we live influences access to other important features of our lives which shape lifelong and intergenerational opportunities. For example, student performance is associated with everything from where a student lives to their parent’s occupation.

Household incomes in capital cities are typically among the highest, with incomes declining the further you live from major cities. So it’s understandable why Australians living outside or on the fringes of cities might feel somewhat left behind.

The Australian Bureau of Statistics presents “average” income as a range based on where you live. This range is marked by a lower number (30% of incomes) at the beginning and the higher number (80% of incomes) at the top.

This “average” income varies substantially between different rural areas from A$78,548 – A$163,265 in Forrest (ACT) to A$10,507 – A$26,431 in Thamarrurr (NT). This is actually an equivalised household income which factors in the economic resources like the number of people and their characteristics, between households.


The difference between the top and bottom of this range of “average” household income also shows greater inequality within areas.

Even within the greater Sydney metropolitan area, there’s significant differences in household income between areas. The average household equivalised income in Lavender Bay is around A$40,000 – A$95,000 higher than it is in Marayong.

The difference in income is marked, and there are other differences too. People in Marayong are on average younger than Lavendar Bay. Family size is smaller in Lavendar Bay. Over half of the Lavendar Bay residents hold university degrees, compared to a more skill-based workforce in Marayong.

Why there is no one “average” Australian

Cities offer access to myriad employment options. Industries associated with relatively high incomes are typically concentrated in cities to take advantage of global connections.

Sydney, Melbourne and Canberra are notable standouts based on household income. So if you live close to these major cities you’d be getting the most opportunities in terms of employment and income, given the you’re the right candidate.

But not everyone wants to live in the centre of cities. Housing, lifestyle and neighbourhood preferences also play a role in where we live, but are still influenced by income and proximity to such things as employment and family and friends.

Also, infrastructure which supports social and economic wellbeing is essential in communities, regardless of where we live.

What politicians should be talking about instead

Improving the different and unequal access across areas requires better internet connectivity and advances in the way we work. Policies around housing and family-friendly workplaces go some way to supporting Australians in work.

Any measures to redress inequalities require understanding the needs and wants of communities. Proposed planning to reconfigure the greater city of Sydney around population and socioeconomic infrastructure offers an example of a data-driven approach to planning. Whether the proposed reconfiguration of Sydney leads to improvements or greater segmentation will be revealed in practice.

Politicians rarely reflect the characteristics of the people they represent, particularly when we consider the remuneration, entitlements and perks of political office. The longer politicians are in office, and somewhat removed from the people they represent, the further they potentially become from gauging their electorate.

Yet politicians profess to know what the average Australians they represent needs and wants. They apply this to a range of things from service delivery to representation on political matters. And this is within reason.

But without current experience we struggle to see things from perspectives other than our own. Take for example the way some have come to label themselves outsiders from the social and political elite to advance their credibility with average Australians.

Bringing politicians in touch with the diversity of needs and wants of Australians starts with a self-check and recognition of individual bias (conscious or unconscious). This is the first step toward really understanding and connecting with Australians – be it in the “average” or otherwise.

Author: Liz Allen, Demographer, ANU Centre for Social Research and Methods, Australian National University

Bitcoin isn’t a currency – and unless it becomes one it could be worthless

From The Conversation.

Bitcoin is in decline. Not its price, which has increased 900% this year and (at the time of writing) stands at over US$12,000 per unit, but its actual use as a currency. And this makes its rapid appreciation all the more puzzling.

A few years ago, enthusiasts triumphantly shared announcements from businesses that had started accepting Bitcoin. Over the last couple of years, such announcements have become scarce. Instead, businesses that once accepted the currency have begun to drop it.

The BBC contacted ten businesses in London that once advertised accepting Bitcoin. Four no longer accepted it, and two that did said they hardly ever received payments in Bitcoin. The same is even true online. The Wall Street Journal, citing a report by Morgan Stanley, recently reported that Bitcoin is now accepted by just three of the top 500 global online merchants, down from five last year.

If growing adoption as a currency can’t justify Bitcoin’s rapid appreciation, what can? Many enthusiasts have started to promote the idea of Bitcoin as a store of value. In economics, this is usually defined along the lines of “an item that people can use to transfer purchasing power from the present to the future”. In simple terms, it’s somewhere safe to invest your wealth that won’t lose its worth over time.

Apples can be used to barter services from a neighbour while they’re still fresh, but their purchasing power will disappear as they rot. The purchasing power can be retained into the future by exchanging the apples for money, gold, government bonds or some other store of value.

Some items have attributes that make them better stores of value than others, whether we are talking about physical items or digital objects. Gold is a good store of value because it’s durable. Electronic bond certificates are also durable as long as banks’ systems don’t fail, and have the added benefit of being easier to secure than physical valuables. Money, both physical currency and digital bank money, has the advantage of being very liquid, so it’s easy to convert into a purchase when needed.

Bitcoin does share many of these attributes of a good store of value. It also offers potentially high levels of financial privacy, somewhat similarly to the offshore banking system. This is an important attribute of a store of value for some people, although it also creates a lack of accountability and the potential for tax evasion.

But the most important attribute of a store of value is that it’s valuable. Gold is valuable because it has many industrial and decorative uses. Its price can fluctuate because of speculation on financial markets, but it can never fall to zero. There will always be someone willing to accept gold because it’s a useful commodity.

Similarly, US government bonds are ultimately valuable because they entitle the owner to a relatively secure flow of interest payments. Dollars and euros are valuable because they are widely accepted as a means of payment, and will continue to be so in the foreseeable future. In contrast, the future acceptability of the Venezuelan bolivar is in doubt, so people are desperately trying to exchange it to better stores of value.

Is Bitcoin valuable? It has no industrial or decorative uses, and it doesn’t entitle the holder to receive interest. It was intended to be valuable as a currency that is accepted the world over, but that doesn’t seem to be happening. The only major value that Bitcoin has now is its exchange value. Many people are willing to pay a lot of money today to get hold of some Bitcoin.

But what they are getting for their money is simply the hope that another buyer down the line will pay even more money for the coins. Once the music stops, there is no fundamental value to prevent the coins’ price from falling close to zero, save for their tenuous position as the currency of choice in the online drug trade and grey-area gambling.

Beanie Babies lessons

The idea that Bitcoin is valuable because it’s a store of value is upside down. In reality, something becomes a store of value because it’s valuable. In the 1990s, people started to trade Beanie Babies on eBay. Prices of these limited-edition plush toys rose to thousands of dollars, and by 1997 they made up 6.6% of the entire site’s transaction volume.

Some people invested their life savings into Beanie Babies, fully expecting their value to be preserved and more. But eventually people came to their senses and the market bombed. Beanie Babies are useful as toys and collectables, but that doesn’t justify thousand-dollar valuations.

My advice to individuals and institutions tempted by the headlines is to keep their savings away from Bitcoin and other cryptocurrencies and “initial coin offerings” (ICOs). I know serious blockchain developers won’t mind me saying this, because they see speculative bubbles and bursts as a distraction. For Bitcoin to truly function as a store of value, it first has to gain acceptance as a currency.

Author: Vili Lehdonvirta, Associate Professor and Senior Research Fellow, Oxford Internet Institute, University of Oxford

How lending startups like Afterpay make their money

From The Conversation.

Startups like Afterpay that allow consumers to “instantly” borrow money for purchases are using a business model that has been around for centuries

It’s called “factoring” of accounts receivables. This is when a company sells its accounts receivables (money owed for a good or service that has already been delivered) to a lender, typically at a discount.

Typically, factoring arrangements are between a business and a lender, with the customer being oblivious to the arrangement. Afterpay’s innovation was to turn this centuries-old, back-office financial arrangement into something customer-facing.

In 2016-17, Afterpay generated about A$23 million in fees from retailers and another A$6.1 million in late fees. It wrote off only A$3.3 million in bad debt.

An example of traditional factoring would be a company selling A$100 in accounts receivables to a lender for A$95. The company gets A$95 cash up front (to spend on wages or ingredients) and eliminates the risk of not being paid. The lender makes a A$5 profit once the A$100 has been collected.

Similarly, if you make a A$100 purchase using Afterpay, the merchant immediately receives A$96. Afterpay then collects four instalments of A$25 from the customer, making a A$4 profit.

The A$4 difference is essentially the interest that Afterpay charges (equivalent to 4.17%). The unusual nature of the transaction is that Afterpay lends to the business and the customer repays Afterpay.

The 4.17% Afterpay charges in this example is quite a modest interest rate, at least compared to credit cards. However, since each loan is outstanding for only a short time, generally six to eight weeks, or a maximum of two months, Afterpay can earn much more than 4.17%.

This is because of compounding interest. Suppose a A$1,000 loan is made on January 1 at an interest rate of 4%, for two months. On March 1, A$1,040 is collected – the original A$1,000 plus A$40 interest.

Another loan is made on March 1 – A$1,040 at a 4% rate, for two months. On May 1, A$1,081.60 is collected – the original A$1,040 plus A$41.60 interest.

This can be repeated again and again. By December 31 the initial A$1,000 has grown to A$1,265.32. This equates to a 26.5% annual interest rate.

Except Afterpay doesn’t have to wait two months to collect the entire amount as a lump sum. Instead, it collects the money lent in instalments, which means the the annual interest rate is approximately 30%!

So, what are the risks?

There are three reasons a merchant may enable Afterpay on their site. The merchant could make a sale it would otherwise not make, hence revenue increases. It’s collecting cash upfront, which improves its balance sheet. And the merchant eliminates the risk it won’t be paid if a customer defaults.

However, there is a risk to Afterpay if the customer defaults and does not pay the amount due. Afterpay’s business model is akin to factoring without recourse.

There are two types of factoring of accounts receivable – with and without recourse. In factoring with recourse, the lender will return uncollected debts to the business.

In factoring without recourse, the lender is responsible for the collection of unpaid invoices from the customer and cannot return them. In other words, when factoring with recourse the business retains the risk of non-payment.

To discourage this behaviour, Afterpay charges fines if the customer fails to make payments (a A$10 late fee, and a further A$7 after seven days). If the customer still does not pay, Afterpay writes off both the initial loan and the fines charged. The fines are still counted as revenue in Afterpay’s accounts.

The greater risk that Afterpay faces is not from the customers defaulting on their loans, but from those who aren’t even using the service.

Customers making cash or credit card purchases may soon demand that online merchants give them a 4% cash discount – the same amount they pay Afterpay. If merchants comply and give everyone a 4% cash discount, the uniqueness of Afterpay’s business model will suffer. The cost of its loans would no longer be invisible.

Author: Saurav Dutta, Head of School at the School of Accounting, Curtin University

Australia isn’t dominated by big businesses that gouge customers: Grattan report

From The Conversation.

When we see excessive spikes in fuel prices, rapid annual increases in health insurance premiums, and a confusing array of electricity options to choose from, it is easy to conclude that big companies are using their market power to gouge their customers.

But the latest report from the Grattan Institute finds claims about Australia being dominated by oligopolies are overblown. Only about 15% of the economy is dominated by large firms.

In the “natural monopolies”, such as electricity distribution, a single firm typically serves the market. And where the largest firms enjoy strong scale advantages, such as in mobile telecoms, just a handful of options are available to consumers.

Then there are sectors where competition is constrained by regulation, such as banking and pharmacies. In such sectors, the largest four firms earn more than two-thirds of revenue, on average.

Australians have long been concerned about oligopoly power. But in the largest sectors with barriers to entry, markets are not much more concentrated in Australia than they are in other economies of a similar size. Supermarkets in Australia are the exception to this rule.

While the United States is less concentrated at a national level, much of this is explained by its larger population. In Florida, for example, a state with a population of 21 million, its sectors are typically just as concentrated as Australia’s, if not more so.

The report also finds no clear trend toward higher concentration in Australia, unlike the case in the US. The revenue of the top 100 Australian listed firms relative to GDP has changed little since the early 1990s.

While the market share of Australia’s big four banks increased through mergers and acquisitions, Coles’ and Woolworths’ dominance appears to be in decline with the rise of Aldi and Costco.

Whether high concentration in Australia is a problem depends on its impact on consumers. Our report finds that sectors with high barriers to entry are about 20% more profitable than sectors with no significant barriers, although there is plenty of variation.

The most profitable sectors include supermarkets, telecommunications (wireless and fixed-line), internet publishing, electricity distribution and transmission, airports and gambling. The banks’ profitability has fallen since the global financial crisis, while their cost of equity has risen due to increased risk.

In some regulated sectors, consumers could clearly do better. Banking regulations push up costs and can weigh heavily on smaller firms as well as on consumers. In the pharmacy sector, competition is directly restricted.

In natural monopoly sectors, where super-profits account for 10% of what consumers pay, on average, it’s also difficult to conclude that consumers benefit.

But less concentrated markets may not make consumers better off. Many profitable big firms must have lower costs than smaller ones; otherwise they would lose market share.

For example, average prices at Coles and Woolworths are lower than IGA, even while profits are higher: it seems that some of the large chains’ scale economies are passed on to consumers. Regulation that limits the size of the largest firms might reduce profits, but could push costs and prices up.

What can policymakers do to get better outcomes for consumers? In the natural monopolies, regulators need to get tougher. For example, they could start regulating prices at airports, rather than just monitoring them.

Across the economy, regulators should continue to focus on protecting competition and preventing the misuse of market power. Government should increase the penalties for cartels and other concerted practices.

Governments could help cut entry barriers, for example by harmonising product standards to reduce trade costs, or freeing up zoning to make it easy for competing supermarkets to expand. And they should make it easier for consumers to switch between providers and control their own data in sectors like banking and even social networks.

There is also much that can be done where retail competition is not working well, such as in superannuation and in retail electricity.

But overall, Australia’s oligopoly problem is a lot smaller than many believe. It’s also not getting worse; our competition policy and regulation is broadly working well.

Authors: Jim Minifie, Productivity Growth Program Director, Grattan Institute; Cameron Chisholm, Senior Associate, Productivity Growth, Grattan Institute; Lucy Percival, Associate, Grattan Institute