Australia lacks an overarching population policy or strategy. Over the years, multiple inquiries have recommended such a policy. Population policies the world over typically focus on births and migration.
As part of post-war reconstruction, Australia adopted a 2% population growth target. Mass immigration was a defining feature, and couples were called on to populate or perish. Immigration was successful, but women were big losers in the push for births.
The 1975 National Population Inquiry proved a significant moment in Australian demography. The inquiry found that Australia should not seek to influence population, but should anticipate and respond.
Population policy was revisited in the 1990s with the National Population Council. Its 1994 report found no optimal population size for Australia, but again called for a responsive population policy of preparedness.
After an exhaustive inquiry, A Sustainable Population Strategy for Australia was released in 2011. This stopped short of recommending a population policy but removed any option of population limits. Change felt possible in shifting the narrative to a proactive endeavour concerning population matters, particularly evident in the National Urban Policy.
Despite such inquiries and recommendations to adopt a population policy, governments have so far resisted. Unsuccessful attempts at population policy can be understood in terms of difficulties in gaining political support and concerns about coercion.
But national population policy need not be coercive – unlike, for example, in India or China. Instead, it can be a series of targets and connected policy domains with oversight.
Presently, the policy landscape is disjointed. Parenting leave, family and childcare payments, and immigration are each somewhat responsive to population changes, but not prepared. Family payments have been shown not to increase birth rates.
Dr Karl Kruszelnicki fronted the Challenge of Change campaign.
What we know is that Australia’s population continues to age, so among the nation’s pressing issues is fewer taxpayers. The total age-related dependency ratio, of people aged over and under working age relative to the working-aged population, was 52 per 100 people in 2016.
While the child-dependency rate (0-14 year olds) is higher than the aged-dependency rate (people 65 and over), the rate of people aged less than 15 has steadily declined as the population aged 65 and over has driven increases in the so-called dependency burden.
The relative increase in people older than working age is increasing pressure on the economy and government budgets. While government spending on young people is substantial, the highest per person spending is among people aged 65 and over.
A robust workforce contributing income tax and services is essential to ensure current lifestyles are afforded to the young while also sustaining the public spending necessary for people over 65 years who have over their lives contributed to the nation.
With birth rates low and deaths increasing, natural increase is no longer driving Australia’s population. Immigration is increasingly relied on to offset the ageing of the workforce. Over half (54%) of Australia’s population growth is from net overseas migration.
Preparing for an older population
In a 2013 United Nations survey, the Australian government reported concerns about population ageing, a desire to increase the “too low” birth rate, but satisfaction with the level of net overseas migration. Interestingly, a preference for migration away from cities was also cited.
From current policy and discourse, you would not know these views were held. Most Australians also report a preference for the level of immigration to remain the same or be increased, contrary to sentiments we often hear.
Australia has time to prepare for, and make opportunities of, the challenges of an ageing population. Some countries are facing tough decisions now and it is interesting to watch the politics play out. What Japan, China and Germany show is that we need to take action now.
Insightful guides are in place already. South Australia has had a population strategy since 2004. Tasmania recently adopted one.
These state strategies focus on growth to curb economic downturn. What is important in these two cases is that both emphasise policy portfolio linkages, as well as evidence and reporting against targets without coercive measures.
What is a sensible approach to population policy?
A renewed, earnest and transparent population conversation is needed. With ever more reliance on immigration, we must go beyond the unhelpful pro-immigration versus pro-nationalism debate to consider our population prospects.
The key question is: how can Australia make opportunities of its demographic challenges?
Australia has the potential to be a global leader in innovative markets and research and development. An ageing population provides an interesting market opening; we just need to be smart about it. Without careful consideration, Australia will be merely a bystander in the increasingly competitive global market.
Policy connectedness should exist between portfolios. These include: health; housing; education, skills and training; employment; infrastructure; regional development; water and energy; environment; and migrant settlement.
We can invest more effectively in young people — our future workforce and economic lifeblood — if we consider a life-course approach to population dynamics. Family friendly, gender-equal workplaces will go a long way to ease the pressures of having children. Integral to this is affordable and accessible child care.
And establishing a ministerial portfolio overseeing population strategy would be a good start.
Author: Liz Allen , Demographer, ANU Centre for Social Research and Methods, Australian National University
South Australia’s new bank levy, projected to earn A$370 million over four years, seems to be constitutionally valid but it remains hostage to political machinations.
While precise details are sparse, the Major Banks Levy will target those institutions liable for the Commonwealth bank levy (Commonwealth Bank, ANZ Bank, Westpac, National Australia Bank and Macquarie Bank). It will impose a state levy of 0.015% per quarter of South Australia’s share (about 6%) of the total value of bank liabilities subject to the federal government levy.
By making Commonwealth grant payments conditional on the removal of a levy, the federal government could force South Australia to abandon its bank levy.
It’s here that South Australia can benefit from the cover provided by the federal government’s bank levy. The federal government would be forced to tread a very tight line if they try to argue that it is fine for them to tap the banks’ honeypot but not for the states to do it too.
With new sources of state funding rare, South Australian treasurer Tom Koutsantonis has exploited this political opportunity, potentially signalling a shift of power back to the states. Unsurprisingly, the banks have reacted with fury, mounting their own attack campaign and threatening reprisals.
Taxation powers in Australia
The constitutional validity of South Australia’s bank levy rests on the distribution of taxation powers in the Australian federation. The power of the states has been eroded over time as the Commonwealth gradually came to dominate the federation.
The Constitution assigns almost equal power over taxation to the states and the federal government. Under Section 51(ii) the federal government is granted a power to enact laws with respect to taxation, but “not so as to discriminate between states or parts of states”.
However, Section 90 grants the federal government the exclusive power to impose “duties of customs and of excise”. So a state tax will generally only be constitutionally invalid if it’s characterised as a duty of custom or excise, or if it is incompatible with a Commonwealth Act.
Back in 1942, the federal government used its power under Section 96 to gain an effective monopoly on income tax. Under the scheme, the federal government levied a uniform tax on income, then gave a grant to the states equal to the income tax they had collected on the condition they cease collecting income tax.
In South Australia v Commonwealth (1942), the High Court upheld this effective takeover of income tax. While states retain the right to levy income tax, the risk of losing Commonwealth grants (together with administrative cost and competitive pressures) has made the proposition unattractive.
The federal government has consolidated more power through the expansive definition given by the High Court to the meaning of “duties of excise” in Section 90. For example, in the court case Ha v New South Wales (1997) a majority of the court held that duties of excise are taxes on the production, manufacture, sale or distribution of goods. As this is an exclusive federal government power, the states are effectively prohibited from taxing goods – such as sales tax.
The states have instead been forced to rely on a range of relatively inefficient transaction taxes (that is, stamp duties on certain written documents), on land taxes, and on payroll tax (levied on the wages paid by employers). The narrow base of these taxes has seen the federal government come to dominate taxation revenue – collecting more than 80% of tax revenue in 2015-16.
This “vertical fiscal imbalance” leaves the states dependent on federal government grants, together with any conditions attached to such grants. As Professor Alan Fenna has observed, the states are left:
…scrounging for revenue in economically inefficient or socially undesirable ways and going cap in hand to the Commonwealth.
With opportunities for the states to introduce new forms of taxation being so limited, the proposed South Australian bank levy is something of a game-changer.
The legality of South Australia’s bank levy
The levy’s structure doesn’t appear to involve the taxation of goods in a way that would go against Section 90 of the Constitution. The banks are being taxed on the basis of the value of an asset class they hold – in a way that is comparable to land tax.
Given the small percentages involved, this levy does not seem to interfere with the federal government’s levy, and would arguably not be incompatible with it. While relatively novel, the tax appears on its face to be constitutionally valid.
However, the politics of the issue is far more vexed, as the dark shadows of the federal government tied-grants scheme loom over all matters involving state tax. As Western Australia has learned, raising state taxes can have catastrophic unintended consequences. After that State raised mining royalties during the mining boom, the Commonwealth Grants Commission drastically reduced its share of GST payments – down to 34 cents in the dollar.
The fate of the state levy remains uncertain, with the politics very much in flux. What is clear is that the other states are taking notice.
With growing frustration over fiscal dependence on the federal government, it seems we may be entering a new phase of innovation in state taxation. Perhaps the federation is not yet dead.
Author: Joe McIntyre, Senior Lecturer in Law, University of South Australia
Rising mortgage debt is affecting everything from employment to spending, as Australians approach retirement, our study finds. Higher levels of housing debt among pre-retirees are linked to them working for longer.
We found for a home owner aged 45-64 years, the chances of being employed are around 40% higher for every additional A$100,000 in mortgage debt owed against the family home.
There’s also a link between house price changes and household spending. For every A$100,000 increase in the value of a person’s house, annual household spending of home owners increased by around A$1,500. These home owners are willing to increase their spending because they’re able to borrow more against their home to finance it.
Long-run trends in mortgage debt
Australians are paying down their mortgages later in life. The percentage of home owners aged 25 years or over who are carrying a mortgage debt climbed from 42% to 56% between 1990 and 2013.
Mortgage debt burdens among pre-retirees have soared. For home owners aged 45-54 years, the incidence of mortgage debt has nearly doubled from 36% to 71%. Among those aged 55-64 years, this incidence has more than tripled from 14% to 44%.
These trends reflect at least two things. Higher housing cost burdens have resulted in a decline in home ownership rates among young people. Those able to access home ownership are doing so later in life and by taking on higher levels of debt relative to their incomes.
Australians are working longer because they are paying down their mortgages later in life.
Our modelling, based on the 2001-2010 Household, Income and Labour Dynamics in Australia (HILDA) survey data, shows that pre-retirees aged 55-64 years are 18% more likely to continue working for every A$100,000 increase in their mortgage debt.
On the one hand, unexpected increases in housing prices could have caused buyers considering home ownership to borrow more in order to buy a house, and encouraged homeowners to spend more by withdrawing the equity from their homes. These mortgagors then have to extend their working lives to meet higher mortgage repayments.
On the other hand, longer life expectancy may have encouraged many Australians to plan longer working lives. Carrying higher levels of mortgage debt later in life could be a financial tactic to finance their spending over a longer lifespan.
Borrowing more, spending more?
Our analysis found some differences between subgroups of home owners and between periods preceding and following the global financial crisis.
Before the global financial crisis highly indebted home buyers were more prepared to use their mortgages in order to bridge the gap between spending plans and income. After the crisis, home buyers with large mortgages were less willing to use their mortgages in this way.
In contrast, the spending plans of indebted households who both own their home and a second investment property seem more sensitive to house price movements since the global financial crisis. Property investors with mortgage debt increased their average yearly spending after the crisis from A$1,700 to over A$2,800 for every A$100,000 increase in their housing wealth.
On the other hand, for home owners with no investment properties, average yearly spending tightened from A$1,700 to A$1,500 for every A$100,000 increase in their housing wealth. This suggests investors with debt are not so risk-averse as other homeowners.
Housing, productivity and the economy
Mortgage debts have important economy-wide effects through interactions with labour markets and consumer spending.
Ageing is often associated with lower rates of labour force participation and declining physical and mental health, which can result in reduced productivity growth. If people are extending their working lives to repay higher mortgage debt, this could mitigate some of the productivity consequences of population ageing, albeit at the expense of greater exposure to debt in later life.
When real house values are rising, home owners and property investors are able to borrow more against their home to finance their spending. In the short run this can help offset the effect of stagnant wages (on their spending) and thereby sustain growth momentum in the economy.
But if wages fail to pick up, these higher levels of debt can be a drag on growth. High levels of indebtedness also increase exposure to house price and interest rate risk, and pose a threat to macroeconomic stability.
Our research makes a compelling case for considering housing differently, as essential economic infrastructure. Housing needs to be re- positioned from the periphery to a central place within national economic policy debates. This could be crucial to an understanding of how our housing system can promote rather than curb economic growth in Australia.
Authors: Rachel Ong, Deputy Director, Bankwest Curtin Economics Centre, Curtin University; Gavin Wood, Emeritus Professor of Housing and Housing Studies, RMIT University; Kadir Atalay, Senior Lecturer in Economics, University of Sydney; Melek Cigdem-Bayram, Research Fellow, RMIT University
The great Australia dream of owning your own home is still alive despite the various problems plaguing housing affordability, new Census data shows. Even though the overall home ownership trend remains strong, it’s masking other issues.
The latest 2016 Census data assesses what the national home ownership and rental rates are and how these vary location. It also gives us a picture of mortgage and rental costs.
Comparing home ownership rates since the 2011 Census, there’s a slow but steady decline in home ownership rates overall – down by 2.9% from 64.9% of all Australian households in 2006, to 62.0% in 2016. However, 7.4% of households did not state their housing tenure in the 2016 Census. This accounts for some of the variation in reported rates of home ownership decline.
This contraction is nowhere of the scale of equivalent falls in home ownership in the US and UK and New Zealand over the same period.
What’s more interesting than the overall trend, is the greater decline in outright home ownership, involving no mortgage debt, from 31.0% to 29.6% between 2011 and 2016. There’s also a lesser decline in home owners who are purchasing with mortgage debt 33.3% in 2011 compared with 32.4% in 2016.
The opportunity households now have to borrow against their mortgage loans for spending undoubtedly accounts for some of this change. Also contributing to this is home purchasers are less likely to reach retirement age with no remaining mortgage debt, in the same numbers as previous eras.
Another aspect of housing affordability is masked by these numbers – the wide variation in being able to purchase a home according to age and income. Recent evidence indicates would-be-home-owners try various means including very high mortgage debt and moving to outer urban locations away from employment and into smaller dwellings, to be able to buy a house. Some even delay having kids.
Census figures show that for people wanting to purchase a home, a change in state or city location may be an option. According to the data Darwin was the most expensive city to buy in, whereas Hobart was the cheapest for home purchasers.
For households across the income spectrum, 7.2% of purchasers are paying more than 30% of their income on mortgage costs, the data shows. This figure is likely to be far higher among the lowest income (40% of households) for whom such costs place them in housing poverty.
Given the national obsession with investment in private rental, it’s no surprise that the proportion of all Australian households now renting has also increased. Census 2016 results show the private rental sector grew in size, from 20.2% in 2006, to 22.0% in 2011 and to 23.6% in 2016.
In 2016 a total of 2,089,633 Australian households rented privately, either from real estate agents or private landlords.
The growth of the private rental sector largely reflects the high costs of home purchase. Many households who rent have a relative lack of security and control over rental increases.
For those unable to pay rent in the private market, social housing is likely to provide little relief. Census data shows overall rates of social housing declining from 4.7% in 2006 to 4.0% in 2016. In this context, the growth in rates of homelessness in the last decade is perhaps not surprising.
For Indigenous Australians, the housing picture is different. Census 2016 data show among households in which at least one resident is Aboriginal and/or Torres Strait Islander, 12.2% are outright owners, 25.9% are purchaser owners, 32.4% are renting privately. Around a fifth of households, 21.5%, live in social housing, reflecting targeted social housing programs in metropolitan, rural and regional areas.
Overall, home ownership has not changed as dramatically in the last decade, as some would have anticipated. However, it’s likely with the labour market being what it is and the adaptations people are making to try and buy a home, there may be longer-term problems to be seen in future.
Excessive household debt, polarisation of cities into low and high income earning areas and deepening family housing constraints indicate these Census figures likely mask bigger problems. This may translate over time into a more costly social problem, as increasing proportions of households require housing assistance of some form. Australian society could become even more divided on the basis of housing wealth and opportunity, if these trends continue, as we expect they will.
Authors: Wendy Stone, Associate Professor, Centre for Urban Transitions, Swinburne University of Technology; Kath Hulse, Research Professor, Centre for Urban Transitions, Swinburne University of Technology; Margaret Reynolds, Researcher, Centre for Urban Transitions, Swinburne University of Technology; Terry Burke, Professor of Housing Studies, Centre for Urban Transitions, Swinburne University of Technology
Does the Australian government have the policy, organisational and conceptual capacity to handle the country’s A$6 trillion housing stock? We ask this question in a newly released research report. The answer is critically important to both household opportunity and prosperity, and to the management of our largest national asset.
Clearly, the way the housing sector is managed has huge implications for household prosperity and opportunity. The public debate about high house prices, for example, reveals a gnawing anxiety that the distribution of housing as an asset has shifted too far in favour of a growing class of rentiers rather than households.
Housing also has clear national economic implications. This relates both to its scale as an asset, and to the way it provides shelter for those most in need where that need is clear.
Any misallocation of housing to low-productivity uses is potentially a major drag on the economy. This necessarily requires a wide understanding of productivity.
How is Australian housing policy framed?
We asked whether there is a clear systematic policy framework through which the Australian government understands the dynamics of the housing system and its contribution to productivity. We might expect such a framework to be clear and prominent given recent public and policy attention to housing questions.
To better understand the Commonwealth’s approach, we surveyed recent major housing policy reviews by the government. We assessed how housing was conceived in terms of its economic and social dynamics, its influence on productivity, and the role of policy in shaping these effects.
We also prepared an inventory of housing policy instruments operated by governments in Australia to understand how these were conceived within the policy reviews. We found 13 policy instruments that influence housing systems. These operate across housing, economic and fiscal policy and at multiple tiers of government.
A picture of incoherent policymaking
We were surprised to discover that few of the major policy reviews provided a systematic framework for understanding the economic role of housing.
There is thin evidence, at best, that these inquiries constructed or articulated a systematic conceptual understanding of the links between the housing system and economic productivity.
Even the Productivity Commission’s inquiry into planning and zoning, which focused on housing affordability, did not offer a conceptual framework for understanding the influence of planning regulaton on urban or national productivity.
Our review of these documents further shows there is no coherent framework articulating how policy objectives link to instruments and their effects. Housing policy, despite the $6 trillion value of housing, seems strangely incoherent. Australia doesn’t currently have a minister for housing.
The debate over negative gearing during 2015 and 2016 partly demonstrates our contention. During this period we counted at least six reports by non-government organisations articulating a view on the purpose and effect of negative gearing. Nowhere could we identify a government policy document articulating a clear, extended and analytically based position on this policy explaining its purpose and effects.
Our search for an explanation of these gaps in policy was not exhaustive. But we did assess the current administrative orders for housing within the Australian government.
Responsibility for understanding housing issues is divided. The Department of Social Services is responsible for social housing, rent assistance and home ownership. The Treasury has responsibility for housing supply policy.
Elsewhere, the Reserve Bank deals with monetary policy and financial stability. The Australian Prudential Regulation Authority APRA manages macroprudential policy. And the Tax Office (ATO) administers tax concessions. The Productivity Commission offers occasional advice on housing.
Yet there appears to be no obvious co-ordinating point in government that oversees housing. No one authority is responsible for formulating a coherent systematic understanding of housing and its effects on productivity and Australia’s economy or society generally. The National Housing Supply Council established in 2009 partly filled this role, but was abolished in 2013.
Further dispersion appears via COAG, which is convened by the Commonwealth government. COAG periodically marks out a housing issue, such as land supply, for discussion with state governments and to formulate policy recommendations. But COAG communiques are typically short political statements and not analytically founded.
Within state governments, responsibilities for different aspects of housing are typically spread across several agencies.
What needs to be done?
Our report demonstrates weaknesses in Australia’s approach to housing and housing policymaking. There is evidence this is deliberate. For example, the Coalition members’ minority response to the 2015 Senate inquiry into affordable housing rejected almost all of its policy recommendations. Many of these would rectify some of the deficits we have identified.
The weak formal coordination in housing policy contrasts with other sectors such as energy, defence, biosecurity, disability, heritage, drugs and road safety, among others. Each has a dedicated national strategy articulating policy objectives, problem conceptualisation and coordination of policy instruments.
It is doubtful that housing is less significant to the nation, economically or socially, than these sectors.
We recommend that the Australian government reflects on the position of housing within the architecture of government. The $6 trillion national asset that housing represents deserves much better understanding of its dynamics and effects on the national economy, including productivity.
We argue that Australia needs a federal minister for housing, a dedicated housing portfolio, and an agency responsible for conceptualising and co-ordinating policy. The current fragmented, ad-hoc approach to housing policy seems poorly matched to the scale of the housing sector and its importance to Australia.
Authors: Jago Dodson, Professor of Urban Policy and Director, Centre for Urban Research, RMIT University; Sarah Sinclair, Lecturer in Economics, RMIT University; Tony Dalton, Emeritus Professor, Centre for Urban Research, RMIT University
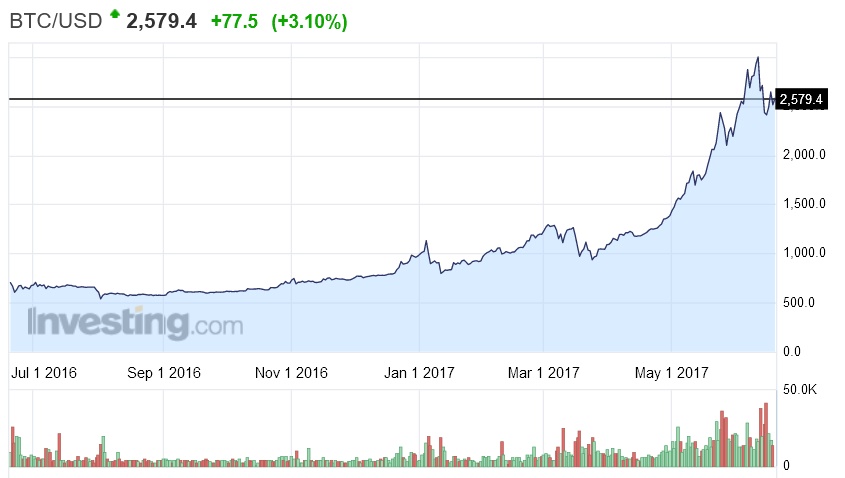
When there is a rapid growth in any of the crypto-currencies and assets such as Bitcoin, Ether, Zcash and others, many will call it out as a bubble. Indeed, on a relatively short time scale it clearly looks like a bubble.
The entire crypto-currency market capitalisation currently stands at around US$100 billion; it was US$60 billion one month ago. But Bitcoin was worth 1/100 of a US cent in June of 2009, 7 cents in June 2010, and US$7 in June of 2012.
Recently all eyes were on Ether. Over a 90 day period, Ether appreciated twice as quickly as Bitcoin did in late 2013, when Bitcoin crashed to around 35% of it’s highest value. Aside from the 2013 crash, Bitcoin has experienced smaller crashes many times since, but is now worth double its 2013 high.
In the longer term, these are fluctuations around a strong growth trend. Crashes will cause some to abandon the field. But signals of longer term growth in these crypto-currencies and assets point to a possible emergence of a new type of market, through the building of a new economic infrastructure.
Ether is the token of the Ethereumblockchain, a platform that runs “smart contracts” through a distributed online ledger that records transactions. It’s second only to the crypto-currency Bitcoin in price. Some believe it will one day overtake Bitcoin (a process dubbed “The Flippening”).
Price hikes not the sign of a bubble
Fundamental aspects of the technology that underpins crypto-currencies and assets are causing people to re-imagine, and then enact, new ways of creating and exchanging value online.
The key difference between Bitcoin and Ethereum is that you can use Bitcoin for payments, but you can use Ether to automate any number of processes using smart contracts.
While many use cases for Ethereum are still at the proof-of-concept stage, it is now attracting the attention of major banks, businesses and governments, all interested in the potential of the technology to provide greater efficiency and transparency in transactions. That normalisation has collapsed the implicit risk premium attached to this technology.
Venture capitalist Albert Wenger describes the current activity in crypto-currencies and assets as “fat protocol investing”. To explain what this is, take the example of the underlying internet and web protocols (TCPI/IP and HTTP), used to build and run websites. These are not able to store value – therefore they are “thin protocols” in Wenger’s terminology. So instead, people invest in companies that make software (applications) and hardware that rely on these protocols.
Companies such as Google and Facebook made a fortune by collecting and storing data generated by users through their online interactions. Meanwhile, users, and the developers who created internet and web protocol, received nothing in return. Blockchain is a “fat protocol” because it can be monetised, including incentives for developers but also for users. For example, the creator of JavaScript and co-founder of Mozilla Brendan Eich, recently released an Ethereum-based web browser through which users can be paid for the attention they give to advertisements.
What is making crypto-assets and currencies appear bubbly is the way in which many of these new platforms and applications have raised money through what are called initial coin offerings. An initial coin offering (a word play on ‘initial public offering’) is a mechanism by which developers sell the tokens associated with their platform to the public. Depending on the structure of the offering, buyers can usually then trade the tokens, creating secondary markets. As the founder of Ethereum, Vitalik Buterin, has noted, no-one has figured out the right model for these offerings.
This could be due to the immaturity of the Ethereum platform and ecosystem (which started development in 2013 and went live only in 2015). What we’re observing here is a new economic infrastructure being built and coming online. In tweets on Tuesday, Buterin distanced himself from initial coin offerings, stating he would no longer agree to be an advisor.
So while the current speculation in crypto-assets should make us pause, this is not speculative like tulips, or gold mining stocks. It is speculative like building a new city, in that infrastructure needs to be developed first before you get to see who moves there.
A further point to note is that investment bubbles are actually useful and important mechanisms for building new technologies because of the way they concentrate speculative resources on a new technology to facilitate exploration.
There is an enormous effort proceeding to building new crypto businesses and infrastructure on the Ethereum platform. If this platform does indeed begin to carry large parts of the global economy as predicted by Deloitte, a business consultancy, then it’s still massively undervalued.
These comments should not be construed as offering personal financial advice.
Authors: Jason Potts, Professor of Economics, RMIT University; Ellie Rennie, Principal Research Fellow, RMIT University
This week the US Federal Reserve, as expected, raised its benchmark interest rate by 25 basis points, to a range of 1-1.25%. This was the third such hike in the last six months.
Fed Chair Janet Yellen said:
Our decision reflects the progress the economy has made and is expected to make.
And whether the Fed view or the Summers view is the better one has tremendously important implications for what the Reserve Bank should do here in Australia.
The nub of Summers’s concern revolves around the implicit model of the economy that the Fed is using – and whether it still works in the economic world in which we find ourselves.
The general worry with keeping rates too low, for too long, is that inflation will take off. In the past, policymakers have worried – with good reason – that waiting to raise rates until inflation starts rising much is dangerous because it can get out of control.
If one is not going to wait to see what happens to inflation, then one needs a way to predict the path of it. The traditional approach that policymakers have taken is to look at the relationship between unemployment and inflation – the so-called Phillips Curve – and predict future inflation based on unemployment.
Summers prefers what he calls the “shoot only when you see the whites of the eyes of inflation” paradigm. This – as the imagery suggests – involves waiting until the last possible point before raising rates. In other words, be really sure that the inflation is happening.
This makes sense if the old model is broken, and Summers makes a persuasive case that it is.
First, he points out that the Phillips Curve (the allegedly stable relationship) may not even exist. And even if it did, scholars have pointed out that it would be very hard to estimate statistically the Goldilocks point where unemployment is such that the rate of inflation is stable (the so-called Non-Accelerating Inflation Rate of Unemployment or NAIRU).
Second, Summers offers a different model of the world – at least in part. That model is one where advanced economies – like the US and Australia – are suffering from “secular stagnation”.
According to Summers, the implication for monetary policy of this are as follows:
there is good reason to believe that a given level of rates is much less expansionary than it used to be given the structural forces operating to raise saving propensities and reduce investment propensities.
I am not sure that a 2 percent funds rate is especially expansionary in the current environment.
Moreover, he sees asymmetric risk with getting it wrong, going on to say:
And I am confident that if the Fed errs and tips the economy into recession the consequences will be very serious given that the zero lower bound on interest rates or perhaps a slightly negative rate will not allow the normal countercyclical response.
Maybe the combination of a fire hose of global savings chasing too few productive investment opportunities has changed what level of interest rate can provide a serious boost to economic activity.
Which bring us to Australia. We, too, have relatively low unemployment by historical standards (the ABS just announced a drop in May to 5.5%), yet wage growth is remarkably low. Those two things happening together suggests that our old understanding of the labour market is off the mark. That low wage growth is a major driver of the low inflation we are also experiencing.
If Summers is right, and there isn’t some big point of difference between Australia and the US in this regard, then the unmistakable implication is that the RBA should probably cut rates – perhaps twice – later this year.
But there is that whole housing price thing in Australia. A rate cut could fuel further price rises which, as bad as that is for affordability, is also deeply problematic for financial stability.
Yet, if the Australian economy really does need a rate cut, and governor Philip Lowe holds steady because of housing price fears, then that could trigger a further slowing of GDP growth, put wages under even more pressure, and trigger a recession itself. And that would be bad news for financial stability, too.
The Australian Law Reform Commission wants to give banks the responsibility to protect vulnerable customers from financial abuse. But there are a number of issues with this approach. Its success depends on the good faith of the banks, and could leave some customers uncovered and the banks with no one to report abuse to.
In a new report on elder abuse, the commission recommends that the Code of Banking Practice be amended so that banks take “reasonable steps” to prevent financial abuse.
But the code is voluntary and some banks have been lax in the past, meaning some customers won’t be covered. “Reasonable steps” still needs to be defined, to ensure all banks meet a standard. And we need transparency to know what financial abuse banks are dealing with, how and when.
Around 9% of older people living in the community are financially abused. It is likely the number is even higher among those with cognitive impairment or who live in institutions. Financial exploitation of older people is increasing and mostly perpetrated by those close to the victim, including family members.
The amendments to the code will include measures such as enhanced staff training to recognise elder financial abuse, an obligation to report suspected abuse, and recommendations to tackle the problem of forced guarantees for mortgages and other loans to relatives.
Can the banks protect vulnerable people?
Elder financial abuse is difficult to detect. However, banks and financial institutions are in a unique position to see it. Banks have face-to-face contact with customers, play a role in providing third-party authorisations, monitor electronic transactions and oversee lending.
But the Code of Banking Practice is voluntary, and many in the industry are not signed on. This could lead to troubling gaps in coverage. Institutions that do not sign up to the code will be under no obligation at all.
Although some have imposed protocols to address elder financial abuse, a recent interview with Kirsty Mackie, chairwoman of the Elder Abuse Committee of the Queensland Law Society, noted that training of front-line banking staff, collaboration between institutions, understanding of the bank’s legal position, and preparedness to act in the customer’s best interest were all lacking.
The commission also settled on a standard that requires banks to take “reasonable steps” to prevent financial abuse, despite Legal Aid NSW recommending that a higher standard be adopted. The proposed alternative was to require banks to “take all steps” to prevent financial abuse.
A standard based on what is “reasonable” is problematic as context matters; what one bank may regard as a reasonable response to suspicions of elder abuse may differ from what a court or the general public thinks.
In the United States, some states impose mandatory reporting of elder financial abuse, but Australia looks set to make reporting voluntary. This leads on to the issue of transparency.
We need to know under what circumstances banks will keep matters “in house”, to decide if these are appropriate. Criteria for reporting suspected financial abuse need to be established, as well as a body to report to. The commission has recommended the implementation of an adult guardian to which complaints could be referred. All these issues remain unclear and will require more discussion.
A related concern is the potential ramifications for people who make reports. In Australia, whistle-blower protection remains inadequate. Indeed, the Australian Banking Association submission to the Australian Law Reform Commission suggested that immunity be granted to banks that report instances of elder financial abuse.
Finally, given that banks will deal internally with most instances of elder financial abuse, it is important that we ensure the bank’s response balances the autonomy of older people while addressing elder financial abuse.
Where to from here?
The commission recommendation is welcome and will bolster the safeguards already in place. More discussion will be needed in the aftermath of the inquiry to ensure the recommendations are implemented and their potential realised.
The reality is that success will rest largely on the good faith of the banks. There must be willingness to build a collaborative and consistent approach to acting on elder financial abuse and to ensure rigorous internal procedures are put in place and followed. Employees who make reports of elder abuse must also have adequate protection.
This, in turn, must feed into an appropriately resourced entity where the most serious matters can be directed.
Author: Eileen Webb, Associate Professor, Curtin Law School, Curtin University
In all the noise and fury surrounding the bank tax, a more effective alternative proposal to implementing it has apparently been forgotten. In 2015 South Australian Premier Jay Weatherill proposed that banking should be subject to the GST.
This idea had much sounder economic underpinnings than the current levy, would have raised much more revenue (maybe three to four times), and would have applied to all banks rather than just the big banks. Of course, that last feature would have united the banks in opposition, in contrast to the current divide and (hopefully) conquer approach of Treasurer Morrison.
Unlike other industries, the traditional business of bank deposit taking and lending is exempt from GST. This creates economic distortions and omits a large part of the economy from being taxed.
The omission of banking from the GST is a product of history, because applying it to the banks was seen as too complicated. The reason lies in the nature of the GST as a “value added” tax.
Essentially the 10% tax is added to the sales price of an output good or service, but the seller obtains a GST credit for the tax component of the price of input goods they have bought. The historical view was that it is difficult to identify what are banking sector inputs and outputs, and thus value added.
Is providing a deposit account an input (in making loans) or an output in its own right? And there is generally no explicit fee charged for the service of intermediation between depositors and borrowers, with bank costs and profits covered by the interest rate spread.
The argument that its too complicated is no longer a sufficient justification. At one level the aggregate “value added” by a bank is easy to estimate. It’s the sum of profits and wages. The size of the profits and wage bills of the banks by itself indicates the potential tax revenue foregone and potential economic distortions caused by favourable tax treatment of banking services.
At the product level, while banks receive input tax credits on purchased inputs they do not add a GST cost to the price of deposit or loan products and services. Introducing GST would mean that banks would need to add the tax on their value added to prices charged (directly or implicitly via changes to interest rates) but would be able to utilise the GST credits they currently get on purchased inputs.
The historical complication was determining how much of aggregate value added and various input costs to allocate to each product. How should the cost of bank premises or teller time be allocated between individual deposit and loan customers?
That is a difficult problem. But banking systems of activity based costing, product and divisional profitability have evolved to enable an application of the GST. It might be an imperfect application, but that is arguably a lot better than none at all.
Exempting traditional banking services from GST is a significant cost to tax revenue. But it also creates economic distortions.
One, at an aggregate level, is that banking services get a tax advantage over other forms of economic activity – perhaps helping to partially explain why the financial sector has grown as a share of total GDP.
Another distortion lies in effects on different types of customers. Yes, application of GST to banks would raise the cost of banking services to all customers – since it is unrealistic to expect that this tax, even though effectively levied on bank profits plus wages and salaries, would not be passed on.
But it would mean that business customers would get GST input tax credits on their purchases of banking services to offset against the GST bill on their sales. Households, as consumers would not get that benefit, reducing tax induced distortions to their use of banking services relative to alternative expenditures.
The detail of the GST (including federal – state revenue sharing implications) is a mystery to most people, so it’s easy for counter-arguments to be produced to obfuscate and obstruct the proposal to apply it to banking. But it has merit and warrants serious consideration.
It’s highly unlikely that Treasurer Morrison will want to deal with the fall-out from adding a bank GST impost on top of the “big bank tax”. But perhaps, placing a sunset clause on that and using the lead time to develop a coherent plan for applying GST to banks is worth considering.
Author: Kevin Davis, Research Director of Australian Centre for FInancial Studies and Professor of Finance at Melbourne and Monash Universities, Australian Centre for Financial Studies
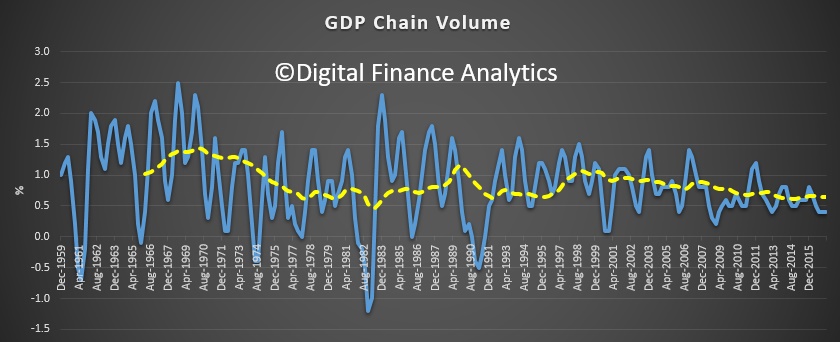
Data from the Australian Bureau of Statistics (ABS) shows the pace of growth of the Australian economy slowed in the March quarter to 0.3 per cent in seasonally adjusted chain volume terms. Through the year, GDP grew 1.7 per cent.
Investment in new housing fell by 4.4 per cent in the March Quarter 2017 which brings the sector down from record high investment in December 2016 and back to levels similar to those experienced at the start of 2016.
It’s now been 103 quarters (25 years and 9 months) since Australia last had consecutive quarters of negative growth in real gross domestic product (GDP), in the March and June quarters of 1991.
Contrary to much-repeated claims, the Netherlands didn’t experience more than a quarter-century of economic growth without consecutive quarters of negative real GDP growth between the early 1980s and the global financial crisis.
The Netherlands’ real GDP declined by 0.3% in the June quarter of 2003, and by 0.01% in the September quarter of that year, according to data published by Statistics Netherlands and, separately, by the OECD. So, at best, the Netherlands went for only 22 years without experiencing a recession. Australia surpassed that benchmark in 2013.
Yes, that second quarterly decline in 2003 was almost imperceptible. But sporting records are delineated by margins as small as one one-hundredth of a second, so we can’t blithely discount a -0.01% fall in real GDP as “not relevant”.
Even if you blinked and missed that tiny second successive decline in real GDP in the September quarter of 2003, the Netherlands still wouldn’t hold the record for the longest run of continuous economic growth. That belongs to Japan – which, according to OECD data, went from the March quarter of 1960 to the March quarter of 1993 without ever registering two or more consecutive quarters of negative growth in real GDP. That’s 133 quarters, or more than 33 years.
Indeed, if Japanese GDP data were available on a quarterly basis earlier than 1960 it’s likely that this run of continuous economic growth would have been even longer, perhaps as long as 38 years, inferring from annual data available back to 1955. So Australia would need to avoid consecutive quarters of negative real GDP growth until at least 2024 if it is truly to be able to claim this “world record” as its own.
Even more importantly, the definition of a technical recession as (two or more consecutive quarters of negative growth in real GDP) is, as former RBA Governor Glenn Stevens said, “not very useful”. It was originally proposed in December 1974 by Julius Shishkin, who at that time was the head of the Economic Research and Analysis Division of the US Census Bureau (now the Bureau of Economic Analysis, which publishes the US national accounts).
It’s not used to identify recessions in the US. It takes no account of differences over time, or as between countries, in the rates of growth of either population or productivity – which are the key determinants of whether a given rate of economic growth is sufficient to prevent a sharp rise in unemployment. This is something which most people (other than economists) would use to delineate a recession.
While Australia has avoided consecutive quarterly contractions in real GDP since the first half of 1991, we’ve had two periods of consecutive quarterly declines in real per capita GDP (in 2000 and 2006). We’ve also had two periods of consecutive quarterly declines in real gross domestic income or GDI, which takes account of income gains or losses accruing from movements in Australia’s terms of trade (in 2008-09, and in 2014). Perhaps most meaningfully of all, Australia has had two episodes where the unemployment rate has risen by one percentage point or more in 12 months or less (in 2001 and 2009).
That’s still a better track record than almost any other advanced economy during the past quarter-century or so – and it reflects well on the quality of economic management (and the nature of our luck) over this period. Nonetheless, we shouldn’t be in the business of awarding ourselves prizes to which we’re not entitled.
And the long term trend also highlights a slowing, so we need new growth engines if we are to keep the growth ball in the air!
Growth was recorded across the economy with 17 out of 20 industries growing during the quarter. Strong growth was observed within the service industries including Finance and Insurance Services, Wholesale Trade, and Health Care and Social Assistance.
Agriculture, Forestry and Fishing decreased after strong growth in the previous two quarters, while Manufacturing decreased for the tenth time in eleven quarters.
Chief Economist for the ABS, Bruce Hockman said; “This broad-based growth was tempered by falls in exports and dwelling investment. Dwelling investment declined in all states, except Victoria, and overall is the largest decline for Australia since June 2009.”
Compensation of employees (COE) increased 1.0 per cent in the March quarter, a pick up from the negative growth recorded in the December quarter, and is consistent with other labour market data. COE is still only 1.5 per cent higher through the year, continuing to contribute to the reduction in the household saving rate. The household saving ratio fell to 4.7 in the March quarter, half the rate it was in March quarter 2013.
Mr Hockman said; “Even though there was a fall in dwelling investment this quarter, levels are still historically high. There was also positive growth in household consumption, albeit in non-discretionary items such as electricity and fuel purchases. The softer growth in household consumption is broadly in line with modest income growth.”