The Conversation has published many articles by Australia’s foremost academics on policies that affect housing. In the lead-up to expected announcements in the federal budget in May, we review the arguments in the articles since January 2016 – 81 were identified, of which 58 concerned housing policy.
This article focuses on the most frequently mentioned aspects of housing policies and other policies that had unintended effects on housing – fiscal policy, land supply and planning approvals, and affordable housing. A concern with politics and inequality was a consistent theme. Recent articles have discussed a possible housing bubble.
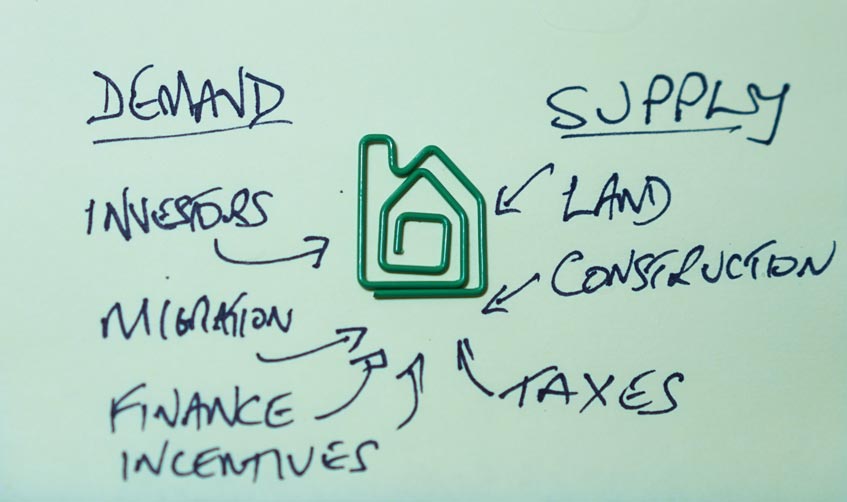
This article considers demand-side market distortion, supply-side blaming, and inequality. The second article will consider housing affordability and prospective policy changes.
Demand-side distortions
The discussion of fiscal issues most often involves the following government responsibilities:
- negative gearing and capital gains tax exemptions – a federal responsibility;
- stamp duty (state government); and
- the need to replace stamp duty with land taxes and to implement value-capture taxes on unearned rises in land value (state and local governments).
The First Home Owner Grant and the use of superannuation savings to buy housing were seldom mentioned. The same is true of the Reserve Bank and the role of the Australian Prudential Regulatory Authority in regulating housing lending.
The macroeconomic implications of fiscal issues were largely not included in the housing debate. The irony is that both major parties support market distortions – the Coalition government somewhat moreso than the Labor opposition.
This is where politics enters the picture. It is recognised that:
70% of voters own their houses … Housing accounts for more than 60% of the value of total assets held by Australians.
Home owners have a vested interest in stable, if not increasing, housing prices. As a result, it was observed:
The default position for politicians is to sound concerned about housing affordability, but to do nothing.
Reading the articles caused me to think the debate should be framed somewhat differently and focused on market distortions. These are a negative when policies:
- give rise to price distortions;
- divert capital from more productive investments to less productive ones;
- divert consumption from other goods and services and associated jobs as a result of inflated housing prices and mortgage payments;
- create risks: household debt and exposure to interest rate rises, bank mortgage lending, the housing market, the national economy;
- raise transaction costs;
- reduce labour market efficiency by discouraging labour mobility; and
- exacerbate inequality.
Market distortions, when transparent, are positive if they serve social ends like affordable housing and reduced inequality.
With some variation in interpretation, Conversation authors agree that negative market distortions arise from the fiscal policies listed earlier. Negative gearing and capital gains tax are “perverse incentives in the tax system”. Together, they have “simply added fuel to the fire” of increasing housing prices.
Negative gearing is … a subsidy for buyers … The problem is one of too many buyers willing to pay high prices, and negative gearing is designed to create more buyers willing to pay more.
So negative gearing encourages people to invest in property, and it particularly encourages them to invest by borrowing most of the price of the house … This is a very odd kind of housing and investment policy, seemingly designed to encourage people to over-extend and expose themselves to big risks if property prices were to fall.
Capital gains tax is “diverting capital from other productive investments in the expectation of tax-free capital gains”.
Lopsided lending for private housing has diverted finance away from business investment.
The articles also identify distortions to the economy, household debt and Australia’s budget deficit. An example is:
… the unusually generous treatment which the Australian tax system gives to the costs of and returns from debt-funded property investment.
And, referring to a possible housing bubble:
… double-digit increases in house prices, combined with unprecedentedly high household debt (more than 120% of GDP, the third highest in the world) and household debt servicing ratios (also the the third highest in the world), make for a precarious situation.
… the CGT exemption cost the budget A$46 billion in 2015-16. Removing the exemption altogether would wipe out the budget deficit in one swoop.
Another author notes that by:
… making homes default savings accounts essential to our long-term welfare security … we have come to depend on them for much more than housing … A welfare system that relies on home ownership in a globalised era is … critically vulnerable.
The articles on market distortions lead to firm conclusions. Fiscal policies that benefit home owners significantly distort the economy, inflate housing prices, and create risks that permeate from households to the national economy.
Supply-side blaming
It must be noted from the start that:
New supply is a small fraction of the total stock of dwellings (about 2% in Australia). Prices are set by the total housing market …
Discussion of housing prices that singles out supply-side issues is thus poorly grounded. This is contrary to Treasurer Scott Morrison’s view:
The issue here is fundamentally about supply.
He seems to believe that:
… the most important factor behind rising prices has been the long-running impediments to the supply side of the market.
Morrison seeks to push states to remove residential land use planning regulations that are supposedly unnecessary and impeding the supply of housing.
Several articles observed that it is easy for the federal government to express dire concern about affordability and to blame state and local governments for planning and building regulations slowing the supply of land and housing. State governments sometimes repeat this mantra, blaming local governments.
It was observed that home owners are susceptible to scare campaigns by property sector bodies about the claimed impact of possible fiscal reforms It was also observed that Morrison was the Australian Property Council’s national policy and research manager from 1989 to 1995, and is well versed in blame shifting.
Are the supply-side problems dire? It appears not. In Sydney and Melbourne:
… approvals are running at about double the actual dwelling construction levels, so “fixing” the planning systems is unlikely to have much impact on dwelling supply levels.
Growth in the national housing stock has kept pace with population growth for almost a decade.
Developers release land to the market at a rate that sustains prices.
Developers … simply won’t allow supply to get ahead of demand in a way that would put significant downward pressure on prices. Dwelling approvals in Sydney and Melbourne are running way ahead of building starts, but housing projects are released in stages to avoid swamping the market.
As a result:
Record construction rates have co-existed with unprecedented and ongoing property price hikes.
The issue is less the scarcity of land than speculative acquisition of land. The developers benefit from unearned increases in value arising from zoning changes, and then from a managed release of land to the market.
For these reasons, some articles proposed taxes should accompany rezoning. A vacant land tax was also mentioned.

Developers are unlikely to release land at a rate that improves affordability by lowering prices. Dan Peled/AAP
Many articles also worried about where land is being released. The need for planning and the importance of location have long been evident:
In his 1972 election campaign, Gough Whitlam loudly proclaimed that in modern Australia an individual’s health, wellbeing and life chances were shaped more by where they lived than the job they held, their religion, race or ethnicity.
Promoting inequality
In effect, all home ownership in Australia is subsidised. It’s a form of social welfare biased in favour of the wealthy. For example:
… Australian governments have effectively subsidised housing through taxation incentives for home ownership.
For instance, the exemption from capital gains tax:
… results in the payment of income support to those with substantial wealth tied up in their principal residence.
… the current benefits of exempting the main residence from CGT flow mainly to high-income earners, with more than 50% of the benefit flowing to the top 20% of households … [capital gains tax] is a perk for the rich.
… negative gearing is a tax deduction … the higher your marginal tax rate, the more you get. Someone on $200,000 will receive about half their loss back. Someone on $30,000 will only get about a fifth.
… most of the gains go to a small subset of investors with lots of properties and on very high incomes. The “mums and dads” get a relative pittance.
In addition to fiscal measures:
… the lack of well-located affordable housing is an economic productivity concern as well as a social problem.
Intergenerational inequality in home ownership is not included here. While often mentioned, it is “framing the housing affordability question the wrong way”. The divide is determined by class and perpetuated by those with wealth in property and the potential for intergenerational wealth transfer in the housing market.
A specific insight concerns the geography of mortgage stress. Mortgage stress is more a result of household income than the price of the house. Rather than Sydney and Melbourne, where mortgages are highest:
… mortgage stress is highest in Tasmania and South Australia … Households in regional areas are also facing more mortgage stress than their city counterparts.
If attention turns from house prices to mortgage stress, the geography of housing angst turns to regional Australia and to “employment and income statistics”.
Beware simplistic mantras
It is hoped this article leads to some introspection regarding the causes of housing affordability problems. Australia has for too long persisted with the mantra of housing prices being caused by problems of supply.
This is not a political statement. It was Labor that established the National Housing Supply Council. The emphasis on supply is so very misleading. The focus should be on the functioning of the housing sector and on those unable to enter the housing market.
It is hoped as well that this article has caused some concern regarding the macroeconomic distortions and productivity costs associated with housing policies and, more to the point, policies that are not intended to affect housing.
The failure to resolve housing issues, besides being thoroughly unfair, is also a failure to improve the productivity of Australia’s economy.

 Australia undertakes a compulsory long-form census – where detailed information across several areas is required of every individual respondent – every five years.
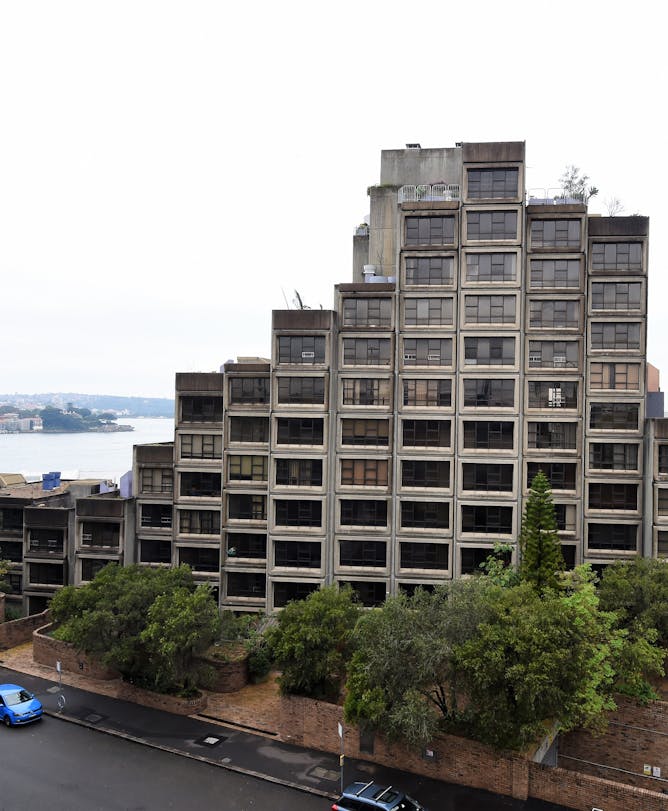


