Centrelink data-matching problems show the need for a government blockchain

From The Conversation.

Governments across the globe are experimenting with the blockchain, the technology behind Bitcoin, as a way to reduce costs and provide more accountability to the public. In Europe alone, the United Kingdom, Ukraine and Estonia are experimenting with blockchains to fight corruption and deliver public services.

Australia, too, is looking at what a blockchain might achieve. The recent problems with Centrelink’s automated data-matching system show precisely where a government blockchain would fit in.

Rather than siloing our data in government agencies, we could create a single source of information. This would speed up our interactions with government, while reducing errors and fraud.

What is a blockchain?

The blockchain is a kind of public database, one stored simultaneously on a bunch of different computers. When a new transaction occurs it is verified (otherwise known as “mining” or “consensus”), encrypted and added to the database.

The most famous example of the blockchain is Bitcoin, a crypto-currency built upon the blockchain. However, the blockchain is suitable for many other applications, not just financial transactions. For example, the blockchain could be used to authenticate that a diamond has not come from an illict source, or for buying and selling property.

A government blockchain

For the government’s purposes, the killer feature of the blockchain is that it is a way to record transactions so that they are transparent and cannot be altered or tampered with. When used to track fish through a supply chain, for instance, it allows customers and restaurants to follow where the fish has been and have confidence in the data.

When applied to a government context, these capabilities could be useful for collecting tax, delivering benefits, or regulating business. From the public’s point of view, this could enable us to track government spending, eliminate fraudulent transactions, reduce errors in data processing and speed up service delivery to almost real time. It could be useful almost anywhere records are kept.

All the while the public could be more confident about the accuracy and integrity of the data being held.

In practice

The Australian government makes benefit payments and provides support services through Medicare, Centrelink and Child Support services. It also collects information through numerous other agencies, such as the Australian Tax Office. A government blockchain could record the transactions about a citizen and link together information about health, welfare and child support.

The information would be entered only once into the blockchain by any one of these agencies. There would be no need for the data to be re-entered or matched again. Thus errors that occur in data processing as information is passed on down the line will be eliminated, avoiding some of the issues with the current Centrelink system.

Further, once data is entered it cannot be altered or changed in any way without proper authentication. Any authorised officer within the government could then access the information in the blockchain, avoiding a paper-pushing exercise between government departments. All of your data would be in one place.

We could go even further, as the blockchain would also allow other services to be processed through an app, as the UK is trialling with welfare payments.

The overall cost savings, reduction in bureaucracy and increased responsiveness to helping people in need could be immense. All we need is the government to invest in its own blockchain.

The challenge is making it legitimate

The essence of a blockchain is to reduce the reliance on centralised systems (such as the government), replacing it with a system with inherent accountability, transparency and trust. The original blockchain concept achieved this by being open, like the internet (also known as unpermissioned), relying on independent, anonymous “miners” to validate transactions. This guarantees the integrity of the data as no-one knows who the miners are to bribe or bully them into underhanded actions.

However, some might view a government-run, “permissioned” blockchain with suspicion. The trust of the public would need to be gained. A government blockchain would not be open, and we would have to rely on the government to approve all of the transactions. This negates some of the benefit offered by a blockchain. The legitimacy and trust would have to come from the government itself.

Thus a government-run blockchain would not be without its challenges. But if an Australian government blockchain is developed and allowed to succeed, then the potential benefits could be enormous. Society as we know it will be disrupted!

Author: Christine Helliar, Professor School of Commerce, University of South Australia

Trump’s brand of Carrier-style dealmaking won’t work

From The Conversation.

In late November, President-elect Donald Trump announced that he had reached a deal with Carrier to keep about 800 manufacturing jobs in Indiana from moving to Mexico. After the announcement, we learned that the Indiana Economic Development Corporation would give US$7 million in tax credits and grants to Carrier’s parent company in exchange for keeping the jobs in the state.

Trump proudly praised the agreement as a “great deal for workers” and said that it was part of a larger approach to keep jobs at home, saying “this is the way it’s going to be.”

Having the chief executive of the United States negotiate individualized deals with corporations is certainly a new approach to economic policy nationally, though it is not without precedent. In fact, state governments have been negotiating targeted incentives with corporations for decades.

My research focuses on why states use incentives to attract and retain investment from corporations and whether they are effective. My work, as well as that of many others, shows that these deals do not create the jobs and economic growth they are purported to.

A common economic tool

Every year, states spend billions of dollars to entice companies to create jobs within their borders. These inducements include some combination of property, sales and income tax credits and rebates, tax abatements, cash grants and cost reimbursements.

The deals are meant to reduce costs for the businesses that receive them in order to encourage their investment and job growth in a particular location. The most prominent packages usually grab headlines nationally.

In 2013, for example, Boeing received $8.7 billion in tax breaks from Washington state to secure the production of the 777x. This record-breaking package came shortly after Boeing had received $900 million from South Carolina for opening a new 787 assembly plant in Charleston.

Other examples include Tesla receiving $1.3 billion from Nevada in 2014 to subsidize a battery factory outside Reno and the Los Angeles Rams collecting $180 million in sales tax revenue from Inglewood for relocating there from St. Louis this year.

Just as Carrier threatened to move jobs to Mexico and promptly received a tax break, so too did Sears receive millions from Illinois to keep its headquarters in Chicago back in 1989.

From 1984 to 2012, incentive spending increased in the states from about $500 million per year to about $13 billion per year, according spending data gathered by the Good Jobs First Subsidy Tracker.

Has it worked?

Despite the hundreds of billions of dollars in incentives thrown their way, many companies have still decided to move more manufacturing jobs and corporate headquarters overseas.

This is because corporations consider many other factors when making decisions about where to build a factory or establish a tax home. In a 2016 survey, incentives lagged behind skilled labor, labor costs, highway access, corporate tax rates, available buildings, construction costs, proximity to markets and quality of life as important factors for location decisions.

For example, scholars have found that the Sun Belt has been able to attract investment away from the Rust Belt because it has lower wages but similar access to the interstate highway system.

In other words, jobs move (or don’t) based on the overall range of costs facing employers, which are determined by larger economic trends and policies and not necessarily by individually negotiated deals. When subsidies do matter is when corporations are choosing between equally strong locations. In those situations, incentives serve as “deal sweeteners” but don’t change the fundamental reasons for why the location was considered in the first place.

In light of the realities of corporate location decisions, there is scant evidence to support the arguments that targeted incentives produce economic growth. Rather, the evidence shows that they tend to fail to achieve their intended goals.

Often, subsidies fall short of job creation targets and fail to create growth, even if they retain jobs. As University of Iowa scholars Alan Peters and Peter Fisher argue, based on a review of several studies of their impact, “incentives work about 10 percent of the time and are simply a waste of money the other 90 percent.”

One reason why scholars have struggled to measure the impact of incentives is because of the complexity of the economy. Economic growth is affected mostly by national and international forces. State economic development strategies have little effect when compared with broad national economic policies.

The wrong kind of impact

Subsidies still can have an effect on economic behavior, just not in the way they were intended, such as by encouraging rent-seeking.

Critics of the Carrier deal have already noted that Trump may have opened the federal government up to increased threats from companies to move overseas unless they receive more incentives (aka rent-seeking). In the days following the Carrier deal, Ford Motor (already one of the largest recipients of state-level spending) expressed a willingness to make a deal with Trump to retain jobs scheduled to move overseas. In a first move, Ford announced that it had canceled a planned investment in Mexico and will instead invest $700 million in its Flat Rock, Michigan, plant.

There is also some evidence that incentives can exacerbate economic inequality.

Incentives, when used to influence location decisions, tend to be awarded to the largest and wealthiest corporations. These corporations need the money the least of all businesses and usually receive the money for making investments they likely would have made anyway in order to remain competitive. The result is that fewer resources are available for education, workforce training and social services. As a result, the gap between rich and poor tends to grow.

Raising red flags

While it is laudable that several hundred Indianans get to celebrate the holiday season with their jobs secure, evidence from the states raises red flags on the viability of targeted incentives as a national policy for growth.

Not only would Trump be needing to negotiate several packages per week in order to have a noticeable effect on the U.S. economy, doing so opens the government up to increased demands for subsidies, most likely from the wealthiest corporations, and could exacerbate income inequality in America.

Author: Joshua Jansa, Assistant Professor of Political Science, Oklahoma State University

We need to find new ways to measure the Australian labour force

From The Conversation.

Over the last few years, we’ve seen a massive shift in the way we work. Thousands of Australians have abandoned the traditional 40-hour work week to work fewer hours or take on ad-hoc work, such as driving for Uber or doing odd jobs on Airtasker.

But the way we measure the labour market has not kept up. We still rely on the Australian Bureau of Statistics’ labour force survey, a survey from the 1960s conducted according to international conventions that is no longer appropriate for today’s labour market.

Today’s economy – one of independent contractors, ad-hoc work, irregular and flexible hours – needs a new form of measurement.

How the government measures the workforce

Every month the Australian Bureau of Statistics (ABS) surveys about 0.32% of the civilian population aged over 15 years about their employment status.

In short, you’re counted as employed if you completed at least one hour of paid work in the week before the survey.

But this doesn’t sound quite right. Clearly, one hour of paid work per week doesn’t fit most people’s idea of employment.

In fact, over one million workers are counted as “underemployed”, meaning they would work more hours if they could. This raises the question of whether these people should really be considered “employed”. The answer depends on what policy question you are trying to address.

Is our unemployment rate right?

Let’s get right into how our unemployment rate is calculated.

If respondents haven’t done any paid work in the last week, they are asked two further questions – first, have they actively sought work in the last four weeks, and second, are they currently available to start work? They are only considered unemployed if they answer yes to both of these questions. Otherwise, they’re not counted as part of the labour force.

This means full-time homemakers, carers, the ill and non-working retirees aren’t considered unemployed.

The labour force is the sum of the employed and the unemployed. The unemployment rate is the percentage of the labour force who are unemployed.

Lastly, the participation rate is the percentage of the population aged 15 and older who are in the labour force. According to the latest ABS trend estimates, the participation rate stood at 64.5% in November, no change from October.

The participation rate has been consistently trending upwards over time for women and falling for men. This does not mean women are increasingly doing more work but that over time they have switched from unpaid to paid work. One of the main reasons for falling participation among men is that unskilled manual jobs for older men have been declining over several decades and many men have been reclassified as unemployed, disabled or retired.

More issues with the survey

The Labour Force Survey only provides a measure of employment and not the number of jobs. For example, a person might work 20 hours per week at a supermarket and 10 hours per week as an Uber driver. Employment is always classified according to the “main job”, so the ABS deems them as one person employed part-time (working fewer than 35 hours) in the retail industry.

If that person worked five more hours as an Uber driver the next week, they would be classified as full-time (35 hours) but the supermarket job would still determine the industry in which they are employed.

The crucial problem here is that there are two jobs being done, but the ABS employment estimate only counts one. So be wary of commentators and politicians making statements like “the economy gained/lost 10,000 jobs last month”! What jobs are they measuring?

The labour force survey also fails to make distinctions between different types of workers. About two million Australians work as independent contractors like construction workers or other business operators such as hairdressers working from home. However, in the figures they are not distinguished from regular employees.

Whereas it might be relatively easy for an employee to know if they did any paid work in the week before the survey, it might not be so obvious for a non-employee. For instance, an author might work 50 hours on their book one week and three hours the next. Most of their work is basic research rather than writing. They receive a royalty payment twice a year. How would they answer the question of whether they did any paid work in the last week?

For non-employees the question of whether they are prepared to start work and have been actively looking for work can also be complex. Someone doing consultancy work might not actively look for work because clients seek them out instead.

We need something new

The ABS has tried tackling some of these issues by conducting some different surveys, including the Characteristics of Employment Survey which presents information on all employed persons according to their status of employment. However, the framework classifies jobholders by their main job. That is, only the job in which they usually worked the most hours. This doesn’t capture many of the issues of concern in, say, the “sharing” or “gig” economy

The ABS has also attempted to compare the number of filled jobs to the amount of employed people, using estimates in the labour force survey. This can reveal interesting information about the labour market. For instance, in February 2013 there were 11,628,300 employed people in Australia, but an estimated 12,287,200 filled jobs. That is, there were 658,900 more filled jobs than there were employed people.

But even then, the estimates still use the conventional definition of a job.

The ABS is still working on an Australian Labour Market Account, based on International Labor Organisation (ILO) methodology, which may address some of the issues discussed here. But this will still be based on traditional definitions of jobs, employment, and unemployment.

Our conventional employment measures are no longer equipped to inform us about important aspects of our labour force and a reliance on them could lead to inappropriate policy. We need labour force numbers than can capture the nuances of a modern economy.

Economics is fundamentally flawed – far worse than the Bank of England realises

From The Conversation.

The Bank of England’s chief economist, Andy Haldane, recently criticised his very own profession. This led to a bout of soul searching for economists as we face, again, the familiar criticism that nobody predicted the 2008 financial crisis (in fact, some economists did) and reflect on whether the subject is being taught properly at school and university.

Yet Haldane’s criticisms are less severe than they might first appear. Indeed they remain largely innocuous at the level of economic prediction.

Andy Haldane. Niccolò Caranti

To his credit, Haldane made some effort to highlight more deep-seated problems in economics. These problems relate to issues of theory and method. They are also related to an unwillingness to allow dissent within economics and to open up to other disciplines.

Unwittingly, however, he distracts attention away from these problems by focusing on the issue of forecasting and misses the opportunity to ram home the point that economics is flawed in a fundamental sense. Better forecasts cannot exonerate economics from its failings now and in the past.

Weak and off-target

Economics should be in crisis. But in reality it is not. Rather, economics remains largely the same as it was before the financial crisis – in effect, it remains just as problematic now as in the past. This is an issue not just for economics but for society as a whole, given the enduring power and influence of the discipline on policy and public life.

To think of economics in terms of forecasting is to limit its nature and scope. Economics ought to be about explanation. It should be able to make sense of the world beyond forecasts of the future. It is not clear that as it exists now, economics is able to understand the world in its present form. To this extent, it cannot help understand the frequency and depth of crises.

Economists remain committed to a particular approach to theory building in which mathematical models are all that count. They are often too abstract to be tested and exist as formal abstractions with no connection to the real world. For example, some macroeconomic models before the crisis were so out of touch with reality they excluded the existence of banks. No wonder the crisis came as a surprise.

As things stand, there is little chance that economics will open up to the ideas and methods of other disciplines. Instead, the discipline has embraced a project of “economic imperialism” seeking to colonise other social sciences. Genuine interdisciplinary debate has lost out in this process.

Haldane’s criticisms of economics, therefore, remain weak and off target. He calls for economics to learn from meteorology. That way it can improve its forecasts. What he misses is the need for radical change at the level of theory and method. He misses the need for economics to embrace reform that turns it into a social science which explains the world as it actually is – not a device for better predicting the economic weather.

Alternatives exist

To be sure, Haldane questioned standard economic assumptions such as that of all actors being perfectly rational. He has also encouraged the use of alternative methods like agent-based modelling, which offers a more realistic view of individual behaviour. Yet, his proposals for reform are limited and weak. The notion that economics might need to be reworked from first principles and rebuilt as a more open and less formal social science remains implicit in his criticisms.

Alternative economic ideas do exist. They exist among dissenting heterodox economists, but they remain on the fringes of economics debate, without any real influence on the core discipline itself.

Big thinker: Friedrich Hayek. LSE Library, CC BY

This fact is probably a surprise to most. Surely the crisis has led to a rebirth in the study of great economic thinkers like Marx, Keynes, and Hayek? After all, these thinkers studied in detail the economic system including its crisis-prone nature.

The sad truth is that this rebirth hasn’t happened. In fact, any rebirth has been stifled by the insularity of the economics discipline. Economic dissenters like Marx, Keynes, and Hayek are still more likely to be studied by scholars outside of economics than within it.

So while Haldane is correct to call for reform in economics he misses the barriers to reform and the need to overcome them. He misses how economics has stifled dissent and how the restructuring of economics requires root-and-branch reform in the way that economics is studied. We need economists that are not better weather forecasters but rather committed social scientists concerned with addressing and resolving real-world problems on an ongoing basis.

Author: David Spencer, Professor of Economics and Political Economy, University of Leeds

Are the rich really getting poorer and the poor getting richer?

From The UK Conversation.

The median UK household is better off. The poorest households are doing even better than the median, and the richest households have been the greatest losers. At least that’s one way to read the headline statistics put out by the Office for National Statistics (ONS) on January 10 in a new report on household disposable income and inequality.

Yet exactly the same statistics could have been reported in a very different way. In fact, while the poorer 90% of UK households have seen their equality of income improve, all these households are now receiving less in real terms because of the fall in the value of the pound, and this report says nothing about the best-off 10% of households.

Let’s take the three groups, the average, the poorest, and the richest, one by one.

The average household

Does the median UK household now really have more disposal income than a year earlier? Here, the dates being compared are the financial year up to April 2016 compared with the financial year ending in April 2015. According to the ONS, that median disposal income is now £26,300, compared to £25,700 a year earlier. The government statisticians say this is the case after they have accounted for inflation and changes to household composition.

The disposable income being described by the ONS is income after taxes have been paid and benefits have been received – but it is before housing costs have been deducted. So where rent and the cost of buying a home has risen those rises are not been taken into account.

Average UK house prices rose by 8.2% in the year to April 2016. Rents have been rising by similar amounts and fewer young couples are setting up home. If this housing crisis means that fewer grown-up children are able to leave home, household composition would alter and the average household would look a little better off overall because that grown-up child might well have an income.

The poorest households

The incomes of the country’s poorest households – in the bottom fifth of the income distribution – have increased. This is because unemployment has fallen and even very low-paid work pays more than most benefits (if you can get enough hours). However, the reason unemployment has fallen in recent years is because of the most draconian application of benefit sanctions ever applied in the history of the UK.

In 2013, over one million people were sanctioned, losing benefits that amounted to more than all the fines handed out by sheriff’s courts in Scotland and magistrates courts in England and Wales for all the actual crimes committed that year.

What the imposition of sanctions at unprecedented rates showed was that it is possible to reduce unemployment by taking away benefits. To survive, people are forced to take any work that they can possibly find, or move in with relatives or with anyone that will give up a sofa.

This employment growth has resulted in the apparent disposable income of the median household in the worse-off fifth of households appearing to rise by £700 a year, or just over £13 a week. However, for those households in which an extra adult is now working, the cost of actually getting to work every day, of the clothing needed for that work, and the loss in time to care for others (such as children) will be more than that £13 weekly rise.

The richest households

At the same time, the ONS reports that the median income for the best-off fifth of households fell by £1,000 last year. But crucially, this is their median income, and the incomes of the better-off half of all those households are ignored. There is actually greater income inequality in the best-off fifth than between all the other 80% of households put together. Within the best-off tenth, inequalities are huge, with the top 1% of households receiving roughly the same income as the next 9%.

Information on changes to national insurance contributions and child benefit payments, have shown us that most people in the best-off tenth will not have fared well either. But other statistics on the incomes of some of the very best-off (such as top paid bankers) also reveal that those in the very richest 1% have done well over this period.

The number of British bankers paid over a million Euros a year rose from 3,178 to 3,865 in 2014. There is no reason to believe that has reduced. In fact, preliminary figures for 2015 revealed that 971 people working in just four of the large US banks in London received more than a million Euros in pay in 2015, with 11 working for Goldman Sachs getting more than 5m Euros each.

For the poorer 90% of households in the UK, with total household incomes below £53,448 a year, economic inequalities are falling. But they are falling because the people who are poorest are being forced into work that they would not do if they had any choice. They are falling because benefits such as child benefit are no longer universal (top rate tax payers no longer qualify). Or possibly because it is harder and harder for young adults to leave the family home and statistical adjustments for household composition are not sophisticated enough to account for such changes.

Most people are not really financially better-off, other than a tiny proportion of the population in the top 1% who are not even included in these statistics. Most people becoming a little more equal (while a few become very much better off) – as living costs are about to rise even further due to inflation – is not a good news story.

Author: Danny Dorling, Halford Mackinder Professor of Geography, University of Oxford

Will the ‘Trump rally’ continue through 2017?

From The Conversation.

So far, investors appear to be giving Donald Trump their vote of confidence.

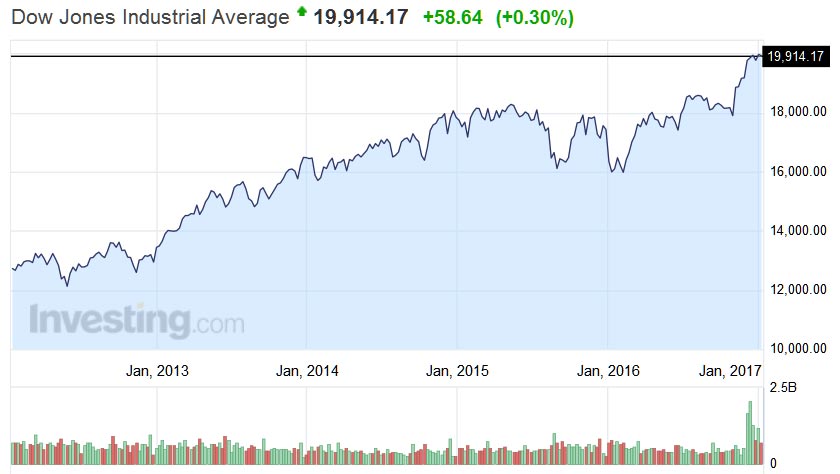
After his election as the 45th president of the United States, the U.S. Dollar Index rallied around 4 percent through the end of the year, while the Dow Jones Industrial Average approached 20,000 for the first time in its history and the Standard & Poor’s 500 was up just under 5 percent.

So now that investors have finished their usual year-end review of where to put their money, one question is on everyone’s mind: Will the so-called Trump rally continue in 2017?

In early November, I wrote an article based on my study showing that how stocks reacted in the first few days after a president’s victory would likely determine their performance for the rest of 2016 – which turned out to be true in Trump’s case.

In a similar vein, a separate study I published in 2009 demonstrated that how a stock market performs in the January a president takes office could portend its fortunes for the remainder of the year.

So will that also turn out to be true for Trump?

‘As January goes’

In that study, which I called “The ‘Other’ January Effect and the Presidential Election Cycle,” I combined two lines of research.

First, going at least as far back as the 1940s, the so-called January effect is a well-known bias in individual stock behavior in which stocks that lose value at the end of the year tend to reverse those losses in January.

The other January effect, which I use in my study, refers to evidence published in 2005 suggesting that January’s returns hold predictive power for the remainder of the year.

More specifically, this effect claims that when stocks go up in January, they tend to continue to climb for the rest of the year, and vice versa – regardless of the impact of other usual drivers of stock market returns. On Wall Street, this effect is often dubbed: “As January goes, so goes the year.” For the rest of the article, for simplicity’s sake, I’ll call this the January effect.

Second, I combined this January effect with the four-year presidential election cycle (PEC) to see how it influenced January’s predictive abilities. The PEC refers to a cycle in which U.S. stock market returns during the last two years of a president’s term tend to be significantly higher than gains during the first two years. This cycle is especially true for the third year of a president’s term, which has almost always been positive.

For my study, I wanted to see if the timing of the presidential cycle (first year, second year, etc.) affected January’s predictive abilities. I studied monthly returns (without dividends) of the S&P 500 over the 67-year period from 1940 through 2006.

January’s predictive power

Overall, my results were consistent with the paper noted above demonstrating that positive returns in January typically portended gains during the other 11 months of the year, as well as the opposite.

They further showed, however, that January’s predictive power is most convincing during the president’s first and fourth years in office. Since, at the moment, we care most about the first year of a president’s term, I’ll focus on those results.

Over my sample period of basically 17 election cycles, I found that during the president’s first year in office, average returns for the 11 months following a positive January were 12.29 percent, while a negative January led to average losses of 7.91 percent over the remainder of the year. That’s a difference of more than 20 percentage points – or over US$200,000 on a $1 million investment.

Furthermore, I found that a positive or negative January predicted returns for the remainder of the year almost 90 percent of the time, suggesting a very strong correlation.

Recent results have been split

Since my study was published, there have been two more elections, one of which ran contrary to the January effect, while the other confirmed it.

After President Barack Obama won the 2008 election, the S&P 500 lost 8.6 percent during his inaugural month of January. But the market rallied for the remainder of the year by about 35 percent.

Conversely, after his reelection in 2012, stocks returned around 5 percent in January 2013 and, consistent with the other January effect, the market climbed another 23 percent over the remainder of the year.

What’s behind this?

So what’s driving the effect?

Exactly what drives this effect is a topic of debate. For example, I tested whether it may be driven by monetary policy, which did not seem to be the case.

A common argument for the PEC is that it reflects investor views of fiscal policy, which is why returns during the second two years of the cycle tend to be higher than the first two. Yet my most significant results were for the first and fourth years.

Nonetheless, while I did not specifically test for fiscal policy influences, it seems valid since my results showed that January’s effect appears to be the most reliable during the president’s incoming year in office. The effect wasn’t nearly as pronounced during the other three years.

So far, that seems to be the case at the moment as the “Trump rally” appears to be a response to anticipated fiscal policy.

What to expect in 2017

Of course, there is never complete certainty in the markets, especially with an unavoidably small sample size like 17 election cycles. Still, the results of my study provide compelling evidence that, particularly in the president’s first year in office, January’s returns appear to capture information that is valuable for anticipating returns for the remainder of the year.

As of Jan. 10, the S&P 500 was up about 1.5 percent for the year and near its record high of 2,282, while the Dow continued to flirt with that magical 20,000 number.

While January’s full-month returns are not yet known, history strongly suggests that investors would be wise to closely monitor the S&P 500. If January 2017 remains positive for U.S. stocks, returns for the remainder of 2017 may very likely also be positive. The opposite can also be expected.

So for investors looking ahead in 2017, as January goes, perhaps so will the remainder of 2017.

Author: Ray Sturm, Associate Lecturer of Finance, University of Central Florida

Ten years on, the iPhone has taken us back as many steps as it has taken us forward

From The Conversation.

The 10th anniversary of the Apple iPhone reminds us that while it was not the first smartphone, it was the first to achieve mass-market appeal. Since then the iPhone has defined the approach that other smartphone manufacturers have taken.

Smartphones have transformed our lives, essentially giving us an internet-connected computer in our pocket. But while we’re distracted by Candy Crush or Pokemon Go, we are losing freedoms. We are losing control of our own devices, and losing access to the information they contain – in the very same devices that are increasingly important in our life.

To see how far we’ve come, consider that personal desktop computers only became widespread with the IBM PC. By designing the PC with an open architecture, an enormous industry of PC-compatible products from other manufacturers sprang up. It’s the same today: when you purchase a computer, you’ll have (if you wish) the ability and the right to add or remove, swap or upgrade any element of the system hardware, install or remove any software you wish, including the operating system, and access to any information stored on it.

However, today the smartphone or tablet have in many cases effectively replaced the desktop or laptop computer. In parts of the developing world, smartphones are the first experience many have of computing and internet access. The fact that they are small and portable and work wirelessly means they are put to many other uses, such as receiving guidance from navigation systems, listening to music while exercising, or playing games in waiting rooms.

Yet doing something that’s very simple on a computer – such as listing your files – is impossible on an iPhone. iPhone users can change their background image, their ring-tone, the time of their alarm. But the iPhone guards what files it contains jealously. Your phone that is carried everywhere with you, which knows your precise location, which records the websites you visit – has all of its files completely inaccessible to you. If you care about privacy this should sound disturbing.

We have always had the right to govern our own computers, to do with them as we wished. But the smartphones and tablets we’re buying today come without administrator rights: we are merely users in the hands of the big tech companies, and these firms effectively rule the machines we live with.

Information and freedom

Of course, the iPhone does allow access to some information, such as photos, emails or documents. But it is often difficult to get that data off the phone. The way the iPhone communicates with your computer is a closed, proprietary protocol, and Apple changes this protocol each time it updates the phone. So if you use neither Microsoft Windows or Apple Mac computers you will have a hard time even to get your own photos out of your own phone.

Apple also restricts what information can be stored on the device. For example, iPhone users are obliged to transfer any music files on the phone through Apple iTunes software. If you cannot or do not wish to run iTunes – no music for you. Additionally, iTunes will automatically delete all the music tracks on your phone if you try to transfer files from more than one computer, due to digital rights management software that assumes that access from more than one computer means that the file has been shared illegally. It’s a bit like buying spectacles that control the conditions under which you’re allowed to read books. Or a backpack that will destroy all its contents if you attempt to carry items bought from different stores.

The same issue also affects which applications can be installed. If you learn how write code, you can develop your own applications to solve your own unique problems. But the iPhone doesn’t allow you to run those programs: only software authorised by Apple and distributed via the Apple Store is permitted.

Open alternatives

Why so tightly control what we can do with our devices? Some may argue that these restrictions are necessary in favour of security. If we look again at computers, however, we find that Linux, an open source non-commercial operating system, is also the most secure. It’s true that the Android mobile phone operating system, which is more open, is not as secure as the iOS operating system that runs Apple’s iPhone. But it shows that it is possible to have a system that is both secure and open.

In fact, iOS is built around several open source software projects – those whose internal workings are open to anyone to view or modify, for free. But while elements of iOS are open source, they are used as part of a tightly closed system. Android, an open source mobile phone operating system originally created by Google, is the chief alternative to the iPhone. But Android phones too have many closed source components, and Google is constantly replacing open components with closed source ones.

Another alternative comes in the form of Ubuntu Touch, a recent version of the popular Ubuntu Linux for phones and tablets, although it is not yet widely used. The fact remains that ten years on, the mobile revolution kicked-off by the iPhone has taken us several steps forward and several steps back; leaving us uncertain of whether some day we will actually fully own our devices.

Author: Leandro Soriano Marcolino, Lecturer in Data Engineering, Lancaster University

How speeding up payments to small businesses creates jobs

From The US Conversation.

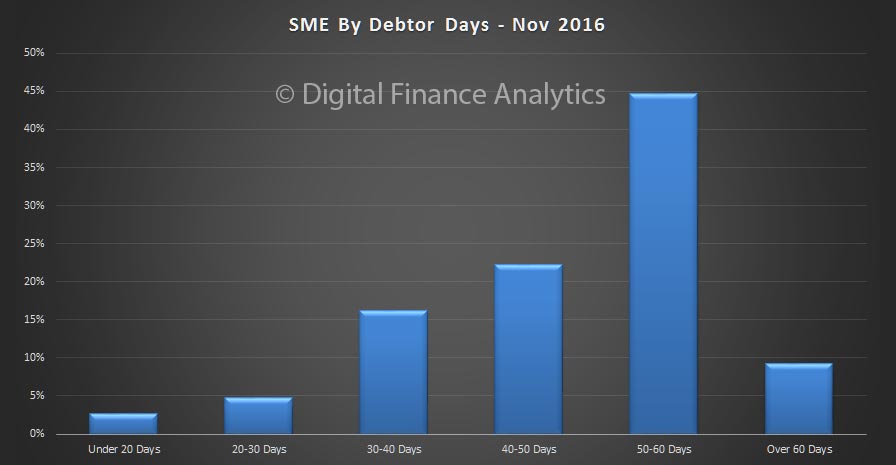
Speeding up payments to SME’s would have a major positive impact. Operating a small business, the backbone of the U.S. economy, has always been tough. The same is true in Australia, and cash flow is a major challenge, as data from our SME survey shows:

According to The Conversation, SME’s also been disproportionately hurt by the Great Recession, losing 40 percent more jobs than the rest of the private sector combined.

Interestingly, as my research with Harvard’s Ramana Nanda shows there’s a fairly straightforward way to support small businesses, make them more profitable and hire more: pay them faster.

A major source of financing

When a business is not paid for weeks after a sale, it is effectively providing short-term financing to its customers, something called “trade credit.” This is recorded in the balance sheet as accounts receivable.

Despite its economic importance, trade credit has received little attention in the academic literature so far, relative to other sources of financing, yet it is a major source of funding for the U.S. economy. The use of trade credit is recorded on companies’ accounting statements as “trade payables” in the liability section of the balance sheet. According to the Federal Fund Flows, trade payables amounted to US$2.1 trillion on nonfinancial companies’ balance sheets at the end of the third quarter of 2006, two times more than bank loans and three times as much as a short-term debt instrument known as commercial paper.

Recent news reports have highlighted the problem of slow payments to suppliers as large companies extend their payment periods, often with crushing results for small businesses.

Other countries have tried to reform the trade credit market, especially in Europe, where a directive was adopted in 2011 limiting intercompany payment periods for all sectors to 60 days (with a few exceptions).

In an earlier paper, I showed that requiring payments to be made within shorter time periods had a large effect on small businesses’ survival when it was adopted in France. Receiving their money earlier led them to default less often on their own suppliers and their financiers. Their probability to go bankrupt dropped by a quarter.

Accelerating payments

To learn more about the impact of such reforms in the U.S., we studied the effects of speeding up payments to federal contractors.

The QuickPay reform, announced in September 2011, accelerated payments from the federal government to a subset of small business contractors in the U.S., shrinking the payment period from 30 days to 15 days – thus accelerating $64 billion in annual federal contract value.

Federal government procurement amounts to 4 percent of U.S. gross domestic product and includes $100 billion in goods and services purchased directly from small businesses, spanning virtually every county and industry in the U.S. In the past, government contracts required payment one to two months following the approval of an invoice, with the result that these small businesses were effectively lending to the government – and often while doing so, they had to simultaneously borrow from banks to finance their payroll and working capital.

Our research shows that even small improvements in cash collection can have large direct effects on hiring due to the multiplier effect of working capital. On average, each accelerated dollar of payment led to an almost 10 cent increase in payroll, with two-thirds of the increase coming from new hires and the balance from increased earnings per worker. Collectively, the new policy – which accelerated $64 billion in payments – increased annual payroll by $6 billion and created just over 75,000 jobs in the three years following the reform.

To give an example, take a business selling $1 million throughout the year to its customers and being paid 30 days after delivering its product. It therefore has to finance 30 days’ worth of sales at any given time (or 8 percent of its annual sales). As a result, it constantly has about $80,000 in cash tied up in accounts receivable.

A shift in the payment regime from 30 days to 15 days means that the firm has to finance only 15 days of sales, or $40,000. And that would in turn help it eventually sustain $2 million in annual sales and double in size.

Holding back growth

These findings confirm the widely shared belief among policymakers and business owners that long payment terms hold back small business growth.

They also raise the question as to why the economy relies so much on trade credit if it costs so much in terms of jobs, and whether other policies might be undertaken to reduce it. An interesting follow-up policy to QuickPay was SupplierPay. In that program, over 40 companies including Apple, AT&T, CVS, Johnson & Johnson and Toyota pledged to pay their small suppliers faster or enable a financing solution that helps them access working capital at a lower cost.

It is likely that more information on customers’ quality and speed of payments would allow suppliers to choose whether to work with businesses that pay more slowly. So following a “name and shame” logic, companies might feel they have to accelerate payments not to be perceived as bad customers.

The broader impact

Would it make sense to sustain and extend this policy?

An interesting aspect of our analysis is that the effect of QuickPay depends on local labor market conditions. It was most pronounced in areas with high unemployment rates when it was introduced. Elsewhere job creation was limited.

The reason for this is that helping small businesses grow gives them an advantage over other companies operating locally. By hiring more, these small business contractors make it harder for others to do so. Unless there is unemployment, this crowding-out effect offsets the employment gains of the policy.

As such, such a policy will be effective in stimulating total employment only in areas or times of high unemployment.

Author: Jean-Noel Barrot, Assistant Professor of Finance, MIT Sloan School of Management

Why bad housing design pumps up power prices for everyone

From The Conversation.

Whether you’re a boatie or not, everyone realises the importance of keeping the water on the outside when you go sailing or fishing. The less leaky the boat, the less you have to rely on devices like bilge pumps to stay afloat.

What does this have to do with houses? Well, Australia’s homes are notoriously “leaky” – allowing the uncontrolled flow of heat into and out of the building. Our answer has been to put in more and more pumps, in the form of air conditioning. This is often promoted as a feature, rather than an indication of a poor-quality building!

Air conditioning is promoted as a feature rather than a design flaw. Wendy Miller

This creates problems for everyone.

We all know that some houses are hotter than others in heatwaves, and that well insulated and designed homes cost a lot less to operate throughout the year because they don’t rely heavily on air conditioners or heaters to provide comfort.

But did you know that relying on air conditioners to stay cool on hot summer days affects the price of electricity for everyone, all year round?

Pumping heat from one place to another takes a lot of energy, which makes air conditioners particularly power-hungry appliances. The more leaky the house, the more heat needs to be pumped out. On hot days, when lots of aircon units are operating at the same time, this creates a challenge for the electricity infrastructure.

It costs money to build an electricity network that can handle these peaks in demand. This cost is recovered through the electricity unit cost (cents per kilowatt hour). We all pay this cost, in every electricity bill we get; in fact the cost of meeting summer peak demand accounts for about 25% of retail electricity costs. This is more than twice the combined effect of solar feed-in tariffs, the Renewable Energy Target and the erstwhile carbon tax.

A house that has been well designed for its tropical climate. Wendy Miller

This means that people living in houses that are built to handle their local climate are effectively subsiding those who live in poorer-quality buildings and relying solely on the air conditioning to stay cool. Perhaps even less fairly, those who struggle to afford air conditioning and have to cope with overheating are also paying this subsidy via the electricity they do use. All this is because many people still live in leaky, poor-quality buildings.

Does this mean that air conditioners are evil and should never be used? Of course not – there is a role for very efficient air conditioners (heat pumps) in extreme weather events. But it does raise some interesting questions. Can we design and build homes that are great to live in and don’t cost the Earth to run? And, if so, why aren’t these homes the norm, rather than the exception?

You get what you ask for

The good news is that comfortable, quality homes that put minimal strain on the electricity grid are certainly possible. What’s needed is a combination of design that takes account of the local climate, appropriate building materials and quality construction practices. Some homes consume less than a quarter of the energy of their contemporaries in the same climate – it’s just frustrating that they aren’t more common.

In the past, the housing industry would say that it’s simply building the homes that people want – that Australians are mainly interested in size and location, not energy performance. Recent research, however, seems to indicate that the perspectives of real estate agents and other property practitioners could be limiting how, or if, they promote energy efficiency and other sustainability features to potential clients.

Are Australians still mesmerised by the surface bling of granite benchtops, a theatre room, or automatic gadgets? Are we starting to consider weightier issues such as operation costs, resilience and comfort? Or are we waiting until the first heatwave or the first electricity bill to realise just how good or poor our purchase decision was?

Some savvy buyers – before they sign a contract – are starting to ask about insulation, but not the more fundamental questions, like “how hot does this room get?” or “can I afford to run this house?”.

The housing sector seems to assume that if you don’t explicitly ask for something, it is not important to you. They also seem to assume that the building regulations set the standard – despite the fact the building regulations are minimum requirements, not best practice for comfort and value.

Some also actively lobby for lower standards, arguing that energy efficiency has “questionable benefits” and that requiring information to be passed on to consumers is an “unnecessary burden”.

Buyer beware – you’re on your own

What does this mean? When buying a used car or a new phone, it’s relatively easy to get the information you need – and there are quite a few consumer protection laws in place. But when we inspect a home for sale or rent, we can see the number of rooms, test the taps and light switches, and measure how far it is to the shops or school or work, but there is a huge amount we can’t see and are not told.

A real estate agent is not acting in the prospective buyer’s interest (or even necessarily in the seller’s. The seller wants the highest price in the shortest time, and the agent wants the biggest commission for the least effort. And contrary to practices in the European Union, no one is obliged (in most parts of Australia) to tell prospective buyers or renters about the home’s running costs.

There have been successes and failures in state government attempts to ensure that home buyers and renters have access to information about comfort and running costs at the time of purchasing or renting. Queensland’s Sustainability Declaration, introduced in 2010, was very short-lived, with an incoming government declaring it “useless red tape”.

In contrast, the ACT government has required an Energy Efficiency Rating for the sale or rent of residential properties since 1999, with multiple reports showing the benefits to property value and to reduced running costs. New South Wales plans to introduce a voluntary disclosure scheme in 2018, and to make it mandatory in 2020.

These schemes not only make it easier to identify homes that cost less to run, but can also drive demand for energy-efficient renovations and put downward pressure on electricity prices.

The distribution of information about housing in Australia is flawed. Real estate agents, valuers, financiers and electricity industry operators are making decisions based on very little or no information about how the quality of houses impacts on their clients, their business processes and electricity infrastructure investment.

Most importantly, owners and renters are not being informed about the quality of the houses they are buying or renting, and the impacts that particular dwellings will have on their health, comfort and wallets.

What can you do?

So is the housing sector right? Do you care about the quality of the building you live in? What is a sensibly designed and well-constructed house worth to you? What dollar value do you put on your health, safety and comfort? What value is there for your family to able to cope with heatwaves, or to pay off the mortgage sooner because of the money you save on power bills?

Which house would you buy in this suburb? Wendy Miller

You don’t need to wait for government to act. If you are looking at buying or renting a new home or apartment, ask to see the energy certificate for the dwelling. Such a certificate would have been created as part of the building approval process.

It could also be useful to ask for a thermal imaging report and air leakage report. These are tests the builder can have done to prove his quality of construction.

Is the insulation properly installed? Wendy Miller

For existing homes, you can ask the seller for a Universal Certificate, or a copy of their energy bills, or evidence of features they have installed to enhance the comfort of the house (such as receipts for insulation or window tinting).

And next time you’re visiting a friend or neighbour with heat radiating from the walls, windows and roof, and the aircon cranked at full blast, enjoy the nice cool air – because you’re helping them pay for it.

Author: Wendy Miller, Senior Research Fellow, Queensland University of Technology

ASIC gives the banks cause for Christmas celebration

From The Conversation.

Christmas is a time to forgive and forget and the Australian Securities and Investments Commission (ASIC) sure knows how to distribute good cheer at Yuletide, especially to old friends such as the big four banks.


On (almost) the night before Christmas, ASIC popped down the chimney and gave the banks a great big present. Buried among the usual news about banning car dealers and liquidators, the regulator announced that it had accepted an “enforceable undertaking” from the Commonwealth Bank of Australia (CBA) and the National Australia Bank (NAB) in relation to the banks’ wholesale spot foreign exchange (FX) businesses.

The conduct revealed by ASIC would be criminal if other firms tried it and will be criminal in future. Traders at the two banks, had on several occasions between 2008 and 2013: exchanged information about their positions with traders in other banks; shared confidential information about clients’ orders; and, in some cases triggered “stop loss” orders to the financial detriment of clients.

The traders had used inside information to enrich the banks and themselves.

To date, overseas regulators have hit major banks with fines totalling more than US$10 billion for what has become known as the “forex scandal”. For example, the Financial Conduct Authority, the UK equivalent of ASIC, fined JPMorgan some A$379 million for the company’s part in manipulating the daily FX Spot Rate benchmark. JPMorgan traders had been found to have committed the same underhand behaviour that has been discovered in NAB and CBA.

So, what were the fines imposed by ASIC on CBA and NAB – wait for it – A$2.5 million each!

Now this is a really big Christmas pressie for the banks. The story that Santa won’t come if you are a bad child, is obviously rubbish.

The banks have also promised to be good from now on and ASIC has required that they employ a nanny (an independent consultant) and that they put in place changes to their “existing systems, controls, monitoring and supervision of employees”. What were they doing before?

And as a very bad Christmas cracker joke, these fines have been dressed up as a “community benefit” payment to – wait for it – advance “financial literacy education related to the aged care sector”. In other words, we will sell you a dodgy reverse mortgage and then tell you why you shouldn’t have bought it from us in the first place.

How did such a Christmas pantomime come about?

If regulation were a beach cricket match, the banks have just asked ASIC to “follow on” and then scuttled them out for a handful of runs.

ASIC is on the back foot, as it was dealt a big blow by the Federal court recently when its strategy for prosecuting the banks over the bank bill swap rate manipulation was delayed yet again. The banks know that by delaying they are rapidly chewing up ASIC’s (the taxpayers’) money to prosecute of A$80 million.

ASIC has had a bad year. Earlier in the year, it was found by the government to be a dysfunctional, over-worked and under-resourced organisation. Kelly O’Dwyer, the Minster responsible, leapt into action, and renewed Chairman Greg Medcraft’s contract for only 18 months rather than the usual three years.

It looks like 2017 is going to be much worse for the regulator.

As the bankers take off for their Christmas break, they have the hard job of deciding where to spend their record bonuses. For example, Santa has been very good to Ian Narev, CEO of Commbank, who has pocketed a 50% pay rise, despite a string of scandals, involving not only bankers manipulating the FX market, but also the CommInsure scandal.

What exactly does a bank CEO have to do to be left off the Christmas card list these days?

Ask the members of the Parliamentary Committee who had the CEOs of the four major banks over this year for a mild roasting. The result was, as the ex-CEO of ANZ said, “a bit of theatre” – a sort of Nutcracker with the nuts but without the cracker.

Each of the four CEOs was asked about systemic issues and all of them batted back the questions elegantly. Mr Narev, pirouetted around the question noting that he had “lost count of the number of times I have emphasised throughout the organisation the importance of escalation”. The committee members, bedazzled by the consulting speak, did not follow up.

As it turns out, Mr Narev must have been negotiating with ASIC over just the sort of industry-wide misconduct that the members were asking about, but it must have slipped his mind. Likewise, Andrew Thorburn, CEO of NAB, was asked about systemic issues but deflected the questions – nothing to see here – even though, at the time, he too must have been negotiating with ASIC on manipulating the FX benchmark.

Next time, if there is a next time, the Committee must follow up and ask the right questions of the right people.

So, the banks are the undoubted winners in 2016, lots of scandals, laughable fines, no Royal Commission, couldn’t get any better. And they certainly plan to have a Happy New Year.

Author: Pat McConnell, Honorary Fellow, Macquarie University Applied Finance Centre, Macquarie University