The unfinished business facing Australia’s new treasurer

From The Conversation.

When Australia’s new treasurer walks into the office on Monday morning, a stack of unfinished business awaits. A quick scan of the Treasury website reveals four major inquiries begun in the past 18 months that are still in progress – the Financial System Inquiry, the Competition Policy Review, the Tax White Paper and the Northern Australia Insurance Premiums Taskforce.

The outcomes of these processes open up the possibility of bold decisions that would uplift the outlook for the nation’s economic growth and longer-term prosperity. It is worthwhile to delay a rush to judgement, and consider a framework and narrative that incorporates and informs all of these areas of inquiry.

The most obvious piece of pending business is the government response to the Financial System Inquiry led by David Murray over the course of 2014. The government response, which had been promised for a few months now, appeared ready to be issued this week.

Indeed, close observers have been left wondering whether there would be much “response” in the response, in light of pronouncements that have already been made. Banking regulator APRA has issued guidance on bank capital (with significant market impacts this year); the government has drafted new legislation on superannuation governance that has been released for public consultation; the decision has been made to not impose a deposit insurance scheme; ASIC’s capability and funding model are currently under review; and the RBA has conducted a payments review including interchange fees.

Off the back of these reviews, other mini-inquiries and consultations have emerged. The Assistant Treasurer Josh Frydenberg in August announced a regulatory review of the payday lending industry. The review of retirement income stream regulation that took place last year is still pending outcomes, and perhaps partly rolled into the Tax White Paper process.

The Northern Australia Insurance Taskforce is examining ways in which the government’s balance sheet can be used to reduce insurance premiums in specific regions of Australia – perhaps without the rest of the Australian community fully appreciating the knock-on impacts this could have for other policyholders. Also under-appreciated are other changes in the insurance industry, such as how the Medibank privatisation is redrawing the regulatory landscape on health insurance.

Yet, one wonders whether the two core positions in the FSI report have been lost in all of the noise: the need to enable efficient funding of the economy by removing distortions, and the ability to promote competition and innovation through appropriate policy settings.

Removing distortions and enabling competition including through innovation in the financial system are both absolutely critical; they are the engine of sustainable financial sector growth. And there is a lot of work to be done.

What does sustainable financial sector growth look like, and why is it important? What is the policy framework that surrounds it? The narrative that will explain this to the Australian community needs to be developed and communicated. Without it, the bold policy choices that are yet to be made are likely to come across as tedious, intangible and maybe just too hard.

The story is straightforward, but is not told often, or well. When we hear from politicians about our economic future, the focus is usually on the goods-producing sectors – mining, agriculture, food, specialised manufacturing. In services we focus on easily-understandable cross-border movement in people – tourism and higher education. We rarely hear boosterism applied to financial services.

Yet, financial services is the largest single industrial segment in the Australian economy by gross value added. It is the largest contributor of corporate tax to the Australian government. It is a major employer in most states, and dominant in NSW and Victoria. It is also probably the largest single services export from Australia to the rest of the world, as ACFS detailed in a recent report. Its above-average rate of productivity growth over the past decade suggests that Australia’s financial sector is innovative.

Of course, the financial services sector also plays an important role in intermediating funds that support growth and innovation through the rest of the economy. The financial services sector runs the payments system, the credit system and the capital markets system that both funds business activity and provides wealth management products for households. Financial services also manage risk through insurance.

What the government has done thus far with the FSI report is fine, but there is potential to go a lot further. The need for this can be seen in the gaps where the financial system has been found wanting: credit to small business, generation of venture capital, creation of a broader suite of retirement income products, the high cost of insurance in some sectors.

Creating supports for clusters for innovation in finance, writing legislation that would enable digital identities while protecting personal financial data, forcing greater access to and use of data so as to level the playing field for competition – these are proactive and forward looking recommendations that may not be easy but must be done. Push the financial sector into the digital age, and the rest of the economy will follow.

And then there is the infrastructure. The NBN may be on its way, but what about data storage in the cloud? This has become essential infrastructure that allows financial firms to store their data at lower cost. Enabling this functionality while protecting firms from cyber crime would be a whole-of-economy advance in Australia’s global competitive position.

A framework that removes distortions and enables competition and innovation – this speaks to the agile, innovative, creative future that Prime Minister Malcolm Turnbull articulated in his victory speech on Monday night. Build the narrative around the inquiries, and good outcomes are sure to follow.

Author: Amy Auster, Deputy Director, Australian Centre for Financial Studies

The Federal Reserve is losing credibility by not raising rates now

From The Conversation.

So the results are in: the Federal reserve decided to keep interest rates at around zero, delaying any increase in its target for at least six more weeks.

The move did not come as a surprise to Wall Street – which was betting 3-to-1 against the hike. But that’s not because investors didn’t think the US economy was ready for a rates “liftoff.” Rather, it shows that markets did not believe the Fed has the will and power to raise rates for the first time since June 2006.

Unfortunately, they guessed right.

The economy is ready if not eager for a liftoff and a return to a normal rates environment. Investors and businesses know this. It’s time the Fed recognized this too.

Ready for liftoff

The data clearly show that the US economy hasn’t looked stronger in a very long time – a sharp improvement from earlier this year when I wrote that it wasn’t ready for an increase in interest rates.

While the labor market may not have experienced strong growth in wages yet, joblessness has plunged to 5.1%, reaching what is known as the “natural rate” of unemployment (also called “full employment”). That’s significant because achieving maximum employment is one of the Fed’s two primary mandates, and anything below the natural rate risks fueling inflation.

And inflation, its other main policy goal, is also in range of its target of 2%. Indexes of consumer prices, both including and excluding volatile energy prices, and personal spending are forecast to be right in that sweet spot of 1.5% to 2% next quarter.

Furthermore, the US economy grew a stronger-than-forecast 3.7% in the second quarter, much better than the previous three-month period and signaling the recovery is on a pretty sound footing.

The output gap – or difference between what an economy is producing and what it is capable of – remains negative at about 3%, and deflation is still a threat.

But regardless of what the Fed does now and in coming months, its target short-term rate will remain well below the long-term “normal” level of about 4% for years to come, so there is little risk a small increase will drag down growth.

Why the Fed didn’t act

According to the Federal Open Market Committee statement, the main factors that persuaded the Fed to delay liftoff are the weakening global economy, “soft” net exports and subdued inflation.

Granted, developing economies, especially China and Russia, are indeed weak as are global financial markets and that could spill over into the US. And the devaluation of the yuan in China and the recession in Canada (the US’ two largest individual trading partners) – coupled with loose monetary policy in Europe – are causing the dollar to appreciate, making US exports decline and imports rise.

It is important to understand that all of these factors except inflation are outside the Fed’s jurisdiction and its dual mandate of maintaining full employment and stable prices. If these factors matter at all to US monetary policymakers, it should only be through their effects on the US economy, in terms of inflation, labor markets and GDP.

And while an appreciating dollar and low oil prices can indeed create deflationary pressures (and reduce US GDP), the data indicate that US prices nevertheless continue to rise, if slowly.

Furthermore, a higher interest rate and stronger dollar make US assets even more attractive to global investors, thus spurring more investment, while low oil prices stimulate consumer spending. Both of these factors boost economic activity and at least partially offset any decline due to lower net exports caused by a strong dollar.

What’s at stake

What’s more important is that the impact of a small rate hike has been with us for some time. Capital is already fleeing developing economies, and the dollar has been strong for a while. Hence, the direct marginal economic effects of a 0.25 percentage point increase in the target rate on the US economy would be negligible at best.

What was really at stake was repairing the Fed’s credibility in terms of successfully shaping US monetary policy and sending a powerful signal that the US economy is in strong shape.

Hoping to avoid previous bungled attempts to adjust monetary policy in recent years that led to significant market volatility, this time the Fed spent at least half of the year updating the language in its statements and gradually preparing the world for a hike. And since it did not deliver, this tells the world that the Fed is unable or unwilling to go against market expectations.

As a result, the central bank will have to either delay the liftoff until the next meeting, slowly reshaping market expectations to be consistent with a hike at that point, or risk a financial panic if it decides on an unexpected policy shift sooner. Delaying the timing further would mean losing precious time in normalizing monetary policy, necessary so that the Fed again has the tools it needs to fight future economic downturns. There’s also the increased risk that the economy will overheat and cause inflation to spiral out of control.

There is never a perfect time to start down this path; it is always possible to find reasons to delay. But each postponement requires even stronger data to justify an eventual liftoff the next time. The problem is that with the hesitant Fed sending mixed signals to the economy, that imaginary perfect day might not ever come.

Author: Alex Nikolsko-Rzhevskyy, Associate Professor of Economics, Lehigh University


Market volatility is here to stay, but high-frequency trading not all bad

From The Conversation.

The volatility on global equity markets in August was at its highest since 2011. On Black Monday (August 24, 2015), the Dow Jones Industrial Average fell by more than 1,000 points and the S&P500 index plummeted 5.3% in the first four minutes after the opening. During the first 30 minutes, more than two billion shares were traded and, over the morning, the market quickly recovered about half of what was lost during the first four minutes.

The CBOE Volatility Index (VIX) also known as the fear index peaked that day at 40.74. During less stressful times in the market, VIX values are usually below 20. Values greater than 30 are generally associated with high levels of volatility. For example, during the global financial crisis, the index reached an intraday high of 89.53 on October 24, 2008.

Chicago Board Options Exchange SPX Volatility Index 2014-15 Bloomberg Business

The speed of adjustments in the market during the last few weeks have seen many market commentators question whether the higher level of volatility is the “new normal”. For instance, the former European Central Bank President Jean-Claude Trichet suggests that “we have to live now with much higher, high-frequency level volatility”.

Things change

What has changed and who are the market participants that are contributing to the high-frequency volatility that we are observing?

The chiefs of banking giants Commonwealth Bank and ANZ have laid the blame on high-frequency traders. ANZ chief Mike Smith argues HFT is a problem because it’s moving the market “very, very dramatically both ways”.

High frequency traders use computers and complex algorithms to move in and out of stocks very quickly. These movements are typically milliseconds apart, involving the trading of very large volumes of shares. Some market commentators believe HFT has intensified the recent volatility by causing the market to react rapidly to news that may not be significant. In response to the market swings that we are currently experiencing, some argue that the reactions observed are much more volatile than what is expected.

HFT and market quality

Doug Cifu, the co-founder of one of the largest electronic market making firms in the world and biggest high-frequency trading firm, Virtu, has defended the role of HFT. Virtu trades about 11,000 financial instruments in 225 markets across 35 countries. Cifu argues that HFT does not cause volatility but absorbs volatility as they participate in the market as a market maker. Market makers help the trading process by acting as the counterparty when others want to trade, and earn a fee in the process.

High-frequency trading firms have argued they provide liquidity to investors and make trading cheaper by reducing spreads between bids and offers across the markets.

My colleagues and I at the University of Western Australia Business School and University of Nagasaki studied the effects of HFT on liquidity on the Tokyo Stock Exchange. We found evidence to support the argument that trading by high-frequency trading firms improves market quality during normal market conditions. This is consistent with prior research conducted using data from the New York Stock Exchange.

However, we found HFT does not improve market quality during periods associated with high levels of market uncertainty. This is particularly worrisome because high frequency traders appear to consume liquidity when liquidity is needed the most.

Actions by regulators

Market operators and regulators have considered different strategies to increase market stability. Some have implemented circuit breakers to halt trading when the market moves by certain percentages, while others have considered imposing transaction taxes on high-frequency traders.

In response to the latest market swings, the China Financial Futures Exchange (CFFE) took a more drastic response by suspending 164 investors who were found to have high daily trading frequency. According to the China Securities Regulatory Commission (CSRC), the trading by these investors is believed to amplify market fluctuations.

In the US, it is estimated that about three-quarters of daily trading is by HFT and ETFs using “slice and dice” type strategies. In an Australian Securities and Investments Commission report released in 2013, HFT is found to account for 27% of total turnover in S&P/ASX200 securities.

These traders are unlikely to go away. It’s now important for us to get a good understanding of what is the new normal. This is what will help regulators in their tough task of monitoring and ensuring market stability.

Author: Marvin Wee, Associate Professor, Accounting and Finance at University of Western Australia

Why personality tests for bank loans are a bad idea

From The Conversation.

Lending money is a risky business. Since 2010, Bank of England figures reveal that lenders have written off an average of £13.2 billion a year in bad loans. You can never be 100% sure that you will ever get your money back.

One way of mitigating that risk is to know as much as possible about the person you are lending to. Indeed, some financial managers reportedly are now considering the use of personality tests to assess the suitability of borrowers seeking loans or credit agreements.

A new model developed by the University of Edinburgh’s Business School, for example, asks borrowers questions designed to reveal their trustworthiness. But could such tests, already used in various forms by some businesses to assess the suitability of potential employees, really work for lenders?

Predicting the future

The conventional way to assess the likelihood that someone might default is to look at their income and expenditure, their assets and their commitments, and make predictions on the basis of their financial circumstances. We also know that a person’s “credit history” is important – it is useful to know if a person has defaulted on loans before, or has other credit problems in their past.

This is all psychologically valid. It’s a well-known principle that the best predictor of future behaviour is past behaviour. But how do you make predictions where someone has little or no credit history?

Lenders are looking at new ways to assess potential borrowers www.gotcredit.com, CC BY

This is where psychological tests could come in, and there is some superficial attractiveness here. If – and the word “if” is important – a person’s likelihood to default on a loan was related to their “personality”, and if (again) that was a measurable trait, and if (yet again) that trait could be measured in a way that was impervious to fraud or manipulation, and if – finally – such a questionnaire was asking questions that were something other than the obvious (or the spurious), then they could indeed be a useful tool.

Gaming the system

But there are problems. We learned recently that psychological science is good, but it’s a long way from infallible. In an attempt to replicate key psychological experiments, scientists found that they could substantiate the findings in only about half the studies examined. That may not mean we should lose faith in all psychologists, but it does mean that we should be a little sceptical when we’re told that a particular set of questions can predict loan defaulters.

Indeed, looking at the reported questionnaires, there seem to be a curious mix of questions, including: “I believe others try to do the right thing”, “I believe in human goodness” and “I pay attention to small details”. There may well be links between people’s typical responses to these questions and financial soundness, but the evidence would have to be convincing.

It’s much more likely that, if people want a loan, they will try and game the system. There is a strong chance they would give the answers that they think reflect a better credit trustworthiness: “I definitely pay attention to financial details. I am perhaps, if anything, too cautious.” As opposed to: “Oh, I don’t care, just give me the cash.” Any psychological assessment scheme would have to be robust to such game-playing, perhaps by asking more opaque questions.

Real data

But there’s a more insidious problem. According to the proponents of this approach, the idea is to protect a lender’s assets by assessing “how trustworthy, reliable, emotionally stable and conscientious a customer might be”. First, there is the very real difficulty of assessing these things, as pointed out by, among others, James Daley, of the consumer group Fairer Finance: “If banks think they can psychologically screen bad debt risks, they are deluding themselves.” But, more than this, very many trustworthy, reliable, emotionally stable and conscientious customers find themselves in financial difficulties, often as a result of economic forces entirely outside their control.

Past behaviour is the best predictor of future behaviour. Where there is very little data to go on, it’s then usually the case that people’s behaviour is best explained by looking at the circumstances of their lives. Doing this through personality tests, however, is clearly very tricky.

I am a professional psychologist, and proud to be one. I believe that my profession has much to offer, in the world of mental health and even in the world of politics.

But I also believe that very little of the potential of psychological science is revealed by “personality tests” that purport to address problems that, in truth, are better addressed through other means.

Author: Peter Kinderman, Professor of Clinical Psychology at University of Liverpool

Data indicates the recession is effectively here; it’s what policy makers do next that counts

From The Conversation.

The latest economic figures released by the Australian Bureau of Statistics (ABS) have fuelled the debate on the future of the Australian economy and prompted many to ask: “Will Australia go into a recession?”

This question is legitimate, but off the mark. In fact, the data tells us that we should not be worried about going into recession.

What we should worry about instead is how to get out of the recession. Because, like it or not, the recession is already here and the sooner we acknowledge the problem, the sooner we can start the recovery.

So, what does the data say?

According to ABS, trend Gross Domestic Product (GDP) growth in Australia in the second quarter of 2015 was 0.5%. This was only marginally below the rate observed in the first quarter of the year (0.6%). The implied annual growth rate of GDP is therefore around 2%.

While considerably below the long-term average of 3.25% a year, trend growth is still positive, which means that Australia is not technically in a recession.

Economists technically define a recession as a period of at least two consecutive quarters of negative GDP growth. This occurs rarely in an advanced economy like Australia.

The last time Australia was technically in recession was 24 years ago, when trend growth turned negative in the third quarter of 1990 and did not go back to positive until quarter four of 1991.

Before then, trend growth was negative for five quarters between 1982 and 1983, for two quarters in the middle of 1974, and for four quarters between 1960 and 1961.

However, while not being technically in a recession, Australia today shows most of the symptoms of recession.

Reload: what does the data say?

First of all, trend GDP is by construction smoothed. However, recessions (and expansions) are cyclical phenomena that are better represented by seasonally adjusted GDP.

In the second quarter of 2015, seasonally adjusted GDP in Australia grew by a mere 0.2%, sharply down from the first quarter when it grew by 0.9%. That is, seasonally adjusted data suggests that the country is much closer to the beginning of a technical recession.

Second, seasonally adjusted Gross Domestic Income (GDI) showed negative growth of -0.4%. This is particularly worrying because GDI is statistically more reliable than GDP as a predictor of the cyclical fluctuations of the economy.

Third, and probably even more importantly, indicators of an individual’s welfare are taking a turn for the worse. The second quarter of the year saw a negative growth in GDP per capita (-0.2%) and net national disposable income per capita (-1.2%).

These negative income dynamics add to persistently weak labour market performance.

The ABS labour force survey shows that in July 2015, seasonally adjusted unemployment reached 795,500 units. This is the highest level since November 1994 and approximately 125,000 units higher than at the peak of the global financial crisis (June 2009). The corresponding unemployment rate was 6.3%.

In the same month of July 2015, youth unemployment increased to 13.8%. This was the first monthly increase since the beginning of the year.

Perhaps this is not technically a recession, but certainly it looks, smells, and feels a lot like one.

Intervention needed

The government, however, seems to be in denial.

Finance Minister Mathias Cormann is reportedly “very optimistic about the outlook moving forward”. Treasurer Joe Hockey recently said that “the Australian economy is showing a deep resilience that people in Canada and elsewhere would die for.”

Unfortunately, the fact that Canada is in a technical recession and other resource intensive countries are suffering from falls in commodity prices does not make the situation of Australia any better.

Conversely, the business sector seems to have understood the reality of the situation. This is evident, for instance, in the declining levels of business confidence and conditions reported by the NAB Monthly Business Survey of July 2015.

The good thing about recessions is that, generally, they end. The bad thing, instead, is that their effects are felt proportionally more by households at the bottom end of income distribution.

Another bad thing is that the consequences of a recession (in terms of unemployment, reduced welfare for instance) tend to outlive the recession itself.

For all these reasons, some form of intervention would be desirable; but how?

In Australia’s case, the empirical evidence clearly indicates that fiscal stimulus works: for each dollar spent by the government, GDP increases by more than one dollar.

In fact, already now, what has prevented the country from recording negative GDP growth is good old Keynesian spending.

Government final consumption grew by 2.2% in the second quarter of the year and 4% since the beginning of the year. Public gross fixed capital formation increased by 4% in the second quarter.

Without this extra public spending Australia would have probably experienced its first quarter of negative growth.

Certainly, Australia also has structural problems that condition its longer-term performance and that a fiscal stimulus will not solve.

But the stimulus will improve the short-term outlook, restore confidence, and create favourable socioeconomic conditions to undertake structural reforms.

To get there, however, an initial step is required: the government must get past its denial of the problem. Let’s hope that this happens sooner rather than later.

Author: Fabrizio Carmignani, Professor, Griffith Business School at Griffith University

Our prosperity is in peril unless we shift from a wasteful world to a ‘circular economy’

From The Conversation.

The prosperity that we are enjoying today could largely be attributed to the industrial revolution of the 18th and early 19th centuries. Yet this enhancement of our standard of living has come at a steep price: the creation of the so-called linear economy.

In other words, we have a “take, make and dispose” economy. We take natural resources, make things and dispose of them in landfills and elsewhere.

This business arrangement in which companies operate with blinders on has created vast environmental and social consequences. Mass and conspicuous consumption, the burning of fossil fuels, the creation of dense urban environments and increased ownership of cars not only significantly endanger the natural world but will also erode our quality of life.

This path is simply not sustainable, both for the environment and the way we live.

Fortunately, more of us are reimagining the global economy and how it could function differently. That kind of thinking has resulted in many advanced ideas, such as Leader in Energy and Environmental Design (LEED) certification for “green” buildings, life-cycle sustainability assessment (LCSA) and cradle-to-cradle principles. These ideas aim to extract more value out of existing resources and illustrate how business philosophies are slowly changing.

The thinkers behind these ideas have pioneered a new standard for how the world could be run: the “circular economy.”

But the question we must ask is, can a more sustainable economy also deliver the gains in prosperity we’ve grown used to?

For smartphones and most other gadgets, planned obscelesence is how our economy works. Phone pile via www.shutterstock.com

Problems with our existing model

The central aim of moving toward a circular economy is to improve resource productivity by keeping products and resources in use for as long as possible, through recovery, reuse, repair, remanufacturing and recycling. It is therefore, by and large, recuperative in nature. It is not so much about “doing more with less” but rather doing more with what we already have by solving the problem of low resource utilization.

At the moment, the world’s growth model wastes most of everything. Research in the US and Europe on consumption habits have shown how often the resources we reap from the Earth end up in landfills, little used. Planned obsolescence is how we live.

For instance, in any given year, only 40% of the garbage in Europe is recycled. In Germany, almost one-third of the household appliances consumers disposed of in 2012 were still functioning. Americans tossed out 141 million mobile devices in 2010 (89% went straight to a landfill). In the UK, it is estimated that as many as 125 million phones languish unused (four times the number currently in use). Cars in Europe remain parked 92% of the time, while business offices are used for less than half of working hours.

With this knowledge in hand, the opportunity for new usage efficiency across all industries and consumer lifestyles is right in front of our eyes.

Economy needs to change to survive

Though a circular economy may sound idealistic – if not like a fantasy – the truth is that the existing way of doing things is reaching the end of its utility.

Already, our economic productivity on a global level is being curbed by the rapid depletion of existing and readily available natural capital such as clean sources of potable water and forests. Since the 1970s, productivity gains in grain crops have fallen 66%, despite advances in fertilization and irrigation techniques over the decades. In a recent study by the MacArthur Foundation, it was found that perhaps 85% of Europe’s soil has been degraded.

The study also notes that mining for natural resources such as zinc has become more expensive and the quality has diminished, making it even more energy wasteful.

At the same time, resource consumption is expected to surge. According to the Organization for Economic Co-operation and Development, the global middle class will double by the year 2030. And that means even greater consumption, because we consume more as we earn more, if China’s rise is any guide.

This illustrates that we cannot continue to grow as a species and enjoy a high quality of life without changing the way we do things.

In a circular economy, the aim is to recycle materials as long as possible, if not indefinitely. Recycling bins via www.shutterstock.com

Creating a closed loop

As noted above, our primary goal in moving to a circular economy would be to preserve our way of life by making it sustainable, or technically viable indefinitely.

In a traditional linear economy, a landfill is the final stage of a resource’s life, when we can no longer make use of it. What the circular economy promotes is closed-loop recycling, which aims to reuse waste indefinitely and make new products without changing the inherent properties of the original material.

Rather than the economy or a company’s bottom line only growing from incremental cuts through efficiency gains, this economy seeks more value from existing materials in the current system. For sure, all physical materials eventually degrade. But if we can prolong their use as long as possible, we will gain more in value by extracting much less.

In a nutshell, the circular economy’s goal would be to decouple economic growth from resource consumption, allowing prosperity to continue rising while using less oil, minerals and other spoils of the Earth.

A piecemeal approach isn’t enough

On a small scale, many companies are already working on the problems of resource usage efficiency by developing new technologies, such as those underlying the so-called sharing economy.

Car sharing, for example, may reduce the number of vehicles on the road, or at least limit their growth, while apartment sharing provides a smart means to use our residences more efficiently, by making use of the assets in a more resourceful way. Not only does it reduce the environmental impact of our actions, but it also generates new revenue streams.

Or in a traditional industry such as carpet manufacturing, some companies are looking beyond efficiency gains in operations and supply chains to improve profitability. Dutch carpet specialist Desso, for one, focuses on ensuring all materials used are recycled, reused or remanufactured – and are not toxic.

But solutions within a single industry or company aren’t going to cut it, because this effectively ignores the needs of the overall system. It would be much better if all the players across the value chain from extraction to consumption teamed up to systemically alter the functioning mechanism of how products are produced.

Moreover, if we fix the problem in such a piecemeal way, we risk causing a so-called “rebound effect.” That is, efficiencies gained in one area – by driving less, for example – end up being offset by all those savings being spent consuming more of something else. We spend less on cabs and fuel but use that money to buy more gadgets.

For these reasons, we need the holistic and collaborative approach embodied in the circular economy to maximize the benefits of these new technologies.

A blueprint for fundamental change

The business case for such an economy is obvious: buying less and reusing more – in other words, increasing resource productivity – will reduce costs and efforts while improving efficiency, thus benefiting the bottom line. But the implications of greater resource productivity aren’t merely incremental.

Resource productivity has the potential to fundamentally change the way we produce products and services as well as create more value on both a micro and macro level. As such, the circular economy is a blueprint for claiming long-term sustainability and economic prosperity for companies and countries alike.

Authors: Mark Esposit,Professor of Business & Economics at Grenoble Ecole de Management and Harvard Extension School at Harvard University and Terence Ts, Associate Professor of Finance / Head of Competitiveness Studies at i7 Institute for Innovation and Competitiveness at ESCP Europe

Blaming the baby boomers for the housing crisis ignores the real issue: a lack of supply

From The Conversation.

Baby boomers have a greater share of the UK’s wealth than any previous generation in the modern era. And unlike their parents and grandparents, the boomer generation also holds a much higher share of this wealth in housing. Meanwhile, with house prices high relative to their incomes, many younger people and families are are unwilling or unable to accrue wealth through home ownership. Increasingly, 25 to 34-year-olds rent.

This housing wealth inequality between the generations seems unfair. But can we blame the housing wealth of the boomers for preventing younger generations from getting on the property ladder? While baby boomers have generally profited from rising property values, the real reason for the UK’s housing problem is a lack of supply.

Boomer beneficiaries

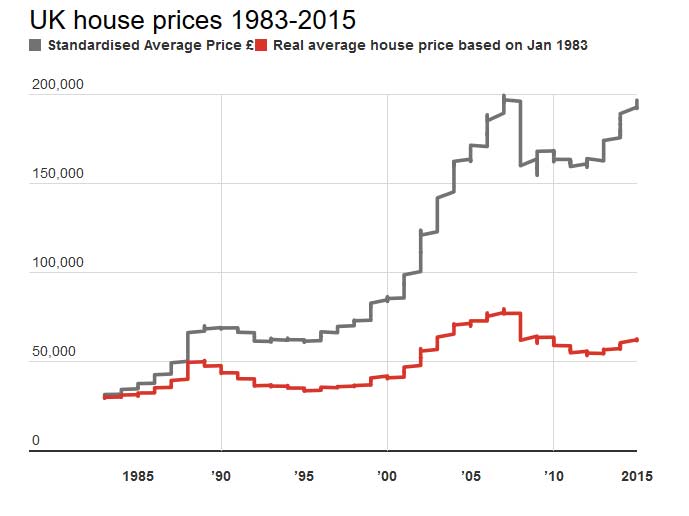
The boomer generation mostly owned their homes already before the housing boom started around 2001, as shown in the chart below. So they got to enjoy the wild ride in house values with relatively little debt to pay off. Meanwhile, wealth inequality across generations increased during this period.

Home ownership rates by age and birth cohort. IFS calculations using Family Expenditure and Family Resources surveys.

Younger households either managed to buy when prices were high with the help of large mortgages only to see their house value drop, perhaps, during the subsequent bust that began in 2008. Or, if they hadn’t got on the ladder yet, the falling earnings and rising credit standards of the post-financial crisis years meant they were then unable to climb onto the ladder at all.

Not the boomers’ fault

Now, with house values again rising faster than earnings around London, it is perhaps irritating to some that so many older households sit in underused homes, while younger generations struggle to find affordable housing. The Intergenerational Foundation is particularly upset. But for the most part, this isn’t the boomers’ fault.

The relatively large climb in home values is mostly the result of a restricted supply of housing combined with demand factors that are largely unrelated to the ageing of Britain’s population. While older households have benefited from this confluence, they share only perhaps some indirect blame for it.

Boom1House prices rose sharply across England from 1996 to 2005, hugely benefiting the many boomers that had bought their homes during the previous decade. This turn of the millennium boom was the result of rising demand for a limited supply of housing stock. This was in turn fuelled by a number of smaller national trends including relaxed lending standards, increased immigration and, at least initially, widespread growth in household incomes and wealth. Perhaps underneath all this were “exuberant expectations” of continued out-sized capital gains. Changing demographics, a much lower-frequency phenomenon, probably contributed little to the demand-side push on house prices.

Geographic evidence

Since the subsequent housing bust, London has claimed the lion’s share of the increase in English house prices. Much of England north of London has seen relatively little – if any – increase in prices since then. This does not match up with where the majority of baby boomers are – they have been ageing in the wrong place to be the cause of this southerly tilt in the housing recovery.

Outside of London, England and Wales are getting older:Boom2The young are moving in droves to London. If anything, those grandparents with all their superfluous bedrooms in the villages in the north are the only ones keeping the lights on (and keeping house values from collapsing). Instead, the London-based recovery in house values relies on youth and foreigners. The young want to live in London and foreigners want to invest in it.

All the above factors have been shifting housing demand. If Britain would simply build more houses, prices needn’t have responded so drastically to this rising demand. Of course, the British housing supply problem has long been known.

Moreover, if Britain built more houses, it could build them in the places most needed and with the specifications most demanded. Supply should expand more rapidly in London and the south-east, where demand is highest. Plus, Britain’s ageing population and shifting social norms has created an ever larger demand for housing better suited to the needs of older households. Older households would be far more likely to downsize if this kind of retirement housing were built.

Supply blockers

Of course, older households, who are more likely to vote as well as to own, probably do bear some responsibility politically for blocking supply. Voting homeowners, and disproportionately so older homeowners, tend to disapprove of politicians that approve new building in their neighbourhoods. This has led to brazen political cycles in construction, which perverts the planning process, misallocates housing and raising prices.

Picture a retired couple in their mid-60’s, with children who’ve long since moved out and grandchildren who may just be old enough to visit the odd week during the summer, an empty bedroom or two still furnished with their parents’ childhoods dustily waiting for them. Barring a large change in circumstance, this couple will likely stay in their family home for many years. They know their neighbourhood. The furniture they’ve collected over the years fits just so in their present space. And if they own the average house in England, its value has grown a bit under 4% (in real, inflation adjusted, terms) on average for the last 20 years.

Over the next decade, as the boomer generation slowly ages into its golden years, the UK will have more and more of these households. Given the many risks they face and the relatively few housing choices available to them, clinging on to a house that is too large for their everyday needs is mostly rational.

Besides their pension, a house is far and away the largest store of wealth for those in their 60’s and beyond. Releasing equity by downsizing to a smaller home in a new location may be attractive in theory but there are high transaction and psychological costs in these moves. And, besides, with house prices generally growing again, the returns to be had from staying are too tempting.

Rather than using economic incentives (such as capital gains and stamp taxes) to lever boomers into smaller houses, Britain should look to correct the misaligned political and economic incentives that local councils have to block new housing from being built.

A healthy housing market with the right policies would channel the huge foreign desire to invest in English housing towards building homes for younger (and older) households. House prices would be less buoyant. Retirees with “too much house” would downsize of their own volition, in turn releasing equity for their own consumption and putting a family home back into the market for a new generation to enjoy.


This article is part of a series on What’s next for the baby boombers?

r: Jonathan Halket, Lecturer in Economics at University of Essex


Property developers pay developer charges, that’s why they argue against them

From The Conversation.

A good rule of thumb in debates on who bears the economic cost of a policy change is to look at the positions taken by vested interests in the matter. If anyone is going to know if they bear the cost, it is those who pay. In the case of infrastructure charges on new property developments, the vocal objections from the property industry are a sure sign that they bear the economic costs.

Infrastructure charges are levied by local governments on developers of new land estates, based on an increased load on essential infrastructure services the council is responsible for.

A research paper reported in The Conversation recently claimed that property developers could pass on these charges in the price of new homes with a mark-up of 400%. The paper also claimed that these charges had the same price effects on existing homes, meaning that new home buyers ultimately bear the cost of infrastructure charges, rather than developers.

But the logic of this should be challenged and is not borne out in the results of other rigorous academic studies of infrastructure charges, which have in fact found the opposite.

The idea that costs of developer charges can be passed on through new home prices sounds intuitive. But it is based on an incorrect notion that prices are determined by costs.

In fact, developers already charge the maximum the market will bear. To not do so would be the equivalent of selling your house for half the market price, just because it only cost you that amount 10 years ago when you bought it. You wouldn’t do it, and nor would a developer.

Using a statistical analysis of a simple regression of home prices with developer charges, along with many hedonic control variables – as this study has – will find a positive correlation simply because charges are set in proportion to housing size. But that isn’t a causal relationship.

As Ian Davidoff and former academic economist (now the ALP’s shadow assistant treasurer) Andrew Leigh succinctly describe in their study on how stamp duty affects the market:

…if one were to simply regress the sale price on the tax payable on that property, the coefficient would capture both the mechanical fact that the tax amount is a function of the price, as well as any behavioural impact of taxes on prices.

It’s true that observations of this mechanical relationship have been widely interpreted as a behavioural effect in the literature on developer charges. But the best analysis does not interpret such results in this way.

A better way to observe behavioural impacts is take advantage of natural experiments, such as when a developer charge is increased in one area but not in a comparable adjacent area, then look at any subsequent price changes compared to the “control group”.

These types of natural experiments can alternatively be attempted with statistical controls, and a recent paper does just that when looking at the house price effects from additional costs imposed to finance infrastructure.

They find that not only are proper statistical controls very difficult to implement, but that prices decrease per dollar of additional infrastructure charge by somewhere in the range of $0.33 to $2.09.

This range captures the standard view that costs cannot be passed on in prices, which in the case of developer charges means that the developer or previous landowner bears the full cost of the charge, and not the home buyer. Davidoff and Leigh’s controlled results support this view on the incidence of stamp duties in Australia.

These more properly controlled results are consistent with the political actions of the property industry who oppose developer charges because they bear the full cost.

Why is all this important? Vested interests benefit from any illusion of unsettled academic debate. In the case of developer charges the property lobby can maintain an intelligent-sounding “Goldilocks” view in public debates that goes something like this: “The research is not settled. But it is likely that we don’t pay the full charge, nor do we pass it on completely in home prices. The cost is probably shared between us and the homebuyer.”

They capitalise on this apparent uncertainty by claiming that their interests are aligned with the home-buying community; a seductive “Goldilocks” view that is hard for politicians to ignore.

Author: Cameron Murray, Economist at The University of Queensland

Baby booms and busts: how population growth spurts affect the economy

From The Conversation.

A baby boom is generally considered to be a sustained increase and then decrease in the birth rate. The United States, the UK and other industrialized economies have experienced only one such baby boom since 1900 – the one that occurred after World War II.

In addition, many currently developing economies such as India, Pakistan and Thailand have experienced a baby boom since 1950 as a result of a sustained decline in infant and child mortality rates as a result of improved medicine and sanitation.

So what’s the economic impact of these baby booms? Do demographics play a role in determining when an economy expands and contracts? Do they boost incomes or cause them to fall as more young people enter the workforce? I’ve been studying the impact of baby booms on wages, unemployment, patterns of retirement and gross domestic product (GDP) growth for 20 years and, while there are some questions that haven’t been answered, here’s what we’ve learned so far.

Negative impact on employment

The initial impact of a baby boom is decidedly negative for personal incomes.

Baby booms inevitably lead to changes in the relative size of various age cohorts – that is, a rise in the ratio of younger to older adults – a phenomenon first described by economist Richard Easterlin. (In statistics, a cohort is a group of subjects who have shared a particular event together during a particular time span.)

These effects cause a decline in young males’ income relative to workers in their prime, a higher unemployment rate, a lower labor force participation rate and a lower college wage premium among these younger workers.

This occurs because younger workers are generally poor substitutes for older ones, so the increased supply of youths leads to these negative employment results.

Back in the 1950s, entry-level young males in the US were able to achieve incomes equal to their fathers’ current income. This was because of that age group’s reduced relative size as a result of the low birth rates in the 1930s. But by 1985 – about the time the peak of the baby boom had entered the labor force – that relative income had fallen to 0.3; in other words, entry-level men were earning less than one-third of what their fathers made.

In developing countries, these relative cohort size effects – the reduction in young males’ relative income and increase in their unemployment rate – are multiplied by the impact of increasing modern development, especially the rising level of women’s education.

In addition, the large influx of baby boomers into the labor market in the US forced many older workers, who would otherwise be working in “bridge jobs” prior to retirement, into earlier retirement. This explains how the average age of retirement for men and women went down in the 1980s.

This decline in income relative to their parents and their own material aspirations has a host of repercussions on family life. It leads to reduced or delayed marriage, lower fertility rates and increased female labor force participation rates as young people struggle to respond to their worsened prospects.

From boom to bust … to boom?

The reduction in relative income – which the US experienced in the ‘60s and ’70s – thus results in a subsequent “baby bust” as people delay starting a family.

It was hypothesized that these baby booms might be self-replicating as reduced birth rates on the trailing edge of the boom caused the subsequent cohort to be smaller in size, thus leading to better labor force conditions, increased birth rates and an “echo boom” in the next generation.

This theory was based on what led to the baby boom in the first place, when the favorable labor market conditions experienced in the 1950s emerged as a result of fewer children being born during the 1930s, reducing the young-to-old-adult ratio.

Though the echo boom of the 2000s represented an increase in the absolute number of young adults, it didn’t lift their cohort size relative to their parents because birth rates have remained fairly stable at low rates since the end of the post-WWII baby boom.

That has not, however, translated into significantly better labor conditions, at least not the kind experienced by young adults in the 1950s that led to the baby boom. The reasons for this phenomenon have not yet been explained.

So can changing demographics cause recessions?

Another way of exploring the effects of changes in the proportion of young adults in the population is to look at fluctuations in the relative size of the young adult population over time. These seem to have a significant effect on the economy.

As young adults move out of high school and college and set up their own households, they generate new demands for housing, consumer appliances, cars and all the other goods attendant on starting a new adult life. These new households don’t account for a large share of total expenditures, but they represent a major share of the growth in total consumer expenditures each year.

So what happens if, after a period of growth in this age group, the trend reverses? It is likely that industries counting on further strong growth will be forced to cut back on production, and in turn to cut back on deliveries from suppliers – which will in turn cut back on deliveries from their suppliers, creating a snowball effect throughout the economy.

This picture is supported by the patterns over the past 110 years depicted in the graph shown below.

The graph tracks the three-year moving average of the annual rate of change in the proportion of young adults in the US. The red vertical lines indicate the beginnings of recessions. Data past 2020 are projections. US Census Bureau

The curve on the graph represents a three-year moving average of the annual rate of change in the proportion of young adults in the US population, as given by the United States Census Bureau. “Young adults” are defined as those aged 15-19 prior to 1950, and 20-24 in the years after, given changing levels of education over time. This curve is overlaid with vertical lines that mark the start of recessions, as defined by the National Bureau of Economic Research.

There is a very close correspondence between the vertical lines, and peaks in the curve, as well as points where the curve turns negative. In addition, the deep trough between 1937 and 1958 contained another four recessions, and there were two in the trough between 1910 and 1920 (not marked on the graph). The only recessions over the last 110 years that don’t appear to correspond to features of the curve, are those in 1920, 1926 and 1960.

The pattern of causation – if it is one – cannot run from the economy to demographics, since these are young people born over 15 years before each economic downturn. In addition, there’s a one-year lag in the age groups that has been used to control for possible migration effects of a recession – that is, how many people left the US as a result of worse labor market conditions.

The fact that no “double dip” recession occurred in 2012, even as the share of young people fell that year, might be the result of the economic stimulus applied after the most recent recession.

Food for future thought

Obviously there are many other factors associated with economic downturns, but aspects of the empirical regularity demonstrated here can be seen in many countries over the past 50 years – especially regarding the international financial crises of 1980-82, 1992-94, and 1996-98 and 2007-2008.

This is not to say that demographics were the sole cause of the recessions, but rather that they influenced the timing of such events, given a host of other possible factors. For example, did they play a role in determining when the recent housing bubble burst? That question has yet to be answered, but further study may shine some light.

Author: Diane J Macunovich, Professor of Economics at University of Redlands

The generation game: how society loads the dice against the young

From The Conversation.

The UK’s July budget, regarded by some as an outright attack on the young, prompted some timely discussion on the question of intergenerational justice. Among other things, George Osborne, the chancellor of the exchequer, has abolished housing benefit for under-21s, scrapped maintenance grants for the poorest students, and locked under-25s out of a new living wage.

This final measure was greeted memorably in the House of Commons by the fist-pumping of Iain Duncan Smith, the work and pensions secretary.

At the same time, the latest findings of the Intergenerational Foundation highlighted a starkly widening gap in its fairness index between those under 30 and those over 60. In just the last five years, they report a 10% deterioration in the prospects of younger generations relative to older generations across a range of measures including education, income, housing and health.

Responding to the report, former World Bank economist Lawrence Kotlikoff called intergenerational inequity the moral issue of the day, and accused the UK of engaging in “fiscal, educational, health and environmental child abuse”.

In June, the Centre for Policy Studies issued a report detailing a bleak outlook for Generation Y (those born between around 1980 and 2000), who will have to pick up the tab for apocalyptic levels of national debt incurred by baby-boomer overspending. The report’s author, Michael Johnson, said:

Baby-boomers have become masters at perpetrating intergenerational injustice, by making vast unfunded promises to themselves, notably in respect of pensions. Indeed, such is their scale that if the UK were accounted for as a public company, it would be bust.

The injustice and the urgency of the issue seems obvious, but the want of political will to address this suggests that we still don’t know how to think well about the generation game.

The problem of generations

In 1923, the Hungarian-born sociologist Karl Mannheim wrote an essay called The problem of generations, which points us helpfully to some of the structural and sociological features of the relationships between young and old.

Mannheim carefully observed the tension involved in the continuous process of transitioning from generation to generation, a phenomenon based ultimately on the biological rhythm of birth and death. While former participants in what Mannheim calls the “cultural process” are constantly disappearing in death, new ones are constantly emerging through birth into their own time of life.

This phenomenon creates the responsibility to continually transmit the accumulated cultural heritage to new generations. However, tensions arise as young people appropriate that heritage, but want to interpret the world afresh and shape it differently. Mannheim observes that younger generations tend to be “more dramatically aware of a process of destabilisation and take sides in it” while “the older generation cling to the reorientation that had been the drama of their youth.”

It seems older generations have become much better at clinging on. Only recently, for instance, has 87-year-old Bruce Forsyth retired from his regular prime-time slot on Saturday night television. If there is a generation game, didn’t he do well?

Nice to see you, to see you nice.

Fixing the future against the young

There are powerful establishment narratives that discourage the destabilising political agency of the young, not least a creeping broad-brush rhetoric around “extremist” views and so-called British values. But an especially effective modern mechanism of holding new generations in thrall to the old is to make the young pay a fare for their futures.

The chancellor’s recent policy announcements only advance on the norms of a society that has quickly built the accumulation of enormous personal debt into securing the advantages attained so cheaply by previous generations, such as housing and education. You can have your cultural heritage, only now you’re going to have to pay for it. When older generations can impoverish or indebt young people swiftly and heavily enough for the advantages they are schooled to covet, their behaviours can be better disciplined to preserve the stability of a prevailing culture and pacify the threat of the new.

But Mannheim also shows us that the great virtue of the young is that they make fresh starts possible. Being open to the destabilising effect of new generations “facilitates re-evaluation of our inventory and teaches us both to forget that which is no longer useful and to covet that which has yet to be won.”

The stability that is so prized and clung to by older generations cannot last forever, and our social future requires the kind of radical re-evaluation that only the young can effect. But while figures like the young Scottish National Party MP Mhairi Black may offer a glimmer of hope, too many young people are being offered little more to covet than a living wage and the payment of their debts.

Author: Simon Reader, Research associate at Lancaster University