The Property Imperative Weekly 6th May 2017

The latest edition of our weekly summary of events in the finance and property industry has been released, a week in which the RBA told us more about household finances, major banks reported lifts in delinquencies and the number of households in mortgage stress continued to rise.

You can watch our video summary.

We start our review of the week by looking at data from the RBA. They held the cash rate again, and in a speech Governor Philip Lowe said the bank is not overly concerned that a “severe correction in property prices” would trigger a banking collapse, as happened in the US in 2008-09. However, he was far more worried that Australians would bring the economy to a grinding halt by curbing their spending. He said Household debt is “high” relative to incomes, making it likely that many Australians would respond to a market correction with a “sharp correction in their spending”, in an attempt to pay down debt. As a result, an otherwise manageable downturn could be turned into something more serious.

He also made the point that allowing young Australians to use their superannuation for a deposit will not assist affordability and downplayed the importance of tax policies. “The best housing policy is really a transport policy,” he said during a question-and-answer session. The latest RBA chart showed household debt rose again.

The Quarterly Monetary statement highlighted the risks from low income growth, although the underlying causes are not that clear, and that the Bank is still relatively optimistic about future growth. However, again the theme of high household debt came to the fore with data showing that one third of households had no mortgage repayment buffer. It’s worth saying this data comes from securitised loans which may be regarded as the cream of the crop, so risks in other portfolios may be higher.

We have several results in the week, with impressive full year numbers from Macquarie; but less impressive results from NAB, ANZ and Genworth, the Lenders Mortgage Insurer. From this we learnt that delinquencies are rising, especially in the mining heavy states of WA and QLD. Genworth in particular reported a rise in claims. Whilst tighter lending rules are lower the LVR bands, heightened risks seem to be baked in.  Yellow Brick Road, who also reported, highlighted the impact of recent regulatory tightening on the mortgage sector.

We also saw how the retail banks net interest margins are under pressure, this despite recent mortgage rate rises, and hikes to the small business sector, which is the soft underbelly of the portfolio when banks seek to recover NIM. NIM is being hit by the higher capital requirements which are being imposed on the banks. This suggests that more out of cycle rate rises are likely, despite the fact that funding costs appear to have stabilised.

According to the HIA, new home sales fell slightly in March down 1.1% mainly due to fall in new houses; but there were significant state variations, with NSW the only state to record an increase in detached house sales, posting a 10.4 per cent rebound after a soft result in February. Detached house sales fell by 4.6 per cent in Victoria, by 5.4 per cent in Queensland and fell in South Australia and Western Australia by 1.7 per cent and 1.2 per cent respectively.

We released the latest mortgage stress report, which showed of the 3.1 million mortgaged households, an estimated 767,000 are now experiencing mortgage stress. This is a 1.5% rise from the previous month and maintains the trends we have observed in the past 12 months. The rise can be traced to continued static incomes, rising costs of living, and more underemployment; whilst mortgage interest rates have risen thanks to out-of-cycle adjustments by the banks and bigger mortgages thanks to rising home prices.

We think the affordability calculations the banks use need to be reviewed, and the regulators need to do more to get to the bottom of the continuing reclassification of loans between owner occupied and investment – more than $51 billion have been switched, which is around 10 per cent of all investor loans.

Next week we will publish our stress by post code data, and the latest household finance confidence index.

The speculation around whether Sydney home prices are wobbling continues, with the latest CoreLogic numbers flagging a potential fall. But one swallow does not make a summer, and we will need to see more data. Remember there are technical issues behind the CoreLogic index. Auction clearance rates were relatively good, but on lower volumes. We will see what today’s results deliver.

Finally, we expect more discussion on the future shape of capital requirements for the banks, with the Reserve Bank of New Zealand announcing it is undertaking a comprehensive review of the capital adequacy framework applying to locally incorporated registered banks over 2017/18. The aim of the review is to identify the most appropriate framework for setting capital requirements for New Zealand banks, taking into account how the current framework has operated and international developments in bank capital requirements.

In the UK, the Bank of England released details of their approach to setting MREL (a minimum requirement for own funds and eligible liabilities) for UK banks, building societies and the large investment firms. These rules represent one of the last pillars of post-crisis reforms designed to make banks safer and more resilient, and to avoid taxpayer bailouts in future.

Banks are now required to hold several times more loss-absorbing resources than they did before the crisis, while annual stress tests check firms’ resilience to severe but plausible shocks. Banks are now also structured in a way that supports resolution and The Bank of England has the legal powers necessary to manage the failure of a bank, and significant progress has been made to ensure there is coordination between national authorities should a large international bank fail.

We are expecting APRA to release a discussion paper on capital rule tweaks to ensure our banks are unquestionably strong later in the year. This all signals potential higher interest rates for consumers and small business down the track, as more capital is costly.

Trading Up and Trading Down

We finish our household survey update by looking at holders, up-traders and down-traders. Importantly, there are more households seeking to trade down compared with those trading up. You can read the full analysis in the Property Imperative 7, released today.

Holders – More than 780,000 households are holding property, with 81% owner occupied and 21% investment. 418,000 of these properties are owned outright and are mortgage free. Of these households 54% expect house prices to rise in the next year, but under 1% would consider using a mortgage broker because they are by definition not intending to transact in the next year (99%).

Up Traders – Our survey identified about 1,045,000 households who are considering buying a larger property. Most (92%) are owner occupied. Of these households 12% are expecting to transact within the next 12 months, whilst 56% of households expect house prices to rise in this period.

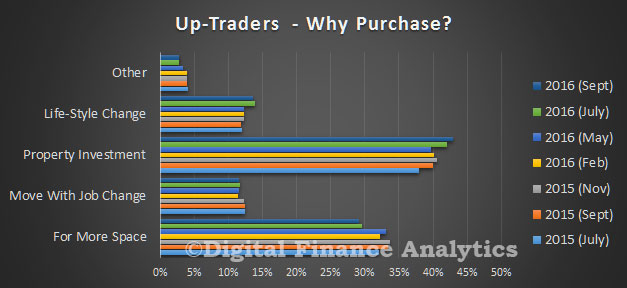
survey-sep-2016-uptradeThe main reasons for these households to transact are as a property investment (42% – up from 40% last year), to obtain more space (29% – down from 33% last year), because of a job move (12%) and for a life-style change (13%). Many of these households will require further finance (74% – up from 70% last year) and a quarter will consider using a mortgage broker (22%), whilst 35% of these households are actively saving to facilitate a transaction. We note that prospective future capital gains rated most strongly, the view of property as an investment continues to drive behaviour. The trend is getting stronger.

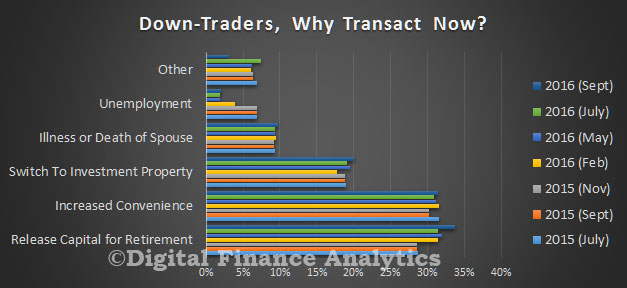
Down Traders – More than 1.2 million households are considering selling and buying a smaller property, up by 100,000 from last year. Of these 71% are considering an owner occupied property, and 29% an investment property. Of these 680,000 currently have no mortgage and own the property outright. Around 20% of these households expect house prices to rise over the next year, a consistently low figure compared with other segments, whilst 38% expect to transact within 12 months, 10% will consider using a mortgage broker and 8% will need to borrow more. Households will transact to facilitate increased convenience (31%), to release capital for retirement (33%), because of unemployment (2%) or because of illness or death of a spouse (10%).

survey-sep-2016-down-traderWe see a continued sense among down traders that an investment property is likely to be a factor in their ongoing wealth management strategy, especially given the saving crunch underway at the moment, with deposit rates falling, and the inherent quest for yield.

Property Purchase Expectations Are Still Strong

Today we continue our discussion of the latest Digital Finance Analytics household surveys, which looks in detail at intentions to purchase property in the next 12 months. This includes data up to late July, so is clear of potential election impacts. The analysis uses a large sample size, so is statistically robust. We use a segmentation model to flush out the main differences between household types. This is described in our publication “The Property Imperative” which is available on request. These results will flow into the next edition later in the year.

We start with some cross-segment comparisons. First, we find that households are just a little less confident house prices will rise in the next year, compared with 12 months ago. However, around half of all households still believe price growth will roll on. Property investors are the most optimistic, whilst those seeking to sell-down, the least.

DFA-Survey-Jul-2016---PricesLooking next at whether households expect to transact, we find that investors are mostly likely to make a purchase, but there is a continued rise among those wanting to refinance. 40% of those seeking to refinance expect to do so in the coming year.

DFA-Survey-Jul-2016---TransactTurning to borrower expectations, first time buyers, those trading up, and portfolio investors are most likely to seek additional mortgage funding. In fact, as interest rates have fallen, demand is even stronger.

DFA-Survey-Jul-2016---BorrowThose saving to assist in a purchase are mainly confined to households who are yet to transact, or who are trading up. More than 70 per cent of first time buyers wishing to purchase, continue to save.

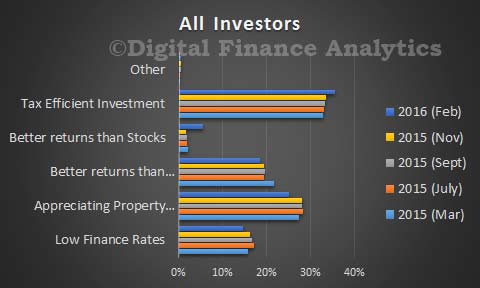
DFA-Survey-Jul-2016---SavingWe will look in more detail at the forces which are driving investors in a later post, but this summary chart gives a good flavour of what we found. Tax efficiency is the single most powerful driver, and property capital appreciation is also important. Together these are perceived to give better returns that from deposits (in this low interest rate environment).  Around 15 per cent of investors cited the low finance rates currently available.

DFA-Survey-Jul-2016---All-InvFinally, in this post, we look at which household segments are most likely to use a mortgage broker. Given that half of all new transactions are originated via this route, understanding which customer groups are most likely to reach of advice is important. Those seeking to refinance are most likely to transact via a broker.

DFA-Survey-Jul-2016---Broker Next time we will look at some of the more detailed segment specific analysis. But in summary, whilst property transaction, and lending volumes may be falling, there is still strong demand for property. This will provide ongoing support for prices in the coming months, and also suggests that households will be seeking deals from lenders. There is life in the old dog yet!

Property Investors Are Still In The Game

Today we continue to feature research published in the latest edition of The Property Imperative, The full report is available on request.  We look across the property investment sector, which remains strong despite lower growth in investment lending. We continue to see that tax benefits and the prospects of better gains than deposit accounts or shares drives the market. This despite the fact that some investors have a negative net yield, thanks to low rental growth.

Solo Investors.

About 992,000 households only hold investment property, 2.5% of which are held within superannuation. Households in this segment will often own one or two properties, but do not consider they are building an investment portfolio.

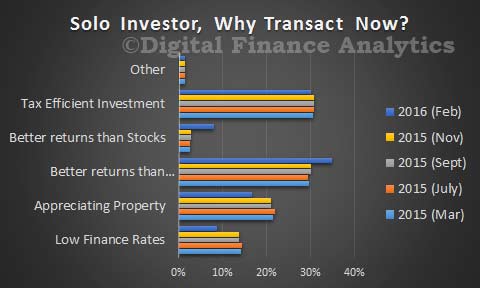
Solo-Feb-2016Around 68% of households expect prices to rise in the next 12 months, 38% of households expect to transact within the next year, 53% will need to borrow more, and 37% will consider the use of a mortgage broker.

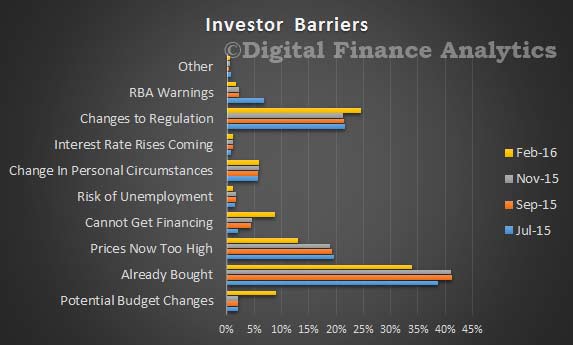
Investor-Barriers-Feb-2016There are a number of barriers to investment, which our surveys identified. Many investors had already bought, so were not in the market (34%). More than 26% of potential investors were concerned by possibly adverse change to regulation – negative gearing or capital gains and 9% specifically referred to risks in the May budget. Some (12%) said they felt property prices were now too high.

Portfolio Investors

Households who are portfolio investors maintain a basket of investment properties. There are 191,000 households in this group. The median number of properties held by these households is eight. Most households expect that house prices will rise in the next 12 months (70%), and 64% said they will transact in the next 12 months. Many will borrow more to facilitate the transaction (90%), and 52% will use a mortgage broker. Significantly we now see about 23% of portfolio investors looking to their property investments as the main source of income, it has in effect become their full time job. A significant characteristic is the cross leverage from one property to the next.

AllInvestors-Feb-2016

Super Investment Property

Throughout the survey we noted an interest in investing in residential property via a self-managed superannuation funds (SMSFs). It is feasible to invest if the property meets certain specific criteria.

Overall our survey showed that around 3.75% of households were holding residential property in SMSF, and a further 3.5% were actively considering it.

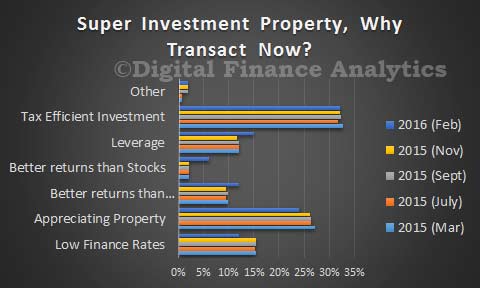
SuperTransact-Feb-2016Of these, 33% were motivated by the tax efficient nature of the investment, others were attracted by the prospect of appreciating prices (24%), the attractive finance offers available (12%), the potential for leverage (15%) and the prospect of better returns than from bank deposits (12%).

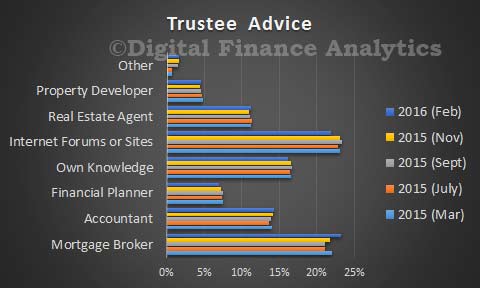
We explored where SMSF Trustees sourced advice to invest in property, 23% used a mortgage broker, 22% online information, 11% a Real Estate Agent, 14% Accountant, and 7% a Financial Planner. Financial Planners are significantly out of favour in the light of recent bank disclosures publicity on poor advice.

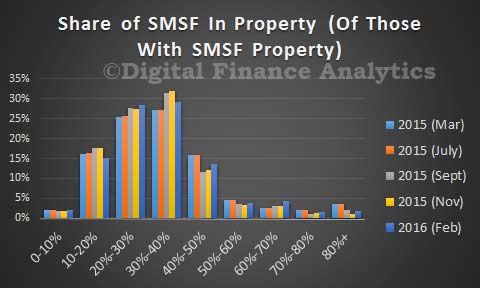
TrusteeAdvice-Feb-2016The proportion of SMSF in property was on average 34%.

SMSFSharePty-Feb-2016According to the fund level performance from APRA to December 2015, and DFA’s own research, Superannuation has become big business, with total assets now worth over $2 trillion (compare this with the $5.5 trillion in residential property in Australia), an increase of 6.1 % from last year.

APRA reports that Self-Managed Superannuation funds held assets were $594.6 billion at December 2015, a rise from $578.9 billion in Sept 2015.

Refinance, The Way to Go

We just released the latest edition of “The Property Imperative”, which is available free on request. This provides access to our latest household survey results. One key segment is the refinance sector and we feature our survey analysis on this segment today.  This segment has become the new battleground for mortgage sector growth. Indeed there are deals below 4% currently to be had, including for 3 years or more fixed. Remarkably low rates.

There are around 695,000 households considering a refinance of an existing loan of which 78% relate to an owner occupied property, and 22% to an investment property. To assist in the refinance, 76% of households will consider using a mortgage broker.

Refinance-Feb-2016Households are looking to refinance for a number of reasons, including reducing monthly repayment (39%), to lock in a fixed rate (15%), because of a loan rollover (13%), in reaction to poor lender service (10%), for a better rate (10%) or to facilitate a capital withdrawal (11%). In the next 12 months, 34% of these households are likely to transact (a rise from 29% last time), whilst 47% expect house prices to rise in the next 12 months.

Refinance-Loan-Size-Feb-2016   The growth in refinancing can be expected to continue as the focus turns from investment lending to owner occupied new and refinance loans. There are a number of discounted offers for refinancing currently available. We note that a higher proportion are refinancing to a fixed rate.

Refinance-Drivers-Feb-2016The most likely loan size to refinance is $250-500k. The refinance drivers vary across the loan size bands. The largest loans are more associated with releasing cash, whereas smaller loans are more associated with reducing monthly payments, or resetting an existing term loan. We also note brokers are more associated with the refinance of larger loans.

Refinance-Type-Feb-2016The larger the loan, the more likely it is that the refinance will be to a fixed rate loan and to an interest only loan.

New Edition of “The Property Imperative” Just Released

The updated edition of “The Property Imperative”, our flagship report on the residential housing sector, which includes survey data to March 2016 is now available free on request.

From the introduction:

The Property Imperative is published twice each year, drawing data from our ongoing consumer surveys, research and blog. This edition dates from March 2016 and offers our latest perspectives on the ever-changing residential property sector.

As usual, we begin by describing the current state of the market by looking at the activities of different household groups using our recent primary research and other available data.

In this edition, we also look at rental yields, household interest rate sensitivity and the role of mortgage brokers, plus data on negative gearing.

Residential property remains in the cross-hairs of many players who wish to influence the economic, fiscal and social outcomes of Australia. In policy terms, debates around negative gearing and capital gains tax breaks for investment properties have hotted up.

By way of context, the Australian residential property market of 9.53 million dwellings is currently valued at over $5.86 trillion and includes houses, semi-detached dwellings, townhouses, terrace houses, flats, units and apartments. In the past 10 years the total value has more than doubled. It is one of the most significant elements driving the economy, and as a result it is influenced by state and federal policy makers, the Reserve Bank (RBA), banking competition and regulation and other factors. Indeed, the RBA is “banking” on property as a critical element in the current economic transition.

According to the RBA, as at January 2016, total housing loans were a record $1.53 trillion. There are more than 5.4 million housing loans outstanding with an average balance of about $249,000. Approximately 64% of total loan stock is for owner occupied housing, while 36% is for investment purposes. In recent months there has been a restatement of the mix between owner occupied and investment loans, and as a result the true blend is hard to decipher.

The RBA continues to highlight their concerns about potential excesses in the housing market. In addition, Australian Prudential Regulation Authority (APRA) has been tightening regulation of the banks, in terms of supervision of lending standards, the imposition of speed limits on investment lending and has raised capital requirements for some bank. The latest RBA minutes indicates their view is these regulatory changes are slowing investment lending somewhat, though we observe that demand remains, and in absolute terms, borrowing interest rates are low.

As a result, momentum in the market has changed, with growth in investment lending relatively static, but counterpointed by a massive focus on owner occupied refinancing and the rise of differential pricing. In addition, 37% of new loans issued were interest-only loans, a drop from 46% last year as the regulators have been bearing down on the banks’ lending standards.

The story of residential property is far from over!

Request a copy of the report here. Please note this is an archived edition now, so if you are after this version – volume 6 please specify so in the comment section of the request form. Otherwise you will receive the latest edition.