The Great Property Rotation

Today we commence a short series on the results from our latest household surveys, as we examine the drivers of property demand by household segment.

These results, from our 52,000 sample to September 2017 reveals that a significant rotation is underway, with first time buyers seeking to buy, supported by recent enhanced first home owner grants, while property investors are now significantly less likely to transact. We will examine the underlying drivers, initially across the segments, and then later in more detail within a segment.

The segmentation we use is based on the master property definitions as described in our segmentation cookbook. It is essential to look across the segments, as cohorts have significantly different imperatives, which at an aggregate level are lost.

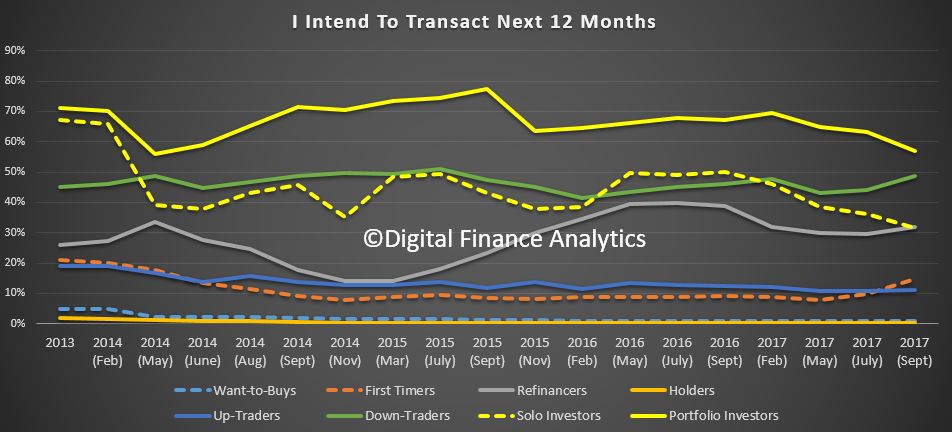
We start with an indication of which segments are most likely to transact over the next year (either buying or selling property).  We can trace the trends since 2013, as displayed below, and until recently both portfolio investors (holding multiple properties for investment purposes) or solo investors (holding one or two properties) led the field. But we are now seeing a marked slow down in investors intending to transact. For example, in 2015, 77% of portfolio investors were intending to transact, today this is down to 57%, and the trend in down. Solo investors are down from a high of 49% to 31%, and again is trending lower. Later we will examine the drivers behind these trends.

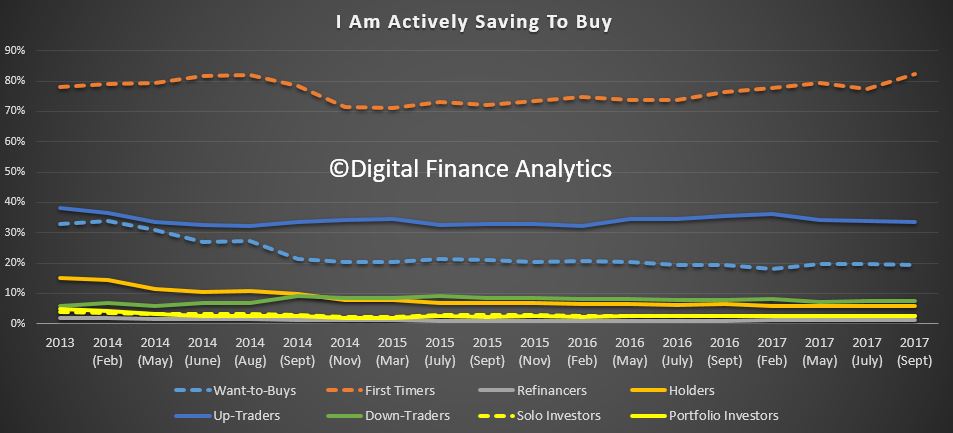
In contrast, the proportion of Down Traders is 49%, has been rising a little. Demand remains quite strong, and has overtaken demand from solo investors.  We also see a rise in demand from those seeking to refinance, with around 31% expecting to transact, in 2013, this was 13%. Finally, we see an uptick in First Time Buyers looking to buy, support, as we will see later by the FHOG available. First Time Buyers are also saving harder, with 82% saving, up from a low of 71% in 2014.

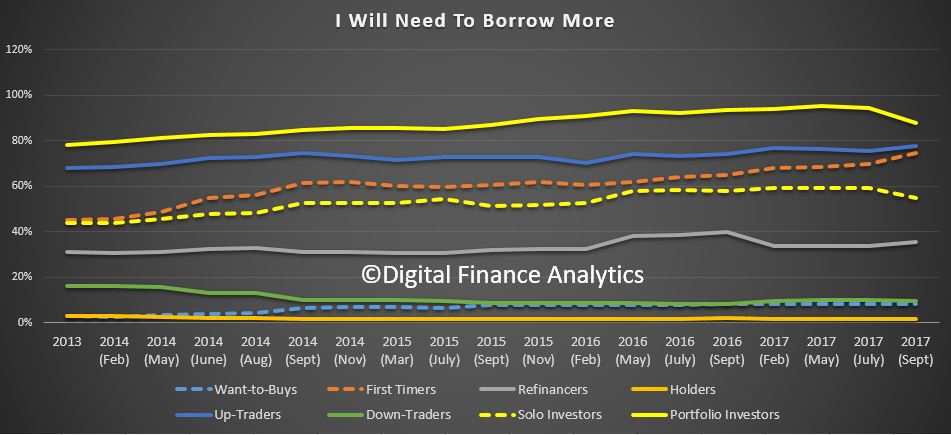
Given the rotation we have described, there is a slowing of demand for more finance (relatively speaking) from both Portfolio and Solo Investors, while demand from First Time Buyers, Up Traders and those seeking to Refinance is greater.

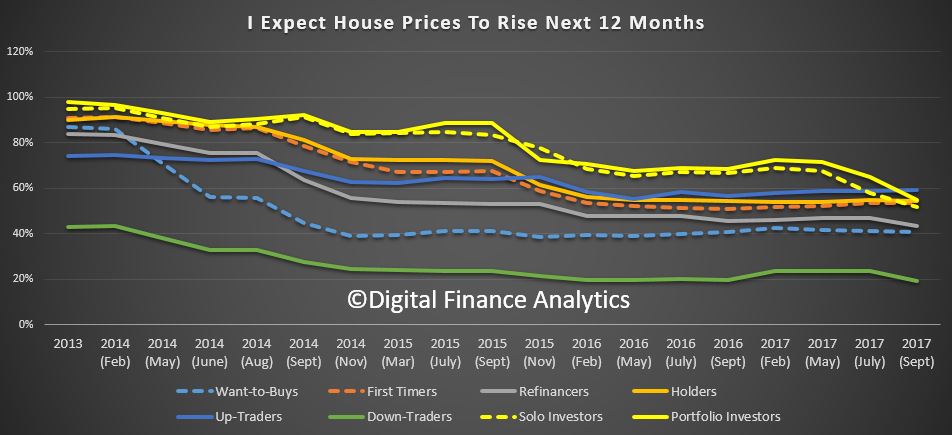
Overall the home price growth expectations is lower, and trending down. We see that Up Traders now more bullish than Portfolio or Solo Investors.

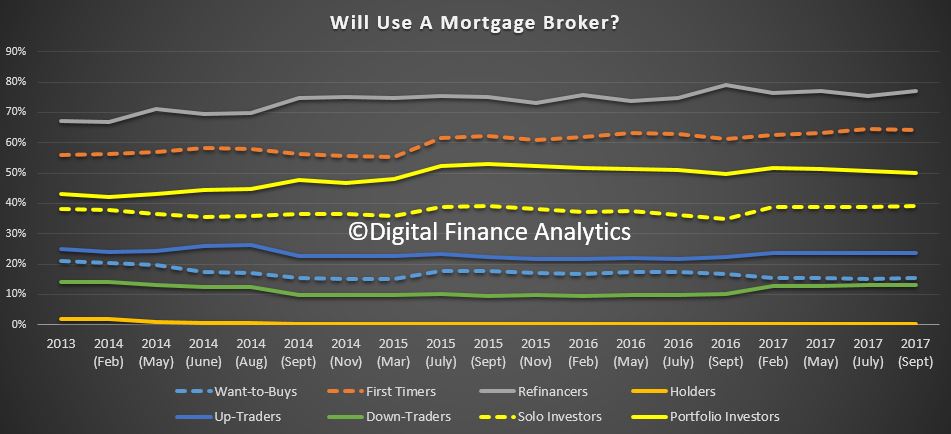
Finally, we see that usage of mortgage brokers continues to vary by segment, with those seeking to refinance most likely to use a broker, (77%), then First Time Buyers (64%) and Portfolio Investors (50%)

Next time we will look in more detail and the drivers within each segment.

The results from this analysis will also flow into the next edition of our flagship report The Property Imperative, due out next month.


Liar Loans and Household Finances – Property Imperative Weekly 16th Sept 2017

Risks in the property sector continue to rise, as we look at new data on household finances, the competitive landscape in banking and liar loans. Welcome to the Property Imperative to 16th September 2017.

We start our weekly digest looking at the latest data on the state of household finances. Watch the video, or read the transcript.

The Centre for Social Impact, in partnership with NAB released Financial Resilience in Australia 2016. This shows that while people are more financially aware, savings are shrinking and economic vulnerability is on the rise. In 2016, 2.4 million adults were financially vulnerable and there was a significant decrease in the proportion who were financially secure (35.7% to 31.2%). People were more likely to report having no access to any form of credit in 2016 (25.6%) compared to 2015 (20.2%) and no form of insurance (11.8% in 2016 compared to 8.7% in 2015). A higher proportion of people reported having access to credit through fringe providers in 2016 (5.4%) compared to 2015 (1.7%).

The ABS published their Survey of Household Income and Wealth. More than half the money Australian households spend on goods and services per week goes on basics – on average, $846 out of $1,425 spent. Housing costs have accelerated significantly. The data shows that more households now have a mortgage, while fewer are mortgage free. Rental rates remain reasonably stable, despite a rise in private landlords.

We published our Household Finance Confidence Index for August, which uses data from our 52,000 household surveys and Core Market Model to examine trends over time. Overall, households scored 98.6, compared with 99.3 last month, and this continues the drift below the neutral measure of 100. Younger households are overall less confident about their financial status, whilst those in the 50-60 year age bands are most confident. This is directly linked to the financial assets held, including property and other investments, and relative incomes. For the first time in more than a year, households in Victoria are more confident than those in NSW, while there was little relative change across the other states. One of the main reasons for the change is state of the Investment Property sector, where we see a significant fall in the number of households intending to purchase in NSW, and more intending to sell. One significant observation is the rising number of investors selling in Sydney to lock in capital growth, and seeking to buy in regional areas or interstate. Adelaide is a particular area of interest.

There was more mixed economic news this week, with the trend unemployment rate in Australia remaining at 5.6 per cent in August and the labour force participation rate rising to 65.2 per cent, the highest it has been since April 2012. However, the quarterly trend underemployment rate remained steady at 8.7 per cent over the quarter, but still at a historical high, for the third consecutive quarter. Full-time employment grew by a further 22,000 in August and part-time employment increased by 6,000.

The RBA published a discussion paper The Property Ladder after the Financial Crisis: The First Step is a Stretch but Those Who Make It Are Doing OK”. Good on the RBA for looking at this important topic. But we do have some concerns about the relevance of their approach. They highlight the rise of those renting, and attribute this largely to rising home prices. As a piece of research, it is interesting, but as it stops in 2014, does not tell us that much about the current state of play! A few points to note. First, the RBA paper uses HILDA data to 2014, so it cannot take account of more recent developments in the market – since then, incomes have been compressed, mortgage rates have been cut, and home prices have risen strongly in most states, so the paper may be of academic interest, but it may not represent the current state of play.   Very recently, First Time Buyers appear to be more active. More first time buyers are getting help from parent, and their loan to income ratios are extended, according to our own research. Also, they had to impute those who are first time buyers from the data, as HILDA does not identify them specifically.  Tricky!

ANZ has updated its national housing price forecast. They think nationwide prices will finish the year 5.8% higher, though prices are now 9.7% higher than a year ago. They attribute much of the slow-down in home price growth to retreating property investors. They also think Melbourne will be more resilient than Sydney.

Banks have been putting more attractor rates into the market to chase low risk mortgage loan growth this week.  CBA advised brokers that the bank is offering a $1,250 rebate for “new external refinance investment and owner-occupied principal and interest home loans” and some rate cuts.  ANZ increased its fixed rate two-year investor loans (with principal and interest repayments) by 31 basis points to 4.34 per cent p.a., while its two-year fixed resident investor loan with an interest-only repayment structure fell by 10 basis points to 4.64 per cent p.a. Suncorp also reduced fixed rates on its two and three-year investment home package plus loans by 20 and 30 basis points, respectively. The new rate for both is 4.29 per cent p.a., provided that the loan is for more than $150,000 and the loan to value ratio (LVR) is less than 90 per cent. MyState Bank has announced a decrease in its two-year fixed home loan rates for new, owner-occupied home loans with an LVR equal to or below 80%, effective immediately. Data from AFG highlights that the majors are reasserting their grip on the mortgage market – so much for macroprudential.

A UBS Report on “liar loans” grabbed the headlines. It is based on an online survey of 907 individuals who had taken out mortgages in the last 12 months and claimed 1/3 of mortgage applications (around $500 billion) were not entirely accurate. Understating living costs was the most significant misrepresentation, plus overstating income, especially loans via brokers. ANZ was singled out by UBS for an alleged high proportion of incorrect loans. Of course the industry rejected the analysis, but we have been watching the continued switching between owner occupied and investor loans – $1.4 billion last month, and more than $56 billion – 10% of the investor loan book over the past few months. This has, we think been driven by the lower interest rates on offer for owner occupied loans, compared with investor loans. But, we wondered if there was “flexibility with the truth” being exercised to get these cheaper loans. So UBS may have a point.  They conclude “while household debt levels, elevated house prices and subdued income growth are well known, these finding suggest mortgagors are more stretched than the banks believe, implying losses in a downturn could be larger than the banks anticipate”. Exactly.

The Treasury released their Affordable Housing draft legislation, which proposes an additional 10% Capital Gains Tax (CGT) benefit for investors who provide affordable housing via a recognised community housing entity. It also allows investment for affordable housing to be made via Managed Investment Trusts (MIT). The focus is to extend market mechanisms to get investors to put money into schemes designed to provide more rental accommodation via community housing projects. Whilst the aims are laudable, and the Government can say they are “Addressing Affordable Housing”, the impact we think will be limited.

APRA’s submission to the Productive Commissions review on Competition in the Australian Financial System review discusses the trade-off between financial stability and competition. They compared the banks’ cost income ratios in Australia with overseas, and suggests we have more efficient banks here – but they fail to compare relative net income ratios and overall returns – which are higher here thanks to a weaker competitive environment. They conclude that whilst some competition is good, too much risks financial stability.

The House of Representatives Standing Committee on Economics heard from the regulators this week. The focus was the banks’ out of cycle mortgage rate price hikes. Some of the banks have attributed the rise in rates to the regulatory changes but are they profiteering from the announcement? ASIC said the issue was whether the public justification for the interest rate rise was actually inaccurate and perhaps false and misleading, and therefore in breach of the ASIC Act. ASIC is currently “looking at this issue” and will be working with the ACCC, which has been given a specific brief by Treasury to investigate the factors that have contributed to the recent interest rate setting.

APRA was asked if lenders’ back book IO repricing practices were “actually opportunistic changes” that had effectively used the APRA speed limits as excuses to garner profit. Deflecting the question, APRA said it would wait to see what came out of inquiries by the ACCC and ASIC, but it was not to blame for any rate hikes, saying “a direct assertion that we made them put up interest rates is clearly not true”.

We think at very least the banks were given an alibi for their rate hikes, which have certainly improved margins significantly.

Finally, the ABS Data on Lending Finance to end July highlighted the rise in commercial lending, other than for investment home investment, was up 2%, while lending for property investment fell as a proportion of all lending, and of lending for residential housing. This included significant falls in NSW, further evidence property investors may be changing their tune.

So, finally some green shoots of business investment perhaps. We really need this to come on strong to drive the growth we need to stimulate wages. The upswing is there, but quite small, so we need to watch the trajectory over the next few months.  Overall lending grew 0.64% in the month, (which would be 7.8% on an annualised basis), way stronger than wages or cpi. So household debt will continue to rise, relative to income, so risks in the property sector continue to grow.

And that’s the Property Imperative to 16th September 2017. If you found this useful, do subscribe to get future updates and thanks for watching.

The Light In the Tunnel – The Property Imperative 09 Sep 2017

A bunch of new data came out this week, so we discuss the findings and explore what it means for households and their budgets.

Welcome to the Property Imperative weekly to 9th September 2017, the latest edition of our finance and property news digest.

We released the August edition of our Mortgage Stress research which showed that across the nation, more than 860,000 households are estimated to be now in mortgage stress (last month 820,000) with more than 20,000 of these in severe stress. This equates to 26.4% of households, up from 25.8% last month.

The main drivers of stress are rising mortgage rates and living costs whilst real incomes continue to fall and underemployment is on the rise.  This is a deadly combination and is touching households across the country, not just in the mortgage belts. In August higher power prices, council rates and childcare costs hit home. You can watch our video where we walk through the post codes most at risk.

The latest Adelaide Bank/REIA Housing Affordability Report showed that buying a house became even less affordable during the June quarter with the proportion of median family income required to meet average home loan repayments increasing by 0.2 percentage points to 31.4 per cent.

Research from Mozo.com.au showed that one third of first time buyers were reliant on help from the Bank of Mum and Dad, and the average value of that assistance in NSW was $88,250. This is pretty similar to our own findings on the rise and rise of the Bank of Mum and Dad.

Data from Roy Morgan highlighted the fact that more Australians are now under-employed than at this time last year. 1.24 million (9.5%) Australians are under-employed (which means looking for work or looking for more work), up a significant 324,000 (2.4%) in a year. They also called the “real” unemployment rate at 10.2%, as opposed to the official ABS data of 5.6%.

CoreLogic said that while auction clearance rates were pretty firm, the volume of sales continued to fall.  But there is no stopping the housing train. Demand for property is still strong, but the mix of purchasers is changing as shown by the housing finance from the ABS which came out on Friday.

Owner occupied purchases are steaming ahead, while investment lending is stagnating. A clear reflection of the tightening in investor lending regulation, and the availability of new incentives and grants for first time buyers, alongside the attractor loan rates for new borrowers. We saw first time buyers more active in NSW and VIC, two states where new concessions started in July. The proportion of first home buyer commitments rose to 16.6% in July from 14.9% in June.  Just remember back in 2009 they comprised more than 30% of total transactions, so all the hype about the return of first time buyers is over done in our view.

But in July, trend lending flows were $33 billion, up 0.1% overall, with owner occupied lending up $20.8 billion or 0.7%, and Investment lending down 1% to $12.1 billion.  The number of owner occupied transactions rose 0.6%, construction of dwellings rose 2%, new dwellings 2% and the purchase of established dwellings 0.3%. As a result, total bank home lending stock rose again to $1.61 trillion, another record.

There are some amazing attractor mortgage loan offers in the market right now, as lenders fight for market share. We see significant falls in some investment property loan offer rates, as well as discounts for new owner occupied borrowers, with rates down to as low as 3.65%. These rates of course are not available for existing borrowers, the oldest trick in the book, so this may explain a rise in refinanced transactions.

ASIC launched a series of videos to help consumers make “MoneySmart” decisions when buying a home. Some would say, better late than never! The recommendations on budgeting are especially pertinent.  However, a weakness of the MoneySmart calculators are they are static, we think they need a calculator to show the impact of changing interest rates for example. That said, their TrackMySpend App is a really useful tool to get to grips with what is being spent.

The point is that our research shows households are exposed to potential future interest rate rises, and whilst lenders are required to factor in expense and interest rate buffers, they are probably not sufficient to protect borrowers in a rising rate environment, and in any case, the majority of borrowers do not understand the financial impact of such rises, nor are they planning for them. We think lenders should have an obligation to display the recalculated monthly repayment at an average long term rate, which would be at least 3% above current levels. Households would be shocked to see the impact, and it may reduce the overreach which many are locked into at the moment.  It all depends on when rates rise.

Treasurer Scott Morrison said that interest rates are “obviously” going to rise in the future but that many home owners would be able to avoid mortgage stress thanks to “mortgage buffers”.

It’s worth noting that ASIC is alleging Westpac used an expenditure benchmark that was based on “conservative” estimates of what a household would spend and “represents only an estimate of what Australian families consume”.

APRA said this week it is important that lenders accurately assess borrower income and living expenses. Living expenses, in particular, are difficult to measure, and so banks often utilise benchmarks as a proxy where borrower estimates appear too low. In fact, APRA’s recent work showed the lion’s share of loans by the larger lenders are assessed using expense benchmarks, rather than the borrower’s own estimates. There is nothing wrong in principle with using benchmarks, provided they aren’t seen as a substitute for proper inquiries of the borrower about their expenses.

Actually, in some cases, across the market, loans were being made where the borrower had only the slimmest of spare income.

The RBA Governor also warned that rates will rise at some point and discussed why lenders may trade off risks in their book against market share.  To stress the point about rate rises, Canada lifted their cash rate this week, and already there are signs of home price corrections following there. The RBA held the cash rate again this week, and they highlighted the fact that the growth in housing debt has been outpacing the slow growth in household incomes, as well as poor wage growth. They still hold their view on positive future growth.

Some of the economic news this week was quite positive, with ANZ job ads higher rising 2.0% m/m in August, the sixth straight rise. Job advertisements currently sit 13.3% higher than a year ago.

The current account data from the ABS showed a deficient increase to $9.6 billion, partly due to lower export commodity prices.  Exports grew faster than imports though.

Overall the economy grew 0.8% in the June quarter. This was below expectations and was helped by significant government investment. Household consumption figure were pretty solid, but at the expense of the household savings ratio which dipped to 4.6%, (5.3% in March). As a result, the current savings ratio is the lowest since 2008, thanks to very weak wage growth. The point though is this cannot continue indefinitely, because household savings are not infinite, and they are also skewed in distribution terms towards those with more assets and net worth.  Stress resides among households with lower net worth and little or no savings.

Dwelling construction grew a moderate 0.2 per cent with growth being observed in New South Wales and Queensland. On an annual basis GDP growth is 1.9%, and to meet the RBA’s expectations will need to lift over the next year or so. We are not sure where such growth will come from.  We need new ways to lift productivity.

Finally, Retail turnover was flat in July, further evidence of the pressure on household budgets after stronger growth earlier in the year.

So to conclude, we still see home lending growing faster than inflation or wage growth, lifting household debt higher. This is at a time when interest rates are clearly going to rise higher, later.

Lenders are still trading off risk against market share, because at the end of the day, households will pick up the tab in a crash. But households should not simply rely on an assurance from the bank they can afford a loan, they should do their own work, to calculate the real effect on their budgets of a 3% rate rise.  In fact, borrowing less is the best insurance against future stress.

And that’s the Property Imperative weekly to 9th September 2017. If you found this useful do subscribe to get our updates, and check back next week.


Rates Lower For Longer – The Property Imperative Weekly – 02 Sept 2017

New data out this week gives an updated read on the state of the property and finance market. We consider the evidence. Welcome to the Property Imperative Weekly to 2nd September 2017.

Starting overseas, we saw lower than expected job growth in the USA, and also lower than expected inflation. Overall, the momentum in the US economy still appears fragile, and this has led to the view that the Fed will hold interest rates lower for longer. As a result, the stock market has been stronger, whilst forward indicators of future interest rates are lower. In fact, half of the jump caused by the Trump Effect last November has been given back. In Europe, the ECB said there would be no tapering until later, again suggesting lower rates for longer.

This change in the international rate dynamics is relevant to the local market, because it means that international funding costs will be lower than expected, and so banks have the capacity to offer attractor rates without killing their margins.  The larger players still have around one third of their funding from overseas sources and so are directly connected to these international developments.

Westpac for example decreased rates on its Fixed Rate Home and Investment Property Loans with IO repayments by as much as 30 basis points. This sets the new fixed rates for owner occupiers between 4.59% p.a. and 4.99% p.a. while rates for investors lie between 4.79% p.a. and 5.19% p.a. They also brought in a two-year introductory offer on its Flexi First Option Home and Investment Property Loan for new borrowers. After two years, the loan will roll over to the base rate which may be more than 70 basis points higher. This may create risks down the track.

Mozo the mortgage comparison site said that twenty-three lenders have dropped their home loan rates since 1 July, showing that competition for good-quality borrowers is hotting up in the lead up to spring, with lenders offering lower interest rates, fee waivers, or lower deposits for favoured customers. Mozo’s research found the most competitive variable rate in the market for a $300,000 owner-occupier loan is 3.44 per cent, which is 120 basis points lower than the average Big 4 bank variable rate.  Borrowers should shop around.

Elsewhere, Heritage Bank, Australia’s largest customer-owned bank, said it had temporarily stopped accepting new applications for investment home loans, to ensure they comply with regulatory limitations on growth. They have experienced a sharp increase in the proportion of investment lending in their new approvals recently, partly due to the actions other lenders in the investor market have taken to slow their growth.

APRA’s monthly data for July revealed a significant slowing in the momentum of mortgage lending.  Bank’s mortgage portfolios grew by 0.4% in July to $1.58 trillion, the slowest rate for several months. This, on an annualised basis would still be twice the rate of inflation. Investment loans now comprise 35.08% of the portfolio, down a little, but still a significant market segment.

Owner occupied loans grew 0.5% to $1.02 trillion while investment loans hardly grew at all to $552.7 billion, the slowest growth in investment loans for several years. So the brakes are being applied in response to the regulators, although individual lenders are showing different outcomes.

The ABA released a report showing that Less than one third of those surveyed had high levels of trust in the banking industry. This is below the international benchmark. There are significant differences in attitude between those who have higher levels of trust, and those who do not. Those with low trust scores believed the banks were drive by profit, not focussed on customer needs and had terms and conditions which are not transparent.

APRA also released their Quarterly ADI Real Estate and Performance reports to June 2017.  Overall, major banks are highly leveraged, and more profitable. Net profit across the sector, after tax was $34.2 billion for the year ending 30 June 2017, an increase of $6.5 billion (23.5 per cent) on 2016. Provision were lower, with impaired facilities and past due items at 0.88 per cent at 30 June 2017, a decrease from 0.94 per cent at 30 June 2016. The return on equity was 12.0 per cent for the year ending 30 June 2017, compared to 10.3 per cent for the year ending 30 June 2016. Looking at the four major banks, where the bulk of assets reside, we see that the ratio of share capital to assets is just 5.4%, this despite a rise in tier 1 capital and CET1. This is explained by the greater exposure to housing loans where capital ratios are still very generous, one reason why the banks love home lending. Thus the big four remain highly leveraged.

The APRA Real Estate data shows ADIs’ residential mortgage books stood at $1.54 trillion as at 30 June 2017, an increase of $105.2 billion (7.3 per cent) on 30 June 2016. Owner-occupied loans were $1,006.2 billion (65.3 per cent), an increase of $75.8 billion (8.1 per cent) from 30 June 2016; and investor loans were $535.7 billion (34.7 per cent), an increase of $29.4 billion (5.8 per cent) from 30 June 2016. Whilst APRA use a different and private measure of interest only loans, their data showed a significant fall this quarter, although the proportion of new IO loans is still above their 30% threshold.  High LVR lending was down again, although there was a rise in loans approved outside standard approval criteria. Loans originated via brokers remained strong, with 70% of loans to foreign banks via this channel, whilst the major banks were at 48%.

Separately the RBA released their credit aggregates for July. Overall credit rose by 0.5% in the month, or 5.3% annualised. Within that housing lending grew at 0.5% (annualised 6.6% – well above inflation), other Personal credit fell again, down 0.1% (annualised -1.4%) and business credit rose 0.5% (annualised 4.2%). Home lending reached a new high at $1.689 trillion. Within that owner occupied lending rose $7 billion to $1.10 trillion (up 0.48%) and investor lending rose just $0.09 billion or 0.15% to $583 billion.  Investor mortgages, as a proportion of all mortgages fell slightly. A further $1.4 billion of loan reclassification between investment and owner occupied loans occurred in July 2017, in total $56 billion has been switched, so the trend continues.

Building Approvals for July rose 0.7% according to the ABS, in trend terms, approvals for private sector houses rose 1.0 per cent in July, whilst approvals for multi-unit projects continues to slide. This may well adversely hit the GDP figures out soon.  New home sales also declined in July according to the HIA. Sales volumes declined by 3.7 per cent during July 2017 compared with June 2017. Sales for the first seven months of this year are 4.6 per cent lower than in the same period of 2016.

The debate about mortgage broker commissions continues, with a joint submission from four consumer groups to Treasury arguing that brokers don’t always obtain better priced loans for clients than the banks and they don’t always offer a diverse range of loan options.  They suggested that given the trust consumers place in brokers, they should all be held to a higher standard than arranging a ‘not unsuitable’ loan for their customers. They should be required to act in the best interests of their customers. Most industry players argue for minor tweaks or retaining the current structure, arguing that first time buyers may be hit, and that the current commissions do not degrade the quality of advice. CBA apologised to Brokers this week. Ian Narev, the outgoing chief executive officer of the Commonwealth Bank, has apologised to brokers for some of the “uncertainties” it has caused. He said the bank was very committed to the broker channel, as the Aussie transaction shows.  He acknowledged that while the bank has “never shied away” from wanting to do its own business through its branches and direct channels, using a broker was “good for customers”.

CBA was of course in the news for all the wrong reasons, with APRA saying it would look at the culture of the Bank, following the money laundering claims. The investigation will be run by an independent panel, appointed by APRA for six months after which the regulator will receive a final report, to be made public. Of note is their perspective that capital security is not sufficient to guarantee the long term security of the financial system, – culture and accountability are critical too. Of course the big question will be – is CBA an outlier?  Does this also provide more weight to calls for a broader Royal Commission? The bank may also face big penalties if international regulators are forced to act over its breaches of rules around money laundering and terrorism financing. Moody’s says this is credit negative and could damage the bank’s reputation as well as compel it to incur costs and use resources to address any mandated remedial actions

CoreLogic’s revised home price index for August report a 0.1% rise across the capital cities, while regional values fell 0.2%. This was the lowest rolling quarterly gain since June last year. Sydney’s rolling 3-month gain was just 0.3%, with a 13% annual rise. Melbourne was 1.9% in the quarter with 12.7% over the year and Hobart led the pack at 13.6%. Perth and Darwin continue to fall. So the question now is, will the spring surge in sales, and lower mortgage rates support prices, or will we see a fall in the next few months?  Auction clearances remain quite strong.

It is worth saying that the strong growth in Australian home prices is nothing unusual as the latest data from the Bank For International Settlements shows.  Hong Kong has the strongest growth, and New Zealand and Canada are both well ahead of Australia.  We track quite closely with the USA. Spain sits at the bottom of the selected series. The year on year change shows that Australian residential prices are accelerating, whilst the macroprudential measures deployed in New Zealand is slowing growth there. Iceland, Canada and Hong Kong are all accelerating.

So, standing back we see demand for property remaining strong, even if supply of new property is on the slide. Banks are still willing to lend, but are more selective, meaning that some borrowers will find it hard to get a loan, while others will be greeted with open arms and discounts. Banks have the benefits of falling international funding costs and the war chests created by regulator inspired hikes in investor and interest only loans. So we think home prices will continue to find support, and lending will continue to grow overall, even if the mix changes. In addition, we have revised down our expectation of future mortgage rate rises, leading to an estimated fall in the number of defaults, despite the fact that more households are in mortgage stress. We published our updated figures for August on Monday, so look out for that.

And that’s the Property Imperative Weekly to 2nd September 2017. If you found this useful, do subscribe to get future updates and check back for our latest news and analysis on the finance and property market. Thanks for watching.

What Lies Beneath? – The Property Imperative 26 Aug 2017

Mortgage Stress hit the headlines thanks to the ABC Four Corners programme, which used data from our household surveys. But if the tip of the iceberg is high debt, rising costs and devalued incomes, what lies beneath?

We helped make the news this week, so in this special weekly edition of the Property Imperative to 26th August 2017, we take a deeper dive into the underlying drivers of high home prices, and the resultant massive debt burden.

The ABC Four Corners programme set out the first order issues quite well, and you can even use their interactive map to look at stress and interest rate sensitivity by post code, which is based on our data. But they did not touch on the more fundamental second order issues which need to be understood to explain how we got here. So we will discuss some of these more fundamental factors, and show why the whole housing conundrum is so complex.

There are a number of factors which have worked together to create very high property prices here, and in other countries around the world. The root cause is the shift in attitude towards property from somewhere to live, to seeing it as an asset class ripe for investment – the financialisation of property. Given the availability of cheap finance (thanks to low interest rates and in many economies extra stimulus from quantitative easing), and the high demand from investors, globally, price rises evident in many countries, mirroring high stock prices. Many baby boomers are at the front of the queue, looking for investment opportunities. But such high home prices makes it ever harder for new purchasers to enter the market, so rates of home ownership are dropping.

We also see flows of investment capital crossing international boarders, thanks to financial deregulation. For example, in Australia, last year Chinese investors bought more than $30 billion of property, including in some post codes more than 15% of residential purchases. Around the world there is hot money looking for a home, and the stellar returns on Australian property have made it an attractive target, especially in the light of the relatively stable political environment here, and until recently the ease by which foreign purchasers could enter the market. That said, Beijing has tightened controls on outbound investment, and this move will put pressure on prices in key property markets from New York to London. The top three overseas destinations for Chinese property investors in 2016 were the United States, Hong Kong and Australia.

In Australia, demand has also been stoked by strong migration. The recent census showed that 1.3 million new migrants have come to Australia since 2011. The impact of this is much debated, with many arguing that the floods of new residents moving to Australia is one of the most significant factors in play. The “big Australia policy” which, though not planned, is based on the assumption that we need more people to drive growth and pay tax; and so the current migration settings reflect this. Yet there is little proper planning for this continued lift in numbers. Some are now questioning this approach, which is causing significant congestion in our capital cities. And migration rates seem to be climbing with the fastest net overseas migration in 4 years, according to the ABS.

About one in three Australians are employed in property related industries, from building and construction, real estate, finance and specialist services. Because of this there is strong political and economic support for high levels of ongoing investment. The HIA this week released the latest National Outlook Report which suggests the housing sector will become less of an economic driver of the Australian economy, and also underscores the various regulatory interventions from state taxes, to limiting foreign investment and investor lending.

It is also worth saying that the standard line of there being an under-supply of property is questionable when we look at the census data on number of people per residence. In fact, this metric has remained static at 2.6 since 2000. Yet most households in our surveys believe we need more construction, not less.

Property Investment by local residents continues apace, supported by overgenerous tax concessions, across both negative gearing and capital gains.  Around 36% of mortgage lending is for investment property. Strong continued capital appreciation is driving this, and our recent surveys showed that even first time buyers were motivated by these gains. Property investment is pervasive, and as the Four Corners programme showed, some investors are geared up across multiple properties, with an appetite for more.  Earlier this year the ATO released their summary data which included quite comprehensive view of the range of costs those with rental properties have offset income. They also divide rentals into those functioning at a loss, and those who make a profit.

Of the 2.9 million rentals, 1.1 million made a profit, the rest a loss (which can be offset against other categories of income). That means 60% of rentals are under water.

We also showed this week that the Bank of Mum and Dad is the 11th largest lender in Australia, and that more than half first time buyers are looking to borrow from the family many of whom drew capital from their existing property. The Bank of Mum and Dad provides an average of $88,000, and some of this goes to assist first time buyers to go direct to the investment sector.

Then there is the wealth effect which rising home prices provides. Anyone holding property will benefit, at least on paper from capital appreciation, and so do not want to see prices slide. Two thirds of households own residential property, so the political weight of numbers is on the side of keeping home prices growing. No wonder, politicians do not want to be holding the reins of power when prices go south.  Neither do they want to rock the boat on negative gearing – though Labor says they would tackle it.

Talking of political power, most states are befitting significantly from the stamp duty received on home purchases. For example, NSW enjoyed more than $7bn of receipts from residential transactions last year – a sizable share of their entire revenue budget. So states and territories do not want to turn that off.  In addition, many are slugging foreign investors additional taxes and charges, to further boost revenue.

Then of course, the banks continue to grow residential lending at three times inflation or CPI, creating, as we discussed last week an amazing debt monster.  This is helped by generous capital ratios which makes home lending more capital efficient than lending to business, even of the growth it generates is, well, illusory.  But for lenders, mortgage lending is highly profitable, and remains their primary growth engine. They will continue to lender as hard as they can, targeting lower risk households in particular.

The profitability of the finance industry was underscored by results from two of the aggregators – these players sits between the banks and mortgage brokers. Mortgage Choice delivered a 10.2% growth in cash profit, though revenue was up just 1.1% to $199 million. They have 654 credit representatives and settlements rose to 12.3 billion.

Australian Finance Group (AFG) reported a 2017 net profit of $30.2 million an increase of 33% on FY2016. They now have around 2,900 mortgage brokers, and process on average around 10,000 loan each month with 45 lenders on their panel.

The finance sector is reliant on a buoyant home lending sector, and as Four Corners highlighted, with 60% of their assets in this business, they would be exposed in any downturn. We also saw in the programme some examples of shoddy practices in the sector, and generally we believe that underwriting standards are still too generous.

The regulatory structure in Australia, with the RBA, ASIC and APRA, collectively with Treasury in the Council of Financial Regulators, has been myopic in its focus, not wanting to rock to boat given the high economic impact of the construction sector, with high volumes of apartments coming on stream in the next year or two. They finally got around to pressing down on interest only loans – too little too late in our view, but this has given the banks ample ammunition to lift the interest rates on these loans, and as a result, they are competing for principal and interest loans, especially for owner occupied borrowers below 80%, with keen rates.  Note too, lenders were forced to tighten their controls, which suggests that the risk management processes in the banks is not adequate, we think they are trading volume and profit over prudent behaviour. Overall loan growth is too strong relative to incomes, but no one wants to talk about the risks of this in a low income growth environment. The regulators are trapped because rates are too low, but they cannot raise them because of the pressures this would exert on households. They argue the systemic financial stability risks are being adequately managed, we are not so sure.  Currently loan volumes continue to grow too strongly.

So in summary, if you pile up all the stakeholder groups who benefit from rising prices, ranging from existing owners, investors, lenders, the construction sector, and the political weight of numbers, no surprise that little is being done to tackle the root cause issues – of high migration, poor lending standards and too strong mortgage loan growth.  This underpins the high household debt and rising mortgage stress.

The politicians may play lip service to housing affordability, and lenders still claim they are being disciplined in the current environment. But it could all too easily turn to custard.

We need a focussed policy on controlling migration, effective planning to accommodate growth, tighter lender restrictions and higher interest rates. But the likelihood is we will continue to muddle though, kick the can down the street, and hope it will turn out ok. But, hope, to quote former New York City Mayor Rudy Giuliani, is not a strategy.

And that’s the Property Imperative Weekly to 26th August. If you found this useful, do subscribe to get our latest updates, and check back again for next week’s installment.

The Debt Monster – The Property Imperative Weekly – 19 Aug 2017

Household Incomes are growing at the slowest rate for two decades, putting more strain on family budgets who are wrestling with rising costs and bigger mortgages and battling the debt monster.

What the implications for home prices, and the broader economy? Welcome the Property Imperative weekly to 19th August 2017, as we look at the latest finance and property news.

Last week we saw auction clearance rates accelerate. According to CoreLogic they rose to 2,011, compared with 1,857 over the previous week.  This was the largest number of auctions held since the last week of June 2017 and one third higher compared with the same week a year ago. Melbourne has held the record for the largest number of sales, but Sydney achieved a higher clearance rate at 72%. So not much sign of the property market flagging.

More data came from the RBA when Assistant Governor Christopher Kent discussed insights from a dataset which covers about 280 ‘pools’ of securitised assets and has information on 1.6 million individual mortgages with a total value of around $400 billion. Currently, this accounts for about one-quarter of the total value of home loans outstanding in Australia.

A couple of caveats. While the dataset covers a significant share of the market for housing loans, it may not be entirely representative across all its dimensions. In particular, the choice of assets in the collateral pool may be influenced by the way that credit ratings agencies assign ratings and by investor preferences. Also, in practice it may take quite a while until new loans enter a securitised pool.

But the first thing to note is that rates on owner-occupier loans and investor loans used to be similar, but investor loans became relatively more expensive from the latter part of 2015. In fact, up until most recently, actual rates paid on interest-only loans have been lower than those on principal-and-interest loans. But now, interest only loans are significantly more expensive for both owner-occupied and investor borrowers. This is reflecting recent bank repricing as they seek to repair margins and throttle back interest only lending in response to regulatory pressure. Monthly repayments are on the rise, and on large loans this is a significant impost.

Looking at loan to value ratios, we see that there is a large share of both owner-occupier and investor loans with current LVRs between 75 and 80 per cent. That is consistent with banks limiting the share of loans with LVRs (at origination) above 80 per cent. Also, borrowers have an incentive to avoid the cost of mortgage insurance, which is typically required for loans with LVRs (at origination) above 80 per cent. This is consistent with the DFA market model, and suggests that a common held view that the average LVR is circa 50% is not correct any more. Bigger loans, lower equity, larger repayments.

Finally, they looked at offset accounts, which showed strong growth up to 2015 probably related to the rise in the share of interest-only loans, with the two being offered as a package. Interestingly, we saw a significant slowing in growth in offset balances around the same time as growth in interest-only housing loans started to decline. Offset balances provide some security for borrowers in times of finance stress.  But the RBA highlights that for investor loans, even after accounting for offset balances, there is still a noticeable share of loans with current LVRs of between 75 and 80 per cent. And for both investor and owner-occupier loans, adjusting for offset balances leads to only a small change in the share of loans with current LVRs greater than 80 per cent. This suggests that borrowers with high current LVRs have limited repayment buffers.

Oh, and note there was no analysis at all on the most critical metric – loan to income ratios, which as we have been highlighting is a more reliable risk assessment tool, but one which in Australia we appear loathe to discuss.

This becomes important when we consider that home prices continue to rise in most states. Separate analysis from CoreLogic showed that the cost of housing has continued to rise across most parts of the country over the past 12 months, pushing the proportion of homes selling for at least one million dollars to new record highs.  Bracket creep should come as no surprise in markets like Sydney and Melbourne where dwelling values have increased by 77% and 61% respectively over the past five years.  While the rise in housing values has been most pronounced in Sydney and Melbourne, most other capital cities and regional areas have also seen a proportional lift in home sales over the million-dollar mark.

The banks continue to lend strongly in the mortgage sector, with system growth still sitting around 6% over the past year. ANZ, who reported their third quarter results this week revealed that they had grown their owner occupied lending at 1.3 times system growth, whilst investor loans grew at 0.8%. Lenders are still banking on mortgage credit growth.

The RBA minutes were more muted this month, perhaps because of the reaction to the 2% rate lift to neutral last month, which was hurriedly walked back subsequently! They mentioned concerns about high household debt again, and that inflation is running below 2%. They also mentioned that the Australian Bureau of Statistics intends to update the weights in the CPI in the December quarter 2017 CPI release, to reflect changes in consumers’ spending behaviour over recent years. This is expected to lead to lower reported CPI inflation because the weights of items whose prices had fallen were likely to be higher, whereas the weights of items whose prices had risen were likely to be lower.

Underlying inflation was expected to be close to 2 per cent in the second half of 2017 and to edge higher over the subsequent two years. Retail electricity prices were expected to increase sharply in the September quarter. They said “ongoing low wage growth and the high level of debt on household balance sheets raised the possibility that consumption growth could be lower than forecast”.

The income data from the ABS confirmed low wage growth, with seasonally adjusted, private sector wages up just 1.8 per cent and public sector wages up 2.4 per cent through the year to June quarter 2017. So wages for those not fortunate enough to work in the public sector continues to be devalued in real terms.  Also, whilst more jobs were created in July, the employment rate is still quite high, and underemployment remains a significant factor – one reason why wages growth is unlikely to shift higher.

So, what are the consequences of home lending rising 6%, inflation 2% and incomes below this? The short answer is more debt, and mostly mortgage debt.

To get a feel for the impact of this, look at our recent focus group results.  Around two thirds of the households in the session held a basic assumption that high debt levels were normal. They had often accumulated debts through their education, when they bought a house, and running credit cards. Even more interestingly, their concern from a cash flow perspective was about servicing the debts, not repaying them. One quote which struck home was “once I am dead, my debts are cancelled, I just keep borrowing until then”.

Debt, it seems has become part of the furniture, and will remain a spectre at the feast throughout their lifetime.  The banks will be happy!

So it is worth looking at some long term trends, as we did on Friday using RBA data.

The traditional argument trotted out is that household wealth is greater than ever, this despite low income growth and rising debt. But of course wealth is significantly linked to home prices, which in turn is linked to debt, so this is a circular argument. You get a different perspective by looking at some additional trends.  And if property prices fell it would all turn sour.

But let’s start with the asset side of the ledger. Since 1999, superannuation has grown by 181.2%, and at the fastest rate. But it is arguably the least accessible asset class.

Residential property values rose 160.2% over the same period, and grew significantly faster than equities which achieved 135.8% growth, so no wonder people want to invest in property – the capital returns have been significantly more robust. Deposit savings grew 159.1% (but the savings ratio has been declining recently). Overall household net worth rose 151.2%. So the story about households being more affluent can be supported on this view of the data. But it is myopic.

Overall household debt rose 161.9%, a growth rate which is higher than residential property values, at 160.2% and above overall household net worth at 151.2%.

But the growth in income, which is a puny 60.5%, under half the asset growth. OK, interest rates are lower now, but this increase in leverage is phenomenal – and explains the “debt is normal” findings from our focus groups. I accept debt is not equally spread across the population, but there are significant pockets of high borrowing, as can be seen from our mortgage stress analysis – and it’s not just among battling urban fringe mortgage holders.

Finally, it is worth noting the growth in the number of residential properties rose by just 29.8% over the same period. So the average value of individual properties has increased significantly. On paper.

To me this highlights we have learned nothing from the GFC. Our appetite for debt, supported by the low interest rate monetary policy, significant tax breaks, and salted by population growth has created a debt monster, which has the capacity to consume many if interest rates were to rise towards more normal levels. Unlike Governments, household debt has to be repaid, eventually.

This data series shows clearly the relationship between more debt and home prices, they feed of each other, and this explains why the banks have enjoyed such strong balance sheet growth. But the impact on households is profound, and long term. Our current attitude to debt will be destructive eventually.

If you are interested in this debate, try to watch ABC Four Corners on Monday night, as they will be looking at the housing bubble and mortgage stress, and using some of our data in the programme.

And that’s the Property Imperative to 19th August 2017. If you found this useful, do subscribe to get updates, and check back for next week’s installment. Thanks for watching.

When Will Rates Rise? – The Property Imperative Weekly 12 Aug 2017

Demand for housing credit remains firm, which explains the ongoing high auction clearance rates. So has the property market further to run and what is the RBA likely to do?

Welcome to the Property Imperative weekly to 12th August 2017, our weekly digest of the latest finance and property news.

Company results released this week included the full-year outcomes from the CBA,  half year from AMP, and 3rd Quarter results from NAB. There was a common theme through them all. Mortgage loan growth has continued, and thanks to loan and deposit repricing, net interest margins have improved in recent months. This was also helped by more benign conditions in the international capital markets. In addition, overall provisions for bad loans were reduced, despite higher delinquency rates in the troubled Western Australia market.  We think the banks, overall, will continue to churn out larger profits as they use repricing to cover the extra regulatory costs and bank taxes.  In fact savers are taking a lot of the pain, especially on term deposits, as rates fall even lower, this gets less focus compared with all the commentary is on mortgage interest rates.

Mortgage Brokers were in the news again, this week, with NAB suggesting that changes do need to be made to “improve the trust and confidence that consumers can have in brokers”.  UBS put out a research note suggesting that broker commissions will be trimmed soon, whilst CBA reported a fall in the volume of new mortgages sourced via brokers, compared with their branch channels. We are beginning to see significantly differentiated distribution strategies, with some suggesting a migration to digital will reduce the importance of the branch, whilst other lenders, like CBA are investing in new, smaller, outlets with the expectation of driving more business generation through them.   On the other hand, CBA, as a result of John Symond exercising his put option, is also buying the remaining 20% interest rest of Aussie Home Loans. Interesting timing!

RBA Governor Philip Lowe’s Opening Statement to the House of Representatives Standing Committee on Economics today contained a few gems.

Globally monetary policy stimulus may be reducing, whilst low wage growth is linked to a complex range of global factors, from technology, competition and lack of security. Locally, business investment is still sluggish, and the RBA says, household are adjusting to lower wage growth plus rising power prices and the burden of household debt.  They still back 3% growth in the years ahead. The next move in the cash rate will be up, but not for some time yet.

Ten years ago this week, French bank BNP Paribas wrote a warning of the risks in the US securitised mortgage system. Later, UK lender Northern Rock saw customers queuing to get their money from the bank, a reminder of what happens when confidence fails.  Later still, Lehmann Brothers crashed. In the ensuing mayhem, as banks fell from grace and were either left to die, or were bailed out – mostly with public funds – and as mortgage arrears rocketed away in many northern hemisphere centres.

Whilst much has changed, and banks now hold more capital, we still think there are risks in the financial system. In fact, if the RBA does raise rates here, there is a risk we could have our own version of the GFC. It was the sharp move up in mortgage rates which finally triggered the crash a decade ago. We have very high household debt, high home prices, flat income, rising living costs and ultra-low, but rising mortgage rates. We also have a construction boom, with a large supply of new (speculative) property, and banks that have around 60% of their assets in residential property. Arguably lending standards are still too lose despite recent tightening (which note, had to be imposed on the lenders by the regulators!). So the RBA will need to lift rates carefully to avoid a crash.

Lending data from the ABS showed owner occupied housing lending rose 0.5% in trend terms in the past month – or around 6% annually, well ahead of inflation.  Lending for new construction rose. But lending for investment housing fell 0.85% month on month, despite ongoing strong demand from investors in Sydney and Melbourne. First time buyers were more active in June, they made up 15.0% of transactions, compared with 14.0% in May. Property demand is actually stronger than a couple of months ago as confirmed by the still strong auction clearance rates. Other personal finance fell 1.8%.

The trend series for the value of commercial finance commitments rose 1.8%. Non housing fixed lending rose 3% and revolving credit rose 1.8%. So, perhaps, finally, we see lending by business beginning to gain momentum! This is needed for sustainable growth. The ANZ Job ads were also stronger in July, and the NAB business confidence indicators were also higher. All pointing to strong business investment, perhaps.

On the other hand, the July DFA household finance confidence index was lower with the average score at 99.3, down from 99.8 last month and below the neutral setting. However, the average score masks significant differences across the dimensions of the survey results. For example, younger households are considerably more negative, compared with older groups. This is strongly linked with property owning status, with those renting well below the neutral setting (and more younger households rent these days), whilst owner occupied home owners are significantly more positive. We also see a fall in the confidence of property investors, relative to owner occupied owners. Across the states, we see a small decline in confidence in NSW from a strong starting point, whilst VIC households were more confident in July.

The driver scorecard shows little change in job security expectations, but lower interest rates on deposits continue to hit savings. Households are more concerned about the level of debt held, as interest rate rises bite home. The impact of flat or falling incomes registers strongly, with more households saying, in real terms they are worse off. Costs of living are rising fast, with the changes in energy prices, child care costs and council rates all hitting hard. That said, the continued rises in home prices, especially in the eastern states meant that net worth for households in these states rose again, which was not the case in WA, NT or SA.

Sentiment in the property sector is clearly a major influence on how households are feeling about their finances, but the real dampening force is falling real incomes and rising costs. As a result, we still expect to see the index fall further as we move into spring, as more price hikes come through. In addition, the raft of investor mortgage rate repricing will hit, whilst rental returns remain muted.

So, overall, we see a mixed and complex picture, with demand for property remaining firm, lending still rising, incomes still under pressure and lenders able to buttress their profits thanks to lifting margins. This puts pressure on the RBA, who continues to warn of the risks to households but then cannot lift rates very far. This tension will all play out, not just in the next few months, but over the next two or three years.

And that’s the Property Imperative to 12th August 2017. If you found this useful, do subscribe to get future updates, and check back for the latest installment.

Heads You Lose, Tails They Win – The Property Imperative Weekly 05 Aug 2017

The latest data suggests mortgage delinquencies are rising, as the number of mortgaged households increase. Yet the RBA is bullish about future growth prospects, despite anemic retail spending, a stronger dollar and home lending reaching another new record. So what’s going on?

Welcome to the latest Property Imperative weekly to 5th August 2017.

We released our mortgage stress and default modelling for Australian mortgage borrowers, to the end July 2017.  Across the nation, we estimate more than 820,000 households are now in mortgage stress (compared with last month 810,000) with 20,000 of these in severe stress. This equates to more than a quarter of borrowing households.  We also estimate that nearly 53,000 households risk default in the next 12 months.

We have been tracking the number of households in stress each month since 2000, and since a small easing in February 2016, the number under pressure has been rising each month.  The RBA cash rate cuts provided some relief, especially directly after the GFC, but now mortgage rates appear to be more disconnected from the cash rate as banks seek to rebuild their margins.

There were more mortgage rate changes this week, with Virgin Money increasing the standard variable rates for owner occupied and investment interest only loans for new and existing customers and also increasing the fixed interest only rates for both owner occupied and investment loans. The increases ranged from 15 basis points, or 0.15%, up to 50 basis points for a 3 year lower LVR owner occupied fixed loan.

Teachers Mutual Bank increased the interest only variable rate by 20 basis points to 5.66% p.a. Interest only rates for the Solution Plus Home Loan rose by between 30 and 50 basis points depending on the LVR. Rates span between 4.49% p.a. and 4.67% p.a. They decrease rates for the principal & interest Home Loan by 15 basis points to 4.39% p.a for those borrowing between $240,000 and $499,999 where the LVR is greater than 80% and less than or equal to 90%.

CBA doubled the waiting period for customers seeking to switch to an interest-only repayment loan from 90 days to 180 days. This is a further move to try to reduce the proportion of IO loans held, following regulatory pressure to meet the 30% limit.  CBA has already lifted interest rates, tightened lending criteria and throttled back applications via mortgage brokers.

Once again we see a differential shift, with interest only loan rates being lifted, whilst rates on some owner occupied principal and interest loans below specific LVR’s and value are reduced. This underlines the current behaviour where specific types of “low risk” borrowers are being recognised. Expect more of the same from other market participants.

A new report by the Australian Housing and Urban Research Institute (AHURI) revealed than an estimated 1.3 million households  – around 14% of Australian households –  are in housing need, whether unable to access market housing or in a position of rental stress. This figure is predicted to rise to 1.7 million by 2025. This includes 373,000 households in New South Wales, where the number is expected to increase by 80% to more than 670,000 by 2025.

The newly released Household, Income and Labour Dynamics in Australia (HILDA) data showed that home ownership among 18 to 39-year-olds has fallen from 36 per cent in 2002 to a new low of 25 per cent. On top of that, between 2002 to 2014, the average mortgage debt of young homeowners increased by 99 per cent in real terms, from $169,000 to $337,000.  In fact, the decline in home ownership has been greater than the decline in owner-occupied households. This is largely because adult children are living with their parents for longer.

More broadly, HILDA also highlighted growing inequality, something which we have been discussing for some time. It is parents passing wealth down to their children that are once again starting to define who gets into property and who doesn’t – we’re going back to a 1950s-style class division. Our research suggests the average hand-down from the Bank of Mum and Dad is more than $85,000.  This rising inequality was also confirmed by the latest ME Bank Survey. They say the overwhelming majority of Australian households (68 per cent) saw their incomes stagnate or fall. Only 32 per cent got pay rises – the lowest in three years.

There are other barriers to property purchase. Data from the HIA suggested that the average stamp duty bill paid by an Australian owner-occupier increased by 16.4% to $20,725 over the past 12 months. And that’s nationally with the average cost in Sydney and Melbourne — Australia’s most expensive housing markets where just under 40% of Australia’s population live — substantially higher at $29,105 and $26,870 respectively. The median dwelling prices in both those cities has more than doubled since the start of 2009, according to CoreLogic. The HIA says recent changes to stamp duty in NSW mean that foreign investors now pay almost $100,000 in transaction taxes to acquire a standard apartment in Sydney – almost four times as much as local buyers.

Fitch Ratings says Australia’s mortgage arrears increased by 12bp QoQ to 1.21% at end-1Q17, due to seasonal Christmas/holiday spending and possible difficulties faced by consumers because of low real-wage growth.

Suncorp, underwhelmed the market with their FY17 annual results. Their housing portfolio now sits at $44.8 billion (up from $44.27 billion in 2016), with 66 per cent coming from the “Brokers”. The results were helped by overall lower provisions and the repricing of mortgages, but despite this, bank NIM fell. Past due home loans rose from 0.79% last year to 0.85% in FY17, and they have significant portfolio concentrations in QLD and WA.

Genworth, the listed Lenders Mortgage Insurer (LMI) released their 1H17 results, and as a bellwether for the mortgage industry, we see continued pressure on mortgage defaults, up 5 basis point, to in WA 0.86% and QLD 0.72%, and a fall in higher LVR lending leading to lower volumes of new premiums being written, but at higher prices.  The average original LVR of new flow business written in 1H17 was 82%.

The latest credit aggregates from the RBA to June 2017 shows continued home lending growth, up 0.5% in the month, or 6.6% annually. Business lending rose 0.9%, or 4.4% annually, and personal credit fell 0.1% or down 4.4% over the past year. However, they changed the seasonally adjusted assumptions, so it is hard to read the true picture, especially when we still have significant reclassification going on. The net value of switching of loan purpose from investor to owner-occupier is estimated to have been $55 billion over the period of July 2015 to June 2017, of which $1.3 billion occurred in June 2017.

In original terms housing loans grew to $1.69 trillion, another record. Investor home lending grew 0.5% or $3.13 billion, but this was adjusted down in the seasonal adjusted series to 0.2% or $1.13 billion. Owner occupied lending rose 0.9% or $9.83 billion in original terms, or 0.7% or $7.34 billion in adjusted terms.

APRA’s latest monthly banking statistics for July 2017 reconfirms that growth in the mortgage books of the banks is still growing too fast. The value of their mortgage books rose 0.63% in the month to $1.57 trillion. Within that, owner occupied loans rose 0.73% to $1,017 billion whilst investor loans rose 0.44% to $522 billion. Investor loans were 35.18% of the portfolio. The monthly growth rates continue to accelerate, with both owner occupied and investor loans growing (despite the weak regulatory intervention).  On an annual basis, owner occupied loans are 6.9% higher than a year ago, and investor loans 4.8% higher. Both well above inflation and income growth, so household debt looks to rise further. The remarkable relative inaction by the regulators remains a mystery to me given these numbers. Whilst they jawbone about the risks of high household debt, they are not acting to control this growth, do not seem worried.

Indeed, the latest RBA Statement on Monetary Policy released today appears to be very upbeat. Despite forecasting growth down a bit in the near term, they are still holding the view of growth of 3% plus later, supported by and improving international economic outlook, a rise in business investment, strong exports and low unemployment. If this is correct, then it seems to me conditions would be right to lift the cash rate towards the neutral position (which as we saw recently they hold to be 2% higher than current levels). That said, many economic commentators think the RBA is overly bullish, given high household debt, flat income growth, and risks in the property market.

Within the statement they acknowledge that slow real wage growth is likely to weigh on consumption, especially if households expect the slow growth to continue for some time and  ongoing expectations for low real wage growth remain a key downside risk for household spending. The recent sharp increase in the relative price of utilities poses a further downside risk to the non-energy part of household consumption to the extent that households find it hard to reduce their energy consumption; this is likely to have a larger effect on the consumption decisions of lower-income households.

They also make the point that some households may also feel constrained from spending more from of their current incomes because of elevated levels of household debt. This effect would become more prominent if housing prices and other housing market conditions were to weaken significantly. Household debt is likely to remain elevated for some time: housing credit growth overall has been steady over the past six months, but has continued to outpace income growth.

That said, the composition of that debt is changing, as lenders respond to regulators’ recent measures to contain risks in the mortgage market. Investor credit growth has moderated and loan approvals data suggest this will continue in coming months. Also, new interest-only lending has declined recently in response to the higher interest rates now applying to these loans and other actions by the banks to tighten lending standards.

They held the cash rate again on Tuesday, and said rent increases remain low in most cities, but Investors in residential property are facing higher interest rates. There has also been some tightening of credit conditions following recent supervisory measures to address the risks associated with high and rising levels of household indebtedness. Growth in housing debt has been outpacing the slow growth in household incomes.

The latest Australian Bureau of Statistics (ABS) Retail Trade figures showed that the trend estimate for Australian retail turnover rose 0.4 per cent in June 2017 the same rate as in May. Compared to June 2016, the trend estimate rose 3.6 per cent. The trend by state shows Tasmania and ACT ahead of the average, with Western Australian and NT, continuing to trail.

So standing back, we have a mixed picture, but one where household debt is still rising, income remains under stress, and costs rising. As a result, we think the drag on growth is stronger than the RBA suggest. Pressure on budgets will constrain spending.  But, here’s the thing, if they are right, we should expect cash rate rises sooner, adding more pressure on household budgets. Looks like its heads you lose, tails they win – borrowing households will remain under the gun for some time to come, and the property market is at the centre of the storm.

And that’s the property imperative weekly to August 5th 2017
Renters Under Pressure – The Property Imperative Weekly 29 Jul 2017

Rental Stress is growing, and more property investors are underwater when it comes to covering their mortgage costs on an ongoing basis, so what are the implications for property investment as mortgage rates continue to rise? Welcome to the Property Imperative Weekly to 29th July 2017.

We start with our research on property investment, which was published this week. We look at this from two perspectives, first from the point of view of those renting, and second, from the perspective of those who are property investors.

Whilst there is considerable discussion about mortgage stress, rental distress hardly gets a mention yet there are more households in rental stress than in mortgage stress according to our analysis. We know their financial confidence on average is lower. First, we need to define rental stress. Whilst some will use a “30% of income to pay the rent” as a benchmark, we do not think it is an adequate measure – 30% is too arbitrary!

So we look at net cash flow. If households, once they pay their rent, tax and other outgoings have close to nothing left, or a small deficit, at the end of the month, they fall into our mild stressed category. Those with a severe cash deficit at the end of the month, are in severe stress.

We start by looking at the causes of rental stress. Using data from our surveys, we find that costs of living, under employment and flat incomes are the main causes.

More than half of renters in NSW are in rental stress (on our definition), and the highest proportion of any state here are in severe rental stress. The proportion of households in stress fades away as we look across the other states and territories. But the three most populous states have the highest rental stress levels.

Looking across our segments, we see that older households are more under stress, and a significant proportion are in severe stress.  Whilst wealthy seniors may hold some savings, stressed seniors do not. Many are reliant on Government support.

Greater Sydney and the Central Coast have the highest representation of stressed renters as a proportion of all households renting.

Looking across our geographic zones (a series of concentric rings around our main urban hubs) we see significant levels of stress in the urban centres, as well as on the urban fringe. The former is being created by high rents – especially in the newly constructed high-rise blocks being thrown up across the eastern states, often occupied by young affluent households; whilst in the urban fringe, it is more about depressed incomes. We see stress rolling out into the regions, but is less apparent in the more rural and remote areas.

All this highlights the issues renters have due to the combination of flat incomes, and rising costs, despite only small rises in rents.

Now, if we look at the other side of the coin, our research shows more investors have a net cash-flow problem, thanks to that flat rental income, whilst mortgage rates continue to rise.

The CPI data released this week by the ABS showed that overall inflation remains low.

But within the series there is a striking contrast. The Housing Group category of data rose 0.3 per cent for the quarter, and 2.4 per cent for the year to June 2017 but rent rose only 0.2 per cent for the quarter, and 0.6 per cent for the year.

It is worth reflecting on this in the light of the out of cycle rate hikes which property investors are experiencing, as the banks improve their margins using the alibi of regulatory tightening. In fact recent hikes being applied not just to new mortgages but to the entire book deliver a significant “bonus” to the banks.

First, let’s be clear rental rates have more to do with income that property prices, and the fact that rental rates have hardly grown reflects the stagnation in wages. Vacancy rates are also rising.

Second, the fact is a greater proportion of property investors are now underwater on a net rental cash flow basis. But the situation varies by state.  VIC and NSW have on average negative net returns. The net rental calculation is before any tax offsets.

Investors seem ok with negative cash-flow returns because in many cases they just offset the losses against tax, and comfort themselves with the thought that the capital value of the property is still rising (in most eastern states at least).

However, the divergent movement of mortgage rates and net rental returns are a leading indicator of trouble ahead, especially if capital growth reverses.

Given flat incomes, we think rentals will not grow much at all for some time, and remember more new properties are coming on stream, so vacancy rates are likely to continue to rise!

So in summary, we think more rental property will be vacant so holding rentals low (despite being expensive for many potential tenants) whilst investment costs will go on rising. As a result, we expect to see weaker demand for investment property, and should capital values start to fall, more owners will try and sell. In fact we think many property investors are in for a rude awaking, sufficient to tip the overall market lower, despite recent quite strong auction clearances.

More broadly the HIA reported that housing affordability declined further in the past quarter,  largely due to a rise in the median dwelling price of 9.1% per cent to a record high of $540,200. They say, NSW was the most significant negative influence on this result with affordability in Sydney now declining past a critical level (Sydney, – 0.7% and the rest of NSW, – 2.2 per cent). Acquiring and servicing a mortgage on a house in Sydney now requires more than two standard Sydney incomes. Sydney is the only market to have achieved this outcome in the 15-year history of their report. Affordability in Melbourne improved marginally in the quarter but remains 6.0 per cent less affordable than this time last year. Of the capitals where affordability worsened, the biggest deterioration was in Perth (-1.3 per cent).

Despite the fact the US Federal Reserve held their cash rate this week, signalling a slower rise in interest rates in America, Westpac lifted a range of their fixed term investor loans, with for example their 2-year fixed rising 31 basis points.  Bank West said  they would impose a 25 basis point increase for interest-only investor home loans; and a 35 basis points increase for interest-only owner-occupier home loans. They did offer small reductions to some owner occupied principal and interest borrowers. We are seeing a small flurry of rate cuts for some new borrowers ANZ for example is offering a 31 basis point drop for new two-year fixed residential investment loan for customers paying principal and interest (P&I), falling from 4.34 per cent per annum (p.a.) to 4.03 per cent p.a.

The round of mortgage rate repricing which we have been tracking for the past few weeks, with investor loan portfolios being strongly repriced, and owner occupied loans less impacted, has created a significant well of opportunity for banks to selectively offer attractor rates to principal and interest borrowers. In addition, funding costs are now lower, and the yield curve is less strongly indicating future increases, thanks to changes in the US financial markets and news that the ECB will continue its bond buying programme. But many existing borrowers are saddled with higher rates.  We expect to see a flurry of selective, targetted offers, aimed at acquiring new business and supporting loan portfolio growth.

Wages growth in Australia will remain muted for some time to come yet and RBA Governor Philip Lowe said that if some of the long standing links between income growth and monetary policy are not working as they did, more monetary stimulus may encourage investors to borrow to buy assets, which poses a medium-term risk to financial stability. In comments after the speech, he also made the point that surging asset prices has led to a growth in inequality across Australia.

We think the policy chickens are coming home to roost.  We have seen a significant decline in home ownership in recent years, from 69.5 per cent in 2002, to 67 per cent at the 2011 census, and to 65.5 per cent last year. This is a direct result of RBA policy, and the household debt bubble, which has pumped property prices way too high.

As a result, many younger Australians are being forced to rent, or take out very large mortgages. This debt burden will suck up much of their disposable income for the next 20-30 years, and will leave them exposed to future rate hikes. In a low interest rate environment, the capital owed does not depreciate as fast, so the burden is longer and heavier.  This has a knock-on effect on their ability to save for retirement, so their entire life may well be debt laden.

On the other hand, households holding property have enjoyed significant paper gains. Whether they keep them will be determined by future property prices, but there are more reasons to think prices will fall than rise.

A generation of poor myopic property driven policy will have significant negative long-term impact on the economy and lays at the heart of the inequality across the country, which was subject to much discussion this week. Prices may not drop much in the short term, but we believe they will correct eventually. The longer that takes, the bigger the fall ultimately will be.

And that’s the Property Imperative Week to 29th July 2017. Do subscribe to get our latest updates, and check back again next week. Thanks for watching.

Will Mortgage Rates Rise Further? – The Property Imperative Weekly 22 July 2017

How much will mortgage rates rise, and when? Welcome to the latest edition of the Property Imperative Weekly, our digest of important finance and property news.

Today we are looking back over the week to 22 July 2017. Banks, Mortgage Rates and Household Finances were all in the spotlight.

We start with APRA’s announcement that they will require banks to lift their capital ratios over the next few years, to ensure they are, to quote the Financial System Inquiry “Unquestionably Strong”. APRA focussed on the CET1 ratio, and they chose to take a long-term, through-the-cycle approach, rather than tying capital ratios to the top quartile of international banks.

Major banks will be required to hold an additional 150 basis points by 2020, whilst those on the standard capital approach, typically, smaller banks, will need a 50 basis point lift. In fact, most regional banks are already operating well above the target minimums, and the majors have been lifting their capital already, with some like ANZ likely to be at the required levels, whilst others, like CBA will need to bulk up, either using dividend re-investment plans, or by issuing more capital.  It does tilt the playing field slightly towards the smaller guys, but those who are investing big to migrate to the advanced IRB capital method will be a bit miffed.

APRA did not address the question raised by the Basel Committee and the new international framework still in the works, which is likely to raise internal-ratings based risk weights for investor mortgages and mortgages with high loan-to-value ratios. This change would further add to Australian banks’ capital needs.

Two points to make on all this. First, APRA has come out with a relatively small lift and below the expectations of many analysts, which is one reason why the bank stocks rose this week. It had all been well signalled. Second, APRA says the net impact will be around 10 basis points on income, and they flag this may be recovered from borrowers or from reduced dividends. If all of this was applied to mortgage portfolios, we think an uplift of 20 basis points or more would be needed. In practice there are so many moving parts in the banks treasury operations, we will never be able to isolate the impact of a single factor. But it does put more pressure, not less, on future mortgage rates

Also this week, the RBA released the minutes of their July meeting. It contained on interesting discussion on what the neutral interest rate in Australia at the moment. The “neutral” official cash rate they estimate is 3.5 per cent – a full 200 basis points above where the cash rate is now. This has two implications, first the current settings are stimulatory, and second, it was taken by many as hinting that rates will rise in the months ahead. The media spoke about a 2% rise in mortgage rates, coming soon.

We have been highlighting for some time now the current cash rate will rise at some point and the RBA language certainly reduces the likelihood of a further cut.  How soon a rise will hit though is uncertain, with Malcolm Turnbull on one hand warning households that they should prepare for higher rates, whilst on the other, later in the week, Deputy Governor Guy Debelle seemed to be hosing down expectations of a rise anytime soon.  He also indicated that the neutral cash rate is probably lower now than in the past, despite a trend towards rising rates elsewhere.

All of this may be confusing, but our perspective is the next move to the cash rate will be up, not down, and it could come anytime in the next few months, especially if inflation rises, and the growth in employment, as reported this week continues. What this means is that households do need to start planning for higher future rates, and we know from our mortgage stress work that around a quarter of mortgage holders have no wriggle room. Personal insolvencies have risen in the past year.

Whilst the current round of bank led mortgage repricing may have abated – there were no significant hikes for the first time for weeks – we do not think this is the end of rate lifts.

We think there are three groups of households who should be taking great care just now.

There are some amazing offers around for first time buyers, and lenders are falling over each other to try and attract them. This is because banks need new loans to fund their growth. But these buyers should beware. They are buying in at the top of the market, when rates are low. Banks have tightened their underwriting standards, but still they are too lax. Just because the bank says you can afford a loan does not mean it is the right thing to do. Any purchaser should run the numbers on a mortgage rate 3% (yes 3%) higher than the current rates on offer. If you can still afford the repayments, then go ahead. If not, and remember incomes are not growing very fast – best delay.

Second, there are people with mortgages in financial difficulty now. Well over 24% of households do not have sufficient cash-flow to pay the mortgage and other household expenses. The temptation is to use the credit card to fill the gap – but this is expensive, and only a short term fix. Households in strife need to build a budget (less than half have one) so they know what they are spending, and start to cut back. Talk to your lender also, as they have an obligation to assist in cases of hardship. And be very careful about refinancing your way out of trouble, it so often does not work.

Third there are property investors who are seeing rental incomes and mortgage repayments moving in opposite directions. As a result, despite tax breaks, investment property looks a less good deal. Of course recent capital gains are there – and some savvy investors are selling down to lock in capital value – but be careful now. New property investors are in for a shock as mortgage rates rise further. And multiple investors, are most at risk. Should property values decline, then this will mark the real turning point; but we think the investment property party may be over.

Cutting to the chase, mortgage rates will continue to rise, but the speed of such increases is hard to predict.

Next, the noise about mortgage broker commissions continued with consumer groups reinforcing their view that brokers are conflicted and current commission structures mean consumers are not getting the best outcomes, whilst industry associations continue to rubbish the criticism, and argue that brokers help to propagate competition in the mortgage market, and mortgage rates would be higher without brokers.

We think the right route is to reinforce disclosure. If brokers were to fully disclose their commissions, consumers could make a more informed choice. Some may choose to go with brokers who charge an advice fee, others may run with those offering the current “free” advice in return for payments from lenders. Mortgage brokers do actually offer a valuable service and should be remunerated for their efforts, but conflicts of interest which beset the current arrangements according to ASIC must be addressed. We are not sure the current industry led committee approach will get to the right outcome.

Finally, we published our latest household surveys which shows that whilst there are segmental movements in play, overall demand for property remains intact, despite rising mortgage interest rates and concerns about stalling income growth.

Results from our latest 52,000 survey show that first time buyers are being encouraged by the more generous first home owner grants on offer in several states. On the other hand, the relative benefit of home purchase relative to renting has reduced.


The biggest changes in the barriers first time buyers are experiencing relate to the availability of finance, whilst concerns about future interest rate rises, and rising costs of living reduced a little compared with our May results. Overall first time buyer demand is up.

Turning to property investors, the barriers to purchase are changing with a rise in those concerned about rising mortgage interest rates and availability of finance. The reasons to transact have shifted, with a significant rise in those saying they were driven by tax benefits (both negative gearing and capital gains) whilst there was a fall in those looking to appreciating property prices and low finance rates. Overall, investor demand is down a bit.

Another important group are those refinancing. After a strong swing in 2016 to get a better loan rate, there has been a rise in those seeking to reduce their monthly repayments.

So plotting the change of transaction intention over the next 12 months, we see a significant fall in both portfolio and solo property investors, but a rise in first time buyer purchasers expecting to transact.

Finally, we see that in relative terms, there is a fall in the proportion of property investors expecting to see home prices rising in the next 12 months, whilst first time buyers are a little more positive, and there has been little change in expectation across our other segments.

Putting all this together, we think demand for finance, and for property will remain quite strong, and on this read, it is unlikely home prices will fall much at all in the major eastern state markets. Other states are more at risk of a fall, which once again underscores the diversity in the market across Australia.  As a result, lenders will still be able to write more business, though the mix is changing. But affordability will remain a challenge.