Treasury Modelling Suggests Foreign Property Investors Have Only Small Impact

The Treasure released a working paper today – “Foreign Investment and Residential Property Price Growth“.  This paper explores the relationship between foreign investment in Australian residential real estate and property prices.

wolli-buildingThey take the number of foreign approvals (with exceptions), and look, at a postcode level for differences in purchase price, between those with high foreign transactions, and those will little or none.  They conclude that the increase in prices attributable to foreign investors is small when compared to the average quarterly increase in property prices of around $12,800 in Sydney and Melbourne during the study period. Across Sydney and Melbourne, for a typical postcode, foreign demand increases prices by between $80 and $122 on average in each quarter. Almost nothing.  We were not convinced.

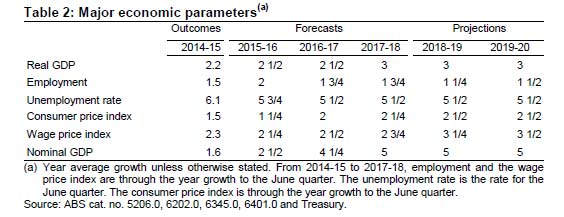
The number of foreign investment approvals has trended up in recent years, which has coincided with strong property price growth in many parts of Australia. While domestic buyers make up the vast majority of demand for property, it may be the case that, at the margin, foreign buyers are affecting property prices. This is because the stock of dwellings is relatively fixed in the short run so any increase in demand, whether from domestic or foreign sources, would be expected to result in higher prices, at least until increased prices have provided an incentive for the construction of additional supply. In the longer term, the high level of house prices in Australian capital cities, relative to those in other countries, likely reflects supply constraints. These constraints include state government land release and zoning policies, infrastructure provision and local government development approval processes.

Australia’s policy for foreign investment in residential real estate aims to increase Australia’s housing stock. As such, applications from  non-residents to purchase new properties are usually approved without conditions, but non-residents are prohibited from purchasing established dwellings. Temporary residents can apply to purchase one established property to use as a residence while they live in Australia. The majority of approvals have been granted for investment into new, as opposed to existing dwellings. This suggests that foreign demand is being channelled into increasing the property supply as intended. While some commentators have argued that foreign demand is pricing out first home buyers, it is not clear that this is the case. The number of foreign investment approvals granted for new properties is especially noteworthy given new properties make up a very small proportion of the total number of properties in Australia and because first home buyers tend to buy established properties.

In recent years the level of foreign demand for Australian property has increased strongly. This has been driven largely by increasing applications from Chinese nationals, which rose from around 50 per cent of total foreign investment approvals in mid-2010 to around 70 per cent in early 2015. The increased importance of Chinese demand to Australian real estate increases Australia’s exposure to factors affecting the Chinese economy. Further, any change to the relative attractiveness of holding assets outside of China or ability to do so will likely affect foreign demand for Australian property, which may have domestic economic and financial implications.

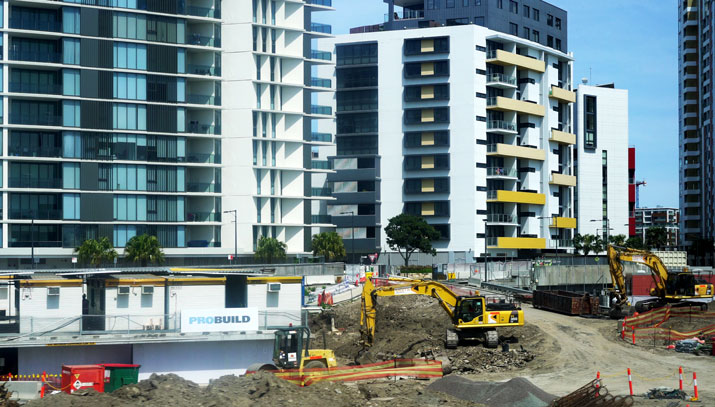
Over the period of this study, foreign investment in residential real estate has been concentrated in Melbourne and Sydney (Chart 1).

for-tres1But despite Melbourne receiving more foreign investment approvals than Sydney, price growth in Sydney has been much stronger than in Melbourne over the period. As such, it is difficult to directly attribute price growth in Sydney to foreign investors alone. Other factors, such as the relatively low number of building approvals, commencements and completions in the late 2000s are potential longer term drivers of the recent price growth in Sydney.

To estimate the sensitivity of property prices to changes in foreign demand we develop a fixed effects model of postcode level price growth using foreign investment approvals data from the Foreign Investment Division of the Treasury as the main explanatory variable.

Despite these shortcomings the data from the Foreign  Investment Division at the Treasury is preferable to alternative measures of foreign investment in residential property. These alternative measures, such as from the National Australia Bank, are problematic because they are based on survey data from
industry participants and it is not clear how these industry participants determine whether property buyers are foreign.

Under almost all model specifications there is a statistically significant and economically meaningful relationship between foreign investment approvals and property price growth, but the majority of price growth experienced in recent times does not appear to be attributable to increased foreign demand. Instead, the fact that property price growth has been strong over an extended period is likely to have been primarily driven by other factors such as impediments to supply, especially in some regions where natural and human-imposed constraints on supply are especially limiting.

The increase in prices attributable to foreign investors is small when compared to the average quarterly increase in property prices of around $12,800 in Sydney and Melbourne during the study period. Across Sydney and Melbourne, the models which we consider to be the best specified indicate that, for a typical postcode, foreign demand increases prices by between $80 and $122 on average in each quarter. This is based on the average postcode in these two cities receiving around 0.6 more foreign investment approvals each quarter over time. Further, for each additional foreign investment approval beyond this typical increase of 0.6, median property prices are estimated to rise by between $145 and $222.

Given that the typical increase in the number of foreign investment approvals from one quarter to the next in Sydney and Melbourne is only around 0.6, one additional foreign investment approval beyond this trend increase would be a relatively large spike in the number of approvals. As such, it can be seen that foreign demand has accounted for only a small proportion of the increase in property prices in recent years.

While the results of this study show a consistent, but small positive relationship between foreign investment approvals and property price growth, there are some limitations. This includes the data limitations set out in Section 3, particularly around compliance and that the data reflects intentions to purchase and not actual purchases. The foreign investment data also may not pick up purchases by a citizen or permanent resident on behalf of family members overseas. Quantifying the effect of these limitations is difficult. It is also important to note that while the results suggest the impact across Australia and the capital cities is small, the impacts in certain areas or at particular times may be more intense.

Whilst we applaud the Treasury for trying to bring science to this complex issue, we think there are fundamental flaws in the analysis, which devalues the conclusions significantly.

First, we think the modelling needs to look at total demand, at a post code level by purchaser type. We know from our own surveys, demand varies significantly driven by mix of prospective purchasers. In some locations, – for example Wolli Creek, we see high demand for foreign purchasers, first time buyers, other property investors and down traders – demand is outstripping supply, and here investors are outbidding first time buyers. This is the point, supply is not uniform, and therefore the pricing equilibrium will be quite different in individual locales. Reading their method, we think this is a significant issue.

Second their measure of foreign demand is the number of foreign investment approvals. This data are sourced from the Foreign Investment Division at the Treasury and it not available to the public, so the data cannot be validated, or independently reviewed. Recent inquiries however have called into question the accuracy of the approvals data. It likely understates the volume.   Why not release the data, so we can judge?

They did not include data on advanced off-the-plan foreign investment approvals, nor price data from off-the-plan sales from such developments. We believe that this is likely to miss bulk approvals from developers who, at a single application, and approval gets multiple property transactions approved.

They make the point that foreign investment approvals are concentrated in a relatively small number of postcodes — more than three quarters of postcodes receive less than one approval every three months.  Approvals do not represent actual purchases. For example, a foreign person may receive a foreign investment approval but later decide not to purchase a dwelling. No data are available regarding properties sold by foreigners. As such, the foreign investment data are an indication of gross foreign demand not net foreign demand. For instance, if a property is sold by one foreign person to another, there is no net change in foreign demand for
dwellings but an additional foreign investment approval will be recorded.  It is unclear when an approval for foreign investment will be acted upon because the approval is valid for 12 months. However, anecdotal evidence suggests that in most cases approvals are acted upon soon after being granted. In some cases an approval may be sought shortly after a
contract is entered into but before the conveyancing and settlement period is finalised. As such, they consider leading and lagging relationships in the Results section. This yields some insights into the behaviour of foreign investors.

Foreign investment approvals data do not distinguish between houses and units, so in postcodes with price data for both houses and units, they aggregate prices for these two property types. Specifically, this aggregation is weighted by the proportion of houses and units in each postcode. In postcodes where no price data are available for a particular property type at any time — for example, units in a regional postcode — but price data are available for the other property type — for example, houses — they use the available price data as a measure of postcode
level price.

They do not control for changes in the quality of properties in each postcode through time. We do not consider this to be a major limitation because of the relatively short time period of our study. However, the lack of hedonic adjustment could be problematic where price data are derived from a small number of sales. That is, where postcode level property markets are relatively illiquid and the quality of transacted properties changes through time even though the quality of properties in the postcode more broadly does not change.

So, we conclude this exercise may generate some heat, but we are not sure it casts light on the real issues surrounding foreign buyers. The data limitations and surrounding processes need to be improved if we are to get a handle on the true story.


The Resilience Of The Australian Economy

Secretary to the Treasury, John Fraser gave an address to the Australian Government Fixed Income Forum in Tokyo. He argues that the Australian economy continues to perform well and largely as expected in the 2016-17 Budget. It remains resilient in the face of global volatility. The economy is transitioning from an unprecedented mining investment boom to broader drivers of growth.

A stronger fiscal position is necessary and should go hand-in-hand with other policies to lift our growth and living standards. The outlook for the Australian economy is positive but keeping it that way is the challenge ahead.

He also discussed the high level of household debt, and housing sector, and the lack of business inves

The outlook for the Australian economy is positive.

Australia is entering its 26th year of continuous economic growth: we did not fall into recession in the aftermath of the global financial crisis of 2008, unlike many economies [Chart 1]. And real GDP is growing by 3.3 per cent per annum, faster than every country in the G7.

Chart 1: Real GDP growth: selected economies

GDP growth over the last 10 years

Chart 1: Real GDP growth: selected economies

GDP growth through the year to June qtr 2016

GDP growth through the year to June qtr 2016

Source: National Statistical Agencies, Thomson Reuters Datastream

This is the payoff from flexible macroeconomic policy frameworks, earlier microeconomic reforms and a once-in-a-lifetime mining boom.

We are doing very well – and this sometimes gets lost in the debate in Australia and abroad – but we are not guaranteed a strong future. If we want to grow faster, we must improve productivity. With historically high levels of government debt, we need to manage fiscal consolidation, but without slowing growth.

International Backdrop

This achievement is all the more remarkable against an international backdrop of slower-than-expected recovery in the global economy following the global financial crisis of 2008.

I recently returned from the US where the Treasurer attended the Annual Meetings of the IMF as well as a meeting of G20 Finance Ministers and Central Bank Governors. Discussions there focused on the current state of the global economy and the risks in the years ahead.

Prior to the meetings, the IMF released its October World Economic Outlook. Following previous growth downgrades earlier this year the IMF’s forecasts were unchanged from its July update. No further growth downgrades could be seen as a positive sign for the world economy. But the outlook for global growth remains subdued and downside risks remain across both advanced and emerging economies.

Importantly, Australia’s major trading partners are forecast to continue to grow at a stronger pace than the global economy [Chart 2]. This reflects our trade links to Asia, where growth remains relatively strong. Indeed, 8 out of Australia’s top 10 trade partners are in Asia.

Chart 2: Global Growth

Chart 2: Global Growth

Source: IMF October 2016 World Economic Outlook, ABS cat. No. 5368.0 and Treasury

Our region, Asia, is important for Australia, but also for the global economy. Asia continues to drive the world economy, with the IMF predicting the region will contribute more than 60 per cent of global growth through to 2021.

Of particular importance – for Australia and the world – are the implications of the transition of the Chinese economy towards a more consumer-driven growth model from its present reliance on investment. Sustainable growth in China is in our interest and China’s economic transition will present opportunities for Australia. However, this process is unlikely to be smooth and there is a tension between policies to support short-term growth and the structural reforms required to rebalance the economy.

The potential for this transition to lead to a greater-than-expected slowdown in the Chinese economy remains a key risk to Australia, the region and the global economy.

We are leveraged into the Chinese economy through many channels. One of the most important is merchandise trade [Chart 3].

Chart 3: China’s share of merchandise exports (selected regional economies)

Chart 3: China’s share of merchandise exports (selected regional economies)

Source: IMF Direction of Trade Statistics

That said, there will also be opportunities for Australia in China’s longer-term transition. Our past trade has mainly been focused on demand for our commodities; however, as China transitions trade will become more focused on demand for services.

Japan will also continue to present opportunities for Australia as our second-largest export destination and our second largest source of foreign direct investment.

Australia’s Economic Transition

In addition to the global headwinds, Australia is managing a transition of its own.

Australia’s terms of trade — the ratio of our export to import prices — reached its highest level in over five decades in 2011, and has since fallen by a third, underpinned by developments in bulk mining commodity prices [Chart 4].

Chart 4: Australia’s terms of trade

Chart 4: Australia’s terms of trade

Source: ABS cat. no. 5206.0.

As you are no doubt aware, in response to higher commodity prices Australia underwent a once-in-a-lifetime resources boom. Mining investment made an average contribution of 1 percentage point per annum to growth in the five years to 2012-13. It peaked as a share of GDP at 7.5 per cent in 2012-13. Since then it has made an average subtraction from growth of around 1 percentage point per annum as resources projects have been progressively completed.

Historically, resources booms have typically ended in nasty adjustments. Indeed, other commodity exporters have faced major economic downturns in response to the unwinding of their resources boom.

But, so far, Australia is successfully managing its transition to broader-based drivers of economic growth. Adjustments in interest rates, movement in the exchange rate and moderate wage growth are all working to shift resources from mining-related sectors to other sectors, particularly the service sectors.

In this regard it’s important to recognise that the Australian economy is quite diversified. Mining contributes 8 per cent directly to industry output. But, the Australian economy is heavily based on services, with the combined services sector comprising about 70 per cent of industry output and about 80 per cent of employment.

The transition is evident in labour market outcomes, with all employment growth over the last two years coming from services industries, mainly within the private sector.

It is also evident in strong growth in service exports, underpinned by an exchange rate that has depreciated by around 30 per cent against the United States dollar since the peak of the terms of trade in September 2011. Service exports grew by about 20 per cent over the last three years – as we take advantage of a growing middle class in Asia to increase our exports of tourism, education and business services.

Take tourism as an example. Export growth is being driven by a sharp increase in Chinese tourists. Around 1.2 million Chinese tourists have travelled to Australia over the past year – growth of around 22 per cent on the previous year. We have also seen a strong rise in visitors from other Asian nations.

Domestic Economic Outlook

Despite global volatility and the economic transition, the domestic outlook remains positive and is evolving broadly in line with our official forecasts.

The major contributors to ongoing growth include steady household consumption, strong growth in dwelling construction in major cities and a ramp up in exports. These are providing an offset to falling business investment.

Looking at the economy as a whole, the one thing we are missing is a resurgence in business investment. But that is a characteristic of many advanced economies.

Turning to the sectoral story in more detail, household consumption is expected to continue to grow steadily, underpinned by steady employment growth, low interest rates and a falling saving rate as households smooth consumption expenditure, including in response to the decline in the terms of trade. This follows a period of generally rising saving rates as households reacted to the rise in the terms of trade and uncertainty caused by the GFC and its aftermath.

Conditions in the housing market remain strong. This has been underpinned by a shift towards medium-high density dwellings, particularly in New South Wales, Victoria and Queensland [Chart 5]. That said, some indicators in the housing market have moderated since last year. While the level of housing investment is expected to remain high, growth is expected to ease as a record number of dwellings reach completion.

Chart 5: Building approvals

Chart 5: Building approvals

Source: ABS cat. no. 8731.0

We are alert to the downside risk that strong construction levels, tighter lending standards and rising construction costs could lead to activity declining more quickly than expected once the large construction pipeline is complete – particularly in the high-rise apartment market.

Another issue to monitor is private debt, particularly debt held by households, which has grown in Australia as recently flagged by the IMF. This could become a greater challenge if financing conditions become less favourable. That said, while household debt has risen over recent years so too have asset values. The net worth of households has grown by 60 per cent relative to its pre-crisis levels, led by increases in housing and land values as well as superannuation holdings. In addition, the bulk of Australian debt is held by those households with the highest incomes.

Export growth is being underpinned by the production phase of the mining boom, demand from Asia and the sharp depreciation in the exchange rate since 2012. Australia continues to expand iron ore exports. And the commodity export mix is changing as liquefied natural gas, or LNG, is expected to become Australia’s second largest export over the next few years. LNG production contributed around ½ of a percentage point to real GDP growth in 2015-16 and is expected to continue to make further significant contributions in the next few years.

In Australia, sharply falling mining investment as resources projects are completed will continue to act as a significant drag on overall business investment and in turn economic growth. Mining investment is expected to fall by 25½ per cent in 2016-17 and a further 14 per cent in 2017-18 [Chart 6]. As this detraction eases it is expected that investment in other areas of the economy will pick up, despite uncertainty over the exact pace and timing of this recovery.

Chart 6: Business Investment

Chart 6: Business Investment

Source: ABS cat. no. 5204.0 and Treasury.

Conditions are conducive for investment outside of the mining sector, with low borrowing costs, signs that firms are well placed to meet financial obligations, high levels of surveyed capacity utilisation, and domestic demand forecast to strengthen. However, leading indicators remain mixed, with some business expectations surveys suggesting non-mining businesses have yet to commit to significant new investment plans. This puts Australia in line with most advanced economies which are experiencing subdued business investment.

Another feature of advanced economies – Australia included – is low inflation and subdued wage growth. The headline Consumer Price Index in Australia rose 0.4 per cent in the June quarter to be 1.0 per cent higher through the year, the lowest growth rate since June 1999.

In Australia, declines in the terms of trade are weighing on national income. The strong supply response from commodity producers in the resources boom, as well as softening global demand, put downward pressure on commodity prices over recent years. So while Australia’s export volumes have increased, the price received for those exports has fallen. This is contributing to downward pressure on wage growth.

But subdued wages growth is supporting employment. Australia’s labour market is performing well. The unemployment rate declined from 6.3 per cent in July 2015 to around 5 ¾ per cent, supported by low wage growth and a shift to more labour-intensive industries. Labour force participation has remained elevated.

Demographic pressures from an ageing population are starting to have an impact on the Australian economy but with less effect than for many other advanced economies. Another aspect of our demographics that differentiates Australia is growth in our working age population, which is expected to remain steady at a relatively strong rate of about 1 per cent per annum, largely reflecting our successful migration program.

Maintaining strong Government balance sheets

Turning now to fiscal policy, Australia is one of only ten countries with a triple-A credit rating from all three of the major rating agencies, reflecting our strong economic fundamentals, sound policy frameworks and a track-record of fiscal responsibility. Our top credit rating was an important asset during the crisis, and of course it helps to contain the costs associated with servicing our public debt.

The Australian Government attaches a high priority to maintaining these triple A ratings, especially in the context of continued global economic uncertainty and heightened downside risks. I know from personal experience in the banking sector during the financial crisis how important a strong credit rating is to investor confidence.

We are very aware that these ratings are dependent on credible fiscal consolidation and a smooth transition to a more diverse economy.  We are not complacent about the challenges to achieving these goals.

Australia fared better than most during the Global Financial Crisis. The fact is that we were prepared — we entered 2008 with the government having negative net debt, triple A credit ratings and a well-capitalised and well-regulated financial sector. It is largely thanks to these preparations that the Australian economy managed to continue its historic run of uninterrupted annual growth over this tumultuous period.

However, like many other countries we continue to feel the legacies of the crisis, including the need to focus on budget repair.  We have run fiscal deficits since the crisis and are not forecast to return to surplus until 2020-21.

While the Government has made policy decisions to control the growth in expenditure, these savings have been offset by weaker revenue as a result of low nominal growth [Chart 7]. For example, the 2013-14 Budget projected a surplus of $6.6 billion for 2016-17. Since then, Government decisions have contributed another $7.6 billion to the cause of budget repair for the 2016-17 year. However, over the same period the impact of these decisions was swamped by movements outside the direct control of the Government, mostly as a result of lower than expected taxes.

Chart 7: Impact of policy decisions and parameter changes on the budget (2016-17)

Chart 7: Impact of policy decisions and parameter changes on the budget (2016-17)

Source: Treasury

The Commonwealth government’s gross debt is projected to increase by around $70 billion in 2016-17 and is approaching 30 per cent of GDP. While our public debt is low by international standards, and our placements are well covered, we are not complacent about the recent growth in our debt.

Of course, Australia has always been a net importer of capital. This has been an important source of our prosperity and development. However, it does mean we have less head room for government debt than many other advanced economies that fund their own debt. More than half of Australian public debt is held by non-residents, exposing Australia somewhat to volatility in global capital markets [Chart 8].

Chart 8: Gross debt in the Australian economy

Chart 8: Gross debt in the Australian economy

Source: ABS cat. no. 5232.0 and 5206.0.

In thinking about the appropriate level of public debt, it is also important to consider the extent of private indebtedness, and the interlinkages. Growing private debt could lead to increased public debt. And growing public debt has implications for private borrowing, such as in the event of a sovereign rating downgrade increasing borrowing costs across the economy.

Private debt is not only at historical highs for Australia, but it is also high compared to other countries. Australian households are the fifth most indebted in the OECD, with debt equal to 186 per cent of net disposable income. Private gross household debt has more than doubled over the past two decades as a proportion of GDP.

The financial risks associated with this debt are being actively managed. More than half of Australia’s total foreign borrowing is denominated in Australian dollars and banks’ foreign exchange risk is almost completely hedged. In aggregate, net of hedging, Australia’s foreign currency exposures are on the asset side of the balance sheet, reflecting the growing pool of superannuation assets and international diversification. Taking account of the assets that Australians hold in the rest of the world, our net external debt has also been growing and is about one fifth higher than it was twenty years ago.

The Australian Government’s fiscal strategy is directed to building the resilience of our economy by keeping debt under control — returning the budget to balance through disciplined expenditure restraint and a growth friendly tax system.

Progress in fiscal consolidation will help maintain investor confidence and facilitate investment and growth. But this is no easy task. Deficits have proven very difficult to shift in recent years. In particular, low nominal growth has been a strong headwind to bringing the budget back to balance.

The priority for budget repair is to control the growth in expenditure [Chart 9]. In particular, we recognise that it is not sustainable for Australia to finance our recurrent expenditure by increasing debt.

Chart 9: Payments and receipts to GDP

Chart 9: Payments and receipts to GDP

Source: Treasury, dotted lines indicate 30-year averages

If we cannot control our expenditure, there will be greater pressure to find revenue to balance the budget. However, the Government is determined that our tax system should support the investment and innovation that is needed to fuel potential growth.

Australian Treasury analysis, published earlier this year, showed an increase in income tax would inflict significant costs in the form of reduced jobs, investment, consumption and economic growth. In particular, as a net importer of capital, the tax burden we impose on capital income needs to be internationally competitive. We also need to recognise that labour is increasing mobile and that Australia must compete for global talent.  This leads us to the fundamental conclusion that we need to contain spending.

Unsurprisingly, the focus of our efforts is in the largest spending areas, including social services. Reining in the growth in welfare spending is one of the biggest challenges confronting the process of budget repair.

Against this backdrop, the Government finds itself with a slim majority in the Parliament. This presents a challenge of needing to work with a diverse range of interests in order to advance the Government’s legislative agenda. But it is also an opportunity to build broad support for the reform agenda that is needed to secure Australian living standards into the future.

Last month, the Government made some important progress in legislating a package of $6.3 billion in expenditure reductions. This will reduce Commonwealth debt by more than $30 billion by 2026-27. It is an important start to the current term of government, though much remains to be done – including another $20 billion of announced measures that are yet to be approved by the Parliament.

Government Trumpets Foreign Buyer Clampdown

In a statement today, the Treasurer highlighted further forced sales and fines imposed on foreign investors who have purchased a residential property. The body count is 46, with 400 still under investigation, so the number of actions, and amounts involved are very small, when compared to the whole market.

Investment--PIC

Treasurer the Hon. Scott Morrison has ordered the divestment of a further 16 Australian residential properties that have been held by foreign nationals in breach of the foreign investment framework, taking the total purchase price of Australian residential real estate divested to over $92 million.

“The divestments of these 16 properties, which have a combined purchase price of over $14 million, are further evidence of the Turnbull Government’s commitment to enforcing our rules so that foreign nationals illegally holding Australian property are identified and their illegal holdings relinquished,” Mr Morrison said.

“Foreign investment provides significant benefits for Australia but we must also ensure that such investment benefits all Australians, is in-line with our rules and is not contrary to our national interest.

“The 16 properties were purchased in Victoria, New South Wales, Queensland and Western Australia with prices ranging from approximately $200,000 to $2 million. The individuals involved come from a range of countries including the United Kingdom, Malaysia, China and Canada.

“The foreign investors either purchased established residential property without Foreign Investment Review Board approval, or had approval but their circumstances changed meaning they were breaking the rules.

“Since taking office in 2013, the Coalition Government has forced foreign nationals to divest a total of 46 properties. Under the previous Labor government, no foreign nationals were forced to divest illegally held Australian property.

“These divestments are a reminder that the Coalition Government’s increased compliance measures, which include transferring responsibility for residential real estate enforcement to the Australian Taxation Office (ATO), are working to ensure our foreign investment rules are being enforced.

“Since the Government’s transfer of responsibility to the ATO for compliance in May 2015, over 2,200 matters have been referred for investigation. Through information provided by the public, together with the ATO’s own enquiries, approximately 400 cases remain under active investigation.

“Since a new penalty regime was introduced from 1 December last year, 179 penalty notices have been issued, totaling over $900,000. Penalty notices have been issued to people who have failed to obtain FIRB approval before buying property as well as for breaching a condition of previously approved applications.

“Illegal real estate purchases by foreign citizens attract criminal penalties of up to $135,000 or three years’ imprisonment, or both for individuals; and up to $675,000 for companies. The new rules also allow capital gains made on illegal investments to be forfeited.

“In addition to divestments, a number of people came forward during the reduced penalty period who were not in breach and some who voluntarily sold their properties while the ATO was examining their case. There are at least 25 examples of foreign investors self-divesting in this way showing a change in behaviour towards more compliance with the rules and a strengthening of the program overall.

“While Australia welcomes foreign investment, foreign investors must comply with our laws,” Mr Morrison said.

Statement on the Conduct of Monetary Policy

The Treasurer and Governor of the Reserve Bank have reaffirmed the statement on the Conduct of Monetary Policy.  Both the Reserve Bank and the Government agree that a flexible medium-term inflation target is the appropriate framework for achieving medium-term price stability. They agree that an appropriate goal is to keep consumer price inflation between 2 and 3 per cent, on average, over time.

RBA-Pic2

The Statement on the Conduct of Monetary Policy (the Statement) has recorded the common understanding of the Governor, as Chair of the Reserve Bank Board, and the Government on key aspects of Australia’s monetary and central banking policy framework since 1996.

The Statement seeks to foster a sound understanding of the nature of the relationship between the Reserve Bank and the Government, the objectives of monetary policy, the mechanisms for ensuring transparency and accountability in the way policy is conducted, and the independence of the Reserve Bank.

The centrepiece of the Statement is the inflation targeting framework, which has formed the basis of Australia’s monetary policy framework since the early 1990s.

The Statement has also been updated over time to reflect enhanced transparency of the Reserve Bank’s policy decisions and to record the Bank’s longstanding responsibility for financial system stability.

Building on this foundation, the current Statement reiterates the core understandings that allow the Bank to best discharge its duty to direct monetary policy and protect financial system stability for the betterment of the people of Australia.

Relationship between the Reserve Bank and the Government

The Reserve Bank Governor, its Board and its employees have a duty to serve the people of Australia to the best of their ability. In the carrying out of their statutory obligations, through public discourse and in domestic and international forums, representatives of the Bank will continue to serve the best interests of the people of Australia with honesty and integrity.

The Governor and the members of the Reserve Bank Board are appointed by the Government of the day, but are afforded substantial independence under the Reserve Bank Act 1959 (the Act) to conduct the monetary and banking policies of the Bank, so as to best achieve the objectives of the Bank as set out in the Act.

The Government recognises and will continue to respect the Reserve Bank’s independence, as provided by the Act.

The Government also recognises the importance of the Reserve Bank having a strong balance sheet and the Treasurer will pay due regard to that when deciding each year on the distribution of the Reserve Bank’s earnings under the Act.

New appointments to the Reserve Bank Board will be made by the Treasurer from a register of eminent candidates of the highest integrity maintained by the Secretary to the Treasury and the Governor. This procedure ensures only the best qualified candidates are appointed to the Reserve Bank Board.

Objectives of Monetary Policy

The goals of monetary policy are set out in the Act, which requires the Reserve Bank Board to conduct monetary policy in a way that, in the Reserve Bank Board’s opinion, will best contribute to:

  1. the stability of the currency of Australia;
  2. the maintenance of full employment in Australia; and
  3. the economic prosperity and welfare of the people of Australia.

These objectives allow the Reserve Bank Board to focus on price (currency) stability, which is a crucial precondition for long-term economic growth and employment, while taking account of the implications of monetary policy for activity and levels of employment in the short term.

Both the Reserve Bank and the Government agree on the importance of low and stable inflation.

Effective management of inflation to provide greater certainty and to guide expectations assists businesses and households in making sound investment decisions. Low and stable inflation underpins the creation of jobs, protects the savings of Australians and preserves the value of the currency.

Both the Reserve Bank and the Government agree that a flexible medium-term inflation target is the appropriate framework for achieving medium-term price stability. They agree that an appropriate goal is to keep consumer price inflation between 2 and 3 per cent, on average, over time. This formulation allows for the natural short-run variation in inflation over the economic cycle and the medium-term focus provides the flexibility for the Reserve Bank to set its policy so as best to achieve its broad objectives, including financial stability. The 2-3 per cent medium-term goal provides a clearly identifiable performance benchmark over time.

The Governor expresses his continuing commitment to the inflation objective, consistent with his duties under the Act. For its part the Government endorses the inflation objective and emphasises the role that disciplined fiscal policy must play in achieving medium-term price stability.

Consistent with its responsibilities for economic policy as a whole, the Government reserves the right to comment on monetary policy from time to time.

Transparency and Accountability

Transparency in the Reserve Bank’s views on economic developments and their implications for policy are crucial to shaping inflation expectations.

The Reserve Bank takes a number of steps to ensure the conduct of monetary policy is transparent. These steps include statements announcing and explaining each monetary policy decision, the release of minutes providing background to the Board’s policy deliberations, and commentary and analysis on the economic outlook provided through public addresses and regular publications such as its quarterly Statement on Monetary Policy and Bulletin. The Reserve Bank will continue to promote public understanding in this way.

In addition, the Governor will continue to be available to report twice a year to the House of Representatives Standing Committee on Economics, and to other Parliamentary committees as appropriate.

The Treasurer expresses support for the continuation of these arrangements, which reflect international best practice and enhance the public’s confidence in the independence and integrity of the monetary policy process.

Financial Stability

Financial stability, which is critical to a stable macroeconomic environment, is a longstanding responsibility of the Reserve Bank and its Board.

The Reserve Bank promotes the stability of the Australian financial system through managing and providing liquidity to the system, and chairing the Council of Financial Regulators (comprising the Reserve Bank, Australian Prudential Regulation Authority, the Australian Securities and Investments Commission and the Treasury).

The Payments System Board has explicit regulatory authority for payments system stability. In fulfilling these obligations, the Reserve Bank will continue to publish its analysis of financial stability matters through its half-yearly Financial Stability Review.

In addition, the Governor and the Reserve Bank will continue to participate, where appropriate, in the development of financial system policy, including any substantial Government reviews, or international reviews, of the financial system itself.

The Reserve Bank’s mandate to uphold financial stability does not equate to a guarantee of solvency for financial institutions, and the Bank does not see its balance sheet as being available to support insolvent institutions. However, the Reserve Bank’s central position in the financial system, and its position as the ultimate provider of liquidity to the system, gives it a key role in financial crisis management. In fulfilling this role, the Reserve Bank will continue to coordinate closely with the Government and with the other Council agencies.

The Treasurer and the Governor express their support for these longstanding arrangements continuing.

The Economic Foundations of Tax Reform

Roger Brake, Division Head, Tax Framework Division at The Treasury gave an interesting speech today “Tax Reform and Policy for an Economy in Transition”. Essentially, we face a number of headwinds, including falling productivity, shifting demographics, slower growth, more adverse terms of trade and rising personal income tax. I have selected some of the more striking charts, but the entire speech is worth reading.

Treasury is establishing a new, ongoing Tax Framework Division to sit alongside our two existing policy divisions, our Law Design Practice and our quantitatively-focussed Tax Analysis Division.

This Division will be responsible for thinking about cross-tax system issues, including how economic developments are affecting the tax system. It will also monitor international developments in tax at a high level, both in terms of the structure of other countries tax systems and advances in thinking on key tax issues. It will also engage on state tax issues. The Division is also expected to play a role progressing the tax simplification agenda.

The Division will engage closely with other Treasury divisions, academia, the private sector and our State and Territory counterparts.

The Australian economy is recording good growth relative to other advanced economies and is transitioning away from the boom in mining investment towards broader growth. However, growth in living standards is not projected to return to mining boom levels. This has implications for the revenue our tax system will generate. It means that, for a given share of tax to the overall economy, the annual growth in revenue is not expected to be as strong as in the past.

Changes in the composition of the economy, and technological developments, will continue to affect the composition of tax revenues. Predicting the magnitude and speed, and in some cases even the direction, of these developments is very difficult. Nevertheless, it is important that these developments continue to be watched very carefully for their revenue implications over time.

The Government has a large and important tax agenda. The reforms will boost our international competitiveness, while improving the integrity and sustainability of the tax system. Treasury is working on the policy and legislative products needed to implement those policies.Treasury is also focussing on simplification proposals, working particularly with the Board of Taxation.

To ensure that a whole-of-tax approach is brought to bear on key issues, Treasury is establishing a new Tax Framework Division. We are also continuing to build our internal capacity and our engagement with stakeholders.

Productivity

In terms of productivity, advanced economies have experienced a long-run trend decline in productivity growth (Chart 3). Australia and the US had a brief period of strong productivity growth in the late 1990s and early 2000s (due to a combination of microeconomic reform and gains from information and communications technology but growth has since slowed).

Chart 3: Productivity growth rates – Australia, USA and advanced economies

Source: Treasury

Note: Productivity growth rates are presented as a rolling five-year average to minimise annual volatility and highlight more persistent trends.

As you can see from this chart, we are not alone. Indeed the OECD estimates that almost all of its member countries have experienced a slowing of productivity growth since 2000, coupled with an increased divergence between the productivity growth rates of leading businesses and other businesses.

What explains this poor productivity performance among advanced economies? How do we reconcile it with dramatic changes in technology, including the sweeping changes we all experience from the digital economy? This is one of the big issues facing economists and so far there is no consensus on why it has happened. This matters a lot to Australia – in the long run, our potential productivity growth is constrained by the global ‘productivity frontier’.

Demographics

Demographic pressures, including slower population growth and ageing populations are already having a profound effect on the global economy and this will continue.

Ageing populations in many advanced economies are likely to lead to a decrease in participation rates in coming decades and as a result, there will be a smaller share of the population active in the workforce. This trend is already evident in the two largest advanced economies of the world – the US and Japan. The traditional working age populations (people aged 15 to 64) of our top two export destinations, China and Japan, are shrinking (Chart 4).

A key question is: to what extent the effects of an ageing population are offset by higher participation rates. In Japan, for example, the labour force participation rate has fallen from 64 per cent in 1992, when the working age population peaked as a proportion of the total population, to 59.6 per cent in 2015. This is despite an increase in the participation rate of the working age population, primarily driven by an increase in female labour force participation in this age group from 58.3 per cent to 66.7 over the same period.

Chart 4: Growth in working age populations

Source: 2015 UN Population Prospects, ABS, Treasury

Australia’s economic transition

Against this backdrop, the Australian economy is in the midst of a transition from mining investment to broader based drivers of growth.

In 2011-12 mining investment contributed 2.8 percentage points to GDP growth. At Budget, mining investment was expected to detract around 1½ percentage points from growth in 2015-16. Rather, household consumption, dwelling investment and exports have been supporting activity and this is expected to continue in the near term. The Budget forecast real GDP to grow 2 ½ per cent in both 2015-16 and 2016-17 before strengthening to 3 per cent in 2017-18. This is a little lower than the 20 year average of 3.2 per cent (Chart 8).

Chart 8: Real GDP growth

Real GDP measures the volume of goods and services we produce. However, our national income depends not only on the volume of what we produce, but also our terms of trade. During the 2000s, commodity export prices rose much faster than import prices, leading to an unprecedented surge in the terms of trade, and strong growth in incomes (Chart 9). After the financial crisis, strong Chinese demand for our mining exports pushed up commodity prices and helped insulate Australia from the weak growth experienced in many parts of the world. Following a peak in the terms of trade in September 2011, steep falls in commodity prices have weighed on national income since that time.

Chart 9: Terms of trade

Source: ABS Cat. No. 5206.0

Over recent years, large increases in supply, including from Australia, combined with moderating global demand, primarily from China, has seen commodity prices fall significantly from their peaks. This has caused the terms of trade to decline and the Australian dollar to depreciate.

The lower nominal exchange rate has facilitated the transitions taking place by providing significant support for firms producing tradeable goods and services. Indeed services exports have expanded noticeably over the past few years, especially in tourism, education and business services.

This is combining with low wage growth to put downward pressure on the real exchange rate and help improve Australia’s competitiveness internationally. These forces should continue to assist the adjustments taking place in the economy and encourage firms to employ more workers. This has been aided by strong growth in the economy’s labour-intensive services industries, as well as workforce flexibility – which has allowed firms to adjust labour input through changes in hours rather than employment levels.

As with any adjustment, the economic transition may not be smooth and is subject to uncertainty. Non-mining business investment is taking longer than anticipated to pick up, despite accommodative conditions being in place.

The most recent measure of business’ expected capital expenditure shows that non-mining businesses have not yet committed to significant new investment plans in 2016-17.

The pipeline of dwelling investment means it should continue to grow strongly over the next year but beyond that time it is not expected to contribute significantly to growth.

The expected continued growth in consumption spending is also dependent upon the savings rate continuing to fall. While the savings rate has been trending down since its peak in 2011-12, it is unclear where it will settle.

Demographics

In the medium term, Australia’s economic growth will be determined by the size of the labour force – both population growth and rates of labour force participation – and labour productivity.

In terms of Australia’s demographics, our story is similar to that in many parts of the world. Our population is ageing, reflecting continued gains in life expectancy and declines in fertility rates. This means that in the future, there will be a significantly smaller share of people of traditional working age, that is, between 15 and 64 years of age (Chart 10)ii. The Intergenerational Report (IGR) released in March 2015 noted that in 1974-75 there were 7.3 people in this age group for every person aged 65 and over. This decreased to 4.5 people by 2014-15 and is projected to decrease even further to 2.7 people by 2054-55.

Chart 10: Number of people aged from 15 to 64 relative to the number of people aged 65 and over

Source: 2015 Intergenerational Report.

This will place downward pressure on workforce participation which will detract from economic growth and growth in living standards.

By 2054-55, the participation rate for Australians aged 15 years and over is projected to fall to 62.4 per cent in 2054-55, compared with 64.6 per cent in 2014-15.

Despite this broad trend, there have been some positive trends in participation amongst older Australians and women.

Between 1978-79 and 2013-14 the participation rate of people aged 55 to 64 increased from 45.6 per cent to 63.8 per cent. Older people have been able to extend their labour force participation as a result of the improvements that have led to longer life expectancy, the rise of less physically demanding work and new technologies.

In addition, there has been strong growth in female participation over the past 40 years. In 1975, only 46 per cent of women aged 15 to 64 had a job. Today around 66 per cent of women aged 15 to 64 are employed. By 2054-55, female employment is projected to increase to around 70 per cent. The increase in female participation rates has been the result of increased levels of education, changing social attitudes towards gender roles, declining fertility rates, better access to childcare services and more flexible working arrangements.

While this is positive, at 70 per cent there are quite clearly further gains that can be made on this front.

For this reason, there has been, and will likely continue to be, a focus on the drivers of participation among groups with lower participation rates, including women and older Australians, and the role for policy.

Productivity

While lifting participation will deliver a growth dividend, it is widely acknowledged that improvements in productivity will be the key driver of Australia’s medium term growth prospects and indeed living standards.

Chart 11 shows the sources of our national income growth over the past five decades. Productivity growth has played the leading role in increasing our prosperity. However, as the chart makes clear, challenges are ahead.

Chart 11: Contribution to per capita income growth

Source: Treasury

In a period of falling terms of trade and labour force participation, future growth in living standards will again rely more heavily on labour productivity growth.

Economic developments and the tax system

Let me turn now to what these economic developments mean for the tax system.

Understanding these developments is a very important task for Treasury. Clearly, it is critical for the Government and the community that we have a tax system that raises revenue in a robust way to enable effective government budgeting. So we collectively have a keen interest in how changes in the economy and the way business operate will affect our revenue base over time.

While this is very important, it is also very challenging. The economy is always evolving in ways that are hard to predict. Even looking at past data, it can be hard to divine what will be a long term trend and what may be a cyclical phenomenon that will have only a transitory effect. Even where there are some relatively easy-to-predict structural changes, accurately quantifying the magnitude of the effect and the time horizon over which it will occur can be fraught.

So, with those caveats in mind, let’s look at what has happened to tax trends and what may happen going forward.

Let’s first look at the aggregate story for Commonwealth revenue – the tax:GDP ratio.

Chart 12 shows the evolution of the Commonwealth’s tax:GDP ratio since 2001-02 (excluding the GST). Following a sustained period where the ratio was around 20 per cent, it fell to below 17 per cent. This fall was more severe than at any time since the 1950s. The ratio has slowly increased to be almost 19 per cent, and is projected to reach around 20 per cent by 2019-20.

Chart 12: Total Taxation Receipts as a proportion of GDP (excluding GST)

Source: Treasury

It is important to note that the tax:GDP ratio is not only a function of tax policy but also changes in the structure of the economy, changes in asset prices, changes in consumption patterns and so on.

In terms of cyclical influences on the Commonwealth’s tax receipts, high equity and commodity prices during the mid-2000s saw the tax-to-GDP ratio rise to a record high of 24.3 per cent (or 20.5 per cent excluding GST as shown in Chart 10), before falling during the global financial crisis as corporate profitability fell and asset prices fell dramatically. The economic recovery has helped lift the tax:GDP ratio subsequently.

Changes in the pattern of consumption and activity have also contributed to the underlying trend decline in the tax:GDP ratio. The relative declines in consumption of tobacco and beer, and the trend towards more fuel efficient vehicles have all had an effect.

Structural changes to the tax base as a result of Government policy also contributed to changes in the tax-to-GDP ratio. This includes personal income tax cuts and bracket creep, the non-indexation (and now re-indexation) of fuel excise, tariff reductions and a host of specific incentives and base broadening measures.

By definition, the rise in the tax:GDP ratio in recent years means that tax receipts have grown faster than nominal GDP. However the growth in tax receipts has nonetheless been lower than during the mining boom when tax receipts were not growing faster than GDP. From 2000-01 to 2007-08, tax receipts recorded annual average growth of 7.3 per cent. From 2009-10 to 2014-15, growth averaged only 6.2 per cent.

Put another way, because GDP growth is lower, for a given tax:GDP ratio, annual revenue growth is lower. In fact, the only way to maintain revenue growth of the level experienced with the mining boom would be to have tax receipts continue to outstrip nominal GDP indefinitely.

Looking at the aggregate picture is important, but our tax system depends on the effectiveness of each of the specific revenue heads. I don’t have time to talk about all of them today, but I wanted to focus on company tax, CGT, indirect taxes and individuals income tax. While our tax:GDP ratio is projected at the end of this decade to be roughly the same as it was during the pre-GFC 2000s period, the composition will be different. Corporate tax and indirect tax will be lower, while individuals income tax is expected to be a little higher. You can see these trends in Chart 13.

Chart 13: Australia’s evolving tax mix

Source: Treasury

Note: Corporate taxes includes company tax, superannuation fund taxes, Minerals Resource Rent Tax and Petroleum Resource Rent Tax.

While cyclical and structural factors have impacted on all heads of revenue, the impact of Australia’s transitioning economy on the company tax base is perhaps most stark.

Individuals income tax

As a share of GDP, between 2004-05 and 2010-11 individuals income tax (including FBT) fell significantly (see Chart 17).

Chart 17: Individuals and other withholding taxes + fringe benefits tax as a percentage of GDP

Source: Treasury

This was largely structural, driven by a succession of individuals income tax rate reductions. Taxes on wages fell from 11.9 per cent of GDP in 2004-05 to 9.6 per cent of GDP in 2010-11, a decrease to the tax-to-GDP ratio of around 2.3 percentage points (19 per cent).

Following the crisis, the individuals income tax-to-GDP ratio has recovered and is forecast to grow as a share of GDP over the period ahead. Recognising the impact that individuals income tax can have on participation, investment in human and physical capital and entrepreneurship, the Government announced that it will increase the 32.5 per cent threshold from $80000 to $87000. It further indicated that it would consider options to reduce the burden of tax on individuals over time as fiscal settings allow.

Economic Outlook Better, Later

The Pre-election Economic and Fiscal Outlook 2016 is out.  The modelling is close to the budget numbers – though the deficit will be bigger sooner, then begin to reduce. The underlying cash balance is estimated to be a deficit of $37.1 billion (2.2 per cent of GDP) in 2016-17, improving to a deficit of $5.9 billion (0.3 per cent of GDP) in 2019-20. The current financial year deficit estimate has been changed since the budget, increasing by $100 million to $40 billion.  As with any “hockey stick” projections, you just know the timing of improvements will be uncertain.

Outlook1The 2016 PEFO uses the same projection methodology that has been used in budgets and budget updates since the 2014-15 Budget.

Treasury’s medium-term economic projection methodology assumes that any estimated gap between forecast real GDP and potential GDP closes over the first five projection years (2018-19 to 2022-23) as spare capacity in the labour market is absorbed. Beyond that point, real GDP and other economic variables are assumed to grow in line with their estimated long-run trend rates.

The medium-term economic and fiscal projections are sensitive to the assumptions that underpin Treasury’s estimate of potential GDP — that is, assumptions about population, productivity and participation. They are also sensitive to the assumed pace of the economy’s return to potential — that is, the assumption that the adjustment period lasts five years.

Analysis reported in the 2016-17 Budget shows that a faster (two year) adjustment to potential requires comparatively faster growth in real GDP and employment as the output gap closes and spare labour is put to use. This leads to lower unemployment and faster growth in wages and domestic prices, increasing nominal GDP and improving the projected underlying cash balance over the medium term even as
Pre-election Economic and Fiscal Outlook 2016 long-run real GDP is unchanged from the Budget projections. A more gradual adjustment period (eight years) is estimated to have broadly opposite effects on the projections.

Analysis in the 2016-17 Budget also shows that lower trend productivity growth than assumed in the Budget projections would directly reduce potential growth — leading to permanently lower real GDP and wages with only a small impact on prices. In this scenario, lower nominal GDP leads to lower projected tax receipts which weakens the projected underlying cash balance over the medium term. By contrast, assuming faster trend productivity growth than assumed in the Budget projections results in higher nominal GDP and tax receipts, strengthening the underlying cash balance.

Net debt, net financial worth, net worth and net interest payments are essentially the same as published at the 2016-17 Budget. In 2016-17, net debt for the Australian Government general government sector is expected to be $326.1 billion (18.9 per cent of GDP). Net financial worth is estimated to be -$427.2 billion and net worth is estimated to be -$301.0 billion.

Net interest payments are estimated to be $12.6 billion in 2016-17 (0.7 per cent of GDP). Interest payments largely relate to the public debt interest on government securities, based on the interest rates on the existing stock of Commonwealth Government Securities (CGS) and the prevailing market interest rates across the yield curve for future issuance of CGS. This PEFO assumes a weighted average cost of borrowing of around 2.5 per cent for future issuance of Treasury Bonds in the forward estimates period, the same as the assumed market yields used in the 2016-17 Budget. Yields are volatile and could vary from those assumed in the Budget. Recent movements in interest rates, if maintained, would lower the government cost of borrowing, reducing interest payments and expenses over the forward estimates. It would also reduce interest receipts earned on assets.

Economic Risks

The Secretary to the Treasury, John A. Fraser, has provided an opening statement to the 2016-17 Budget Estimates session of the Senate Economics Legislation Committee. In the statement he discusses weak inflation, prospective economic growth across the states, and the litany of global economic risks, including from a slowing China, financial markets, and low inflation. The fact is that global economic conditions continue to be challenging. Finally, he speaks to the 10 year costs of the budget plan to cut company tax over 10 years and lifting the small business threshold.

In essence, the Budget forecasts indicate that the Australian economy continues to transition from mining investment-led growth to broader-based growth. But real GDP growth is forecast to be below potential over the next two years at 2½ per cent in 2015-16 and 2016-17 and then strengthen to 3 per cent in 2017-18 as the detraction from falling mining investment eases. Over the following two years, real GDP is projected (not forecast) to increase by 3 per cent per annum.

The economy is already benefiting from rapidly rising mining export volumes and this is set to continue as more LNG export capacity comes on line. Mining export volumes are expected to increase by more than 20 per cent over the forecast period.

In the midst of this transition and as noted at our most recent Hearing, the labour market has been remarkably resilient. The labour market has performed better than expected at 2015‑16 MYEFO. Employment growth has been supported by moderate wage growth and the transition to more labour-intensive sectors of the economy.

Inflation outcomes so far appear to have been weaker than forecast in the 2015‑16 MYEFO. Consumer price inflation in the March 2016 quarter showed broad‑based weakness that was reflected in the very weak underlying inflation outcome. In that context, the Reserve Bank Board decided to reduce the cash rate by 25 basis points to 1.75 per cent, the lowest setting on record.

Reports from across Australia indicate that activity in New South Wales and Victoria remain strongest, while activity in Tasmania has also picked up. The Northern Territory and the Australian Capital Territory are performing reasonably well and Queensland is performing better than expected a year ago supported by a pick-up in construction activity around Brisbane. South Australia continues to remain soft, and there are clear signs that activity in Western Australia is weaker than expected.

Globally, growth is forecast to be weaker than 2015-16 MYEFO. The United States has had a slow start to the year but there are tentative signs of a pick-up in Europe. China’s growth continues to moderate, but remains relatively strong compared with most other major economies.

I want to focus my comments today on the risks to the global outlook.

Risks to the global growth outlook are present in both advanced and emerging market economies as global uncertainties increase. This message was made clear at the latest meeting of the G20 Finance Ministers and Central Bank Governors in April where the outlook for growth was assessed to remain modest and uneven.

As also noted previously, significantly for Australia are the uncertainties around the implications of the transition in the Chinese economy from investment-led to consumption and services-led growth given the exposure of Australia and its major trading partners to China. And while China’s economic transition is expected to contribute to more sustainable growth over the longer term, Chinese domestic consumption and a growing service sector is unlikely to fully offset the decline in investment and a slowing industrial sector in the near and medium term.

There will be opportunities for Australia in this transition. Our past trade has predominantly been focused on demand for our commodities. Trade with China as it transitions to a consumer-led economy will be more focused on demand for our services. We also expect a growing investment relationship with China, building off a strong base and further boosted by the China-Australia Free Trade Agreement.

A sharper than expected slowdown in Chinese growth, however, would have significant implications for our economy and the region. This is because China is Australia’s number one export market and import supplier. Globally, China is one of the main trading partners for more than 100 economies which account for about 80 per cent of world GDP; so a slowing China will have far reaching effects around the world.

There are risks of renewed volatility in financial markets, which we saw earlier this year. That volatility can reflect concerns in equity and credit markets as to whether the outlook for current global growth will be strong enough to drive corporate earnings and maintain low default rates in order to sustain current valuations. Such bouts of volatility have adversely impacted the financial conditions faced by businesses and households in key global economies.

Banks globally also continue to hold more capital than they did prior to the global financial crisis. However, a number of major economies continue to face financial challenges, particularly the euro area, Japan and a range of emerging market economies. Significant debt has been raised in recent years, particularly in emerging markets, which could also create challenges for both borrowers and lenders in a continued low global growth environment.

Inflation remains low globally reflecting, in part, the impact of low energy costs. I expect inflation in major advanced economies to remain below policy targets for at least in the near term and monetary policy in major advanced economies to remain accommodative for some time yet. Significantly, expectations for further US Federal Reserve rate rises have been pushed out a little.

There is also the risk that low inflation, coupled with low wages growth and low productivity growth experienced in many advanced economies, could become embedded in lower potential growth over time.

Estimates for long-run potential global growth are also being reconsidered by official forecasters. This partly reflects the ongoing legacy of the global financial crisis which has had long lived effects on investment in productive capital and on labour markets. In advanced economies, potential growth was slowing even before the global financial crisis.

Contributing to low productivity growth and declining potential growth is the significant transition underway in global demographic conditions. The global population is growing more slowly, and as fertility rates fall and people live for longer, populations are growing older. A number of countries — including Japan, China and Germany — are confronting declining working age populations.

There is also uncertainty about the effect of oil prices on global growth. This is because the response to lower oil and energy prices in 2015 has not been as strong as might be expected based on historical experience. Factors likely to have muted the positive net impact of lower oil prices on global growth include lower global energy investment and a smaller than expected increase in global private consumption, perhaps as consumers save part of the windfall from lower oil prices.

In summary, it is all uncertain. The Budget shows that the Australian economy continues to transition from mining investment-led growth to broader-based growth. As a still relatively small, open economy, global economic conditions are very important to Australia’s economic outlook. The fact is that global economic conditions continue to be challenging.

On another matter, Treasury standard practice is not to release costings beyond the forward estimates or for the medium term. On this occasion, the Treasurer has authorised me to provide to the Committee the medium-term estimate of the cost to the budget of lifting the small business entity threshold and reducing the company tax rate to 25 per cent by 2026-27. The cost of these measures to 2026-27 is $48.2 billion in cash terms. These estimates have been incorporated into the budget’s medium-term projections for tax receipts. I note that, as with all tax projections over 10 years, these costings have considerable uncertainty. I also note that the medium term economic projections in the Budget assume significant ongoing economic reforms. Finally, I note that Treasury has estimated that the Government’s tax package is estimated to increase the level of GDP by a little over 1 per cent in the long term.

Proposed Financial Institutions Supervisory Levies For 2016-7

The financial industry levies are set to recover the operational costs of APRA and other specific costs incurred by certain Commonwealth agencies and departments, including the Australian Securities and Investments Commission, the Australian Taxation Office, and the Department of Human Services. ASIC gets a 150% uplift, reflecting the requirement for greater supervision of across financial services.

The Treasury has released a paper, prepared in conjunction with the Australian Prudential Regulation Authority (APRA), seeking submissions on the proposed financial institutions supervisory levies that will apply for the 2016-17 financial year by  Friday, 3 June 2016.

LeveyHere they are itemised by industry segment.

Levey1Australian Securities and Investments Commission component

A component of the levies is collected to partially offset ASIC’s regulatory costs in relation to consumer protection, financial literacy, regulatory and enforcement activities relating to the products and services of APRA regulated institutions as well as the operation of the Superannuation Complaints Tribunal (SCT). In addition, the levies are used to offset the cost of a number of Government initiatives including the over the counter (OTC) derivatives market supervision reforms and ASIC’s MoneySmart programmes.

$70.4 million will be recovered to offset ASIC regulatory costs through the levies in 2016-17. This amount is 150.1 per cent more than in 2015-16 as a consequence of the Government’s decisions to provide funding to the SCT to deal with legacy complaints and improve processes and infrastructure ($5.2 million) and to bolster ASIC to protect Australian consumers ($37.0 million).

As part of the improving outcomes in financial services package, the Government will:

  • invest $61.1 million over four years to enhance ASIC’s data analytics and surveillance capabilities as well as modernise ASIC’s data management systems;
  • provide ASIC with $57.0 million over four years to enable increased surveillance and enforcement in the areas of financial advice, responsible lending, life insurance and breach reporting; and
  • accelerate the implementation of a number of key measures recommended by the Financial System Inquiry.

From 2017-18 onwards, ASIC’s regulatory costs will be recovered from all industry sectors regulated by ASIC. The Government will consult extensively with industry to refine and settle an industry funding model for ASIC.

Australian Taxation Office component

Funding from the levies collected from the superannuation industry includes a component to cover the ATO’s regulatory costs in administering the Superannuation Lost Member Register (LMR) and Unclaimed Superannuation Money (USM) frameworks. In 2016-17, it is estimated that the total cost to the ATO in undertaking these functions will be $17.8 million, with the full amount to be recovered through the levies in line with the requirements of the Government’s Charging Framework.

The majority of this funding supports the ATO’s activities, which include:

  • the implementation of strategies to reunite individuals with lost and unclaimed superannuation money including promotion of the ATO On Line Individuals Portal and targeted SMS/e mail campaigns;
  • working collaboratively with funds to engage members being reunited with their super, including Super Match and providing funds with updated contact information about their lost members;
  • processing of lodgements, statements and other associated account activities;
  • processing of claims and payments, including the recovery of overpayments;reviewing and improving the integrity of data on the LMR and in the USM system; and
  • reviewing and improving data matching techniques, which facilitates the display of lost and unclaimed accounts on the ATO On Line Individuals Portal.

The funding also supports the ongoing upkeep and enhancement of the ATO’s administrative system for USM frameworks and the LMR, and for continued work to improve efficiency and automate processing where applicable.

Department of Human Services component

The Department of Human Services administers the Early Release of Superannuation Benefits on Compassionate Grounds programme (ERSB). The compassionate grounds enable the Regulator (the Chief Executive of Medicare) to consider the early release of a person’s preserved superannuation in specified circumstances.

The volume of ERSB applications has significantly increased since it was made possible to apply online. In 2015-16, the ERSB received 27,688 applications. This was a 44 per cent increase compared with the previous year. In 2016-17, the ERSB is forecast to receive approximately 38,763 applications. This will represent an approximate increase in volume of 40 per cent compared with the previous year.

The programme is expected to cost the Government $4.8 million in 2016-17. In line with the Government’s Charging Framework, this amount will be recovered in full through the levies.

SuperStream component

Announced as part of the former Government’s Stronger Super reforms, SuperStream is a collection of measures that are designed to deliver greater efficiency in back-office processing across the superannuation industry. Superannuation funds will benefit from standardised and simplified data and payment administration processes when dealing with employers and other funds and from easier matching and consolidation of superannuation accounts. The costs associated with the implementation of the SuperStream measures are to be collected as part of the levies on superannuation funds. The levies will recover the full cost of the implementation of the SuperStream reforms and are to be imposed as a temporary levy on APRA-regulated superannuation entities from 2012-13 to 2017-18 inclusive.

The costs associated with the implementation of the SuperStream reforms are estimated to be $35.5 million in 2016-17 and $32.0 million in 2017-18.

Morrison warns banks not to pass on new ‘user-pays’ impost to finance ASIC reform

From The Conversation.

Treasurer Scott Morrison has warned Australian banks not to pass on to customers the $121 million user-pays charge imposed on them to finance a strengthened Australian Securities and Investments Commission (ASIC).

The banks will pay for almost all the $127 million four-year package, which the government hopes will take the sting out of Labor’s promise that it would set up a royal commission.

But Opposition Leader Bill Shorten said the issues were not just matters of the law but the culture.

The government will provide $61.1 million to boost ASIC’s technology to boost its surveillance capabilities. “In the 21st century economy, you need a tech cop on the beat,” Morrison said.

Another $9.2 million will go to ASIC and Treasury to ensure they can implement appropriate law and regulatory reform.

ASIC will get a further $57 million for the ongoing cost of increased surveillance and enforcement in the areas of financial advice, responsible lending, life insurance and breach reporting.

The measures follow a capability review of ASIC initiated by the government in July.

Among other changes, an extra ASIC commissioner will be appointed with experience in the prosecution of crimes in the financial services industry.

The government is accelerating the implementation of recommendations from the Murray review of the financial system for increased penalties and greater powers for ASIC to intervene on financial products.

ASIC’s employment practices will be exempted from the public service act, so it can recruit from the market people with experience in the sector.

The government will recommend that the financial services ombudsman changes its thresholds to provide greater access for treatment of claims and compliance.

An “eminent panel” will examine bringing together forums to have a “one stop shop” for consumer complaints.

Morrison told a joint news conference with Assistant Treasurer Kelly O’Dwyer that the banks would pay an additional $121 million to increase the resources of ASIC.

ASIC would also be moved to a full user-pays funding model. “No longer will it be the case that taxpayers will be hit to fund this regulator, this enforcement authority, this cop on the beat. Those whom it’s enforcing the regulations and rules on, will pay the price for that,” he said.

Asked whether the banks would not just pass on the impost in higher fees and charges, Morrison said the levies were “easily digestible by the banks”. He would be “furious” if the banks sought to pass the cost on and they had that message from him.

The term of ASIC chairman Greg Medcraft, which is expiring, has been extended – but only for 18 months to oversee the implementation of the reforms.

Making his pitch for reforming ASIC rather than having a royal commission, Morrison said: “What I have outlined today is a serious action plan. … This is what practical, effective targeted government looks like and that’s how we are responding to these issues of real concerns to Australians.”

He said Shorten “wants to spend your money to fund his political exercise which won’t get outcomes for people – it will just get a political outcome for Bill Shorten”.

O’Dwyer denied that the government previously tried to wind back consumer protections in the financial sector. “That’s simply not correct,” she said.

The Abbott government introduced regulations to water down the Labor government’s Future of Financial Advice (FOFA) reforms. But later these were disallowed by the Senate.

Shadow treasurer Chris Bowen said the package was “nothing more a political fix” to try to avoid a royal commission. “It’s a plan to hobble through an election.”

Responding to the government’s announcement Westpac said “The measures announced today by the government will play an important role in ensuring customers can be confident in our banking system.

“In line with our submission to the financial system inquiry, Westpac supports a user pays model for ASIC.”

Australian Bankers’ Association chief executive Steven Münchenberg said: “We support the introduction of a new industry funding model for ASIC” adding that it was “important that contributions are transparent and that the amount of fees levied matches the level of regulation and resources required for ASIC”.

He said that the banking industry supported, in principle, the product intervention power for ASIC to bolster consumer protections. “However, we need to be wary of any action that may have unintended consequences and adversely impact on product innovation or consumer choice.”

Author: Michelle Grattan, Professorial Fellow, University of Canberra

Small Amount Credit Review Recommends Tighter Controls

The final report of the Review of Small Amount Credit Contracts (SACCs) has been released. A range of recommendations tighten regulation of short term small loans and consumer leases. Of note is the need to disclose the actual APR of the transaction, be it a small amount credit contract or consumer lease. In the latter case, the cost of the relevant household good must be disclosed.

The review panel provided the Final Report to the Government on 3 March 2016.

The review was silent on mandating better collection of transaction data so  the true volume of loans could be recorded. As highlighted in the report accurate data is an issue.

Small Amount Credit Contracts (SACCs)

Recommendation 1 – Affordability – Extend the protected earnings amount regulation to cover SACCs provided to all consumers.
Reduce the cap on the total amount of all SACC repayments (including under the proposed SACC) from 20 per cent of the consumer’s gross income to 10 per cent of the consumer’s net (that is, after tax) income. Subject to these changes being accepted, retain the existing 20 per cent establishment fee and 4 per cent monthly fee maximums.
Recommendation 2 – Suitability – Remove the rebuttable presumption that a loan is presumed to be unsuitable if either the consumer is in default under another SACC, or in the 90-day period before the assessment, the consumer has had two or more other SACCs.
This recommendation is made on the condition that it is implemented together with Recommendation 1.
Recommendation 3 – Short term credit contracts – Maintain the existing ban on credit contracts with terms less than 15 days.
Recommendation 4 – Direct debit fees – Direct debit fees should be incorporated into the existing SACC fee cap.
Recommendation 5 – Equal repayments and sanction – In order to meet the definition of a SACC, the credit contract must have equal repayments over the life of the loan (noting that there may need to be limited exceptions to this rule). Where a contract does not meet this requirement the credit provider cannot charge more than an annual precent rate (APR) of 48 per cent.
Recommendation 6 – SACC database – A national database of SACCs should not be introduced at this stage. The major banks should be encouraged to participate in the comprehensive credit reporting regime at the earliest date.
Recommendation 7 – Early repayment –  No 4 per cent monthly fee can be charged for a month after the SACC is discharged by its early repayment. If a consumer repays a SACC early, the credit provider under the SACC cannot charge the monthly fee in respect of any outstanding months of the original term of the SACC after the consumer has repaid the outstanding balance and those amounts should be deducted from the outstanding balance at the time it is paid.
Recommendation 8 – Unsolicited offers – SACC providers should be prevented from making unsolicited SACC offers to current or previous consumers.
Recommendation 9 – Referrals to other SACC providers – SACC providers should not receive a payment or any other benefit for a referral made to another SACC provider.
Recommendation 10 – Default fees – SACC providers should only be permitted to charge a default fee that represents their actual costs arising from a consumer defaulting on a SACC up to a maximum of $10 per week. The existing limitation of the amount recoverable in the event of default to twice the adjusted credit amount should be retained.

Consumer Leases

Recommendation 11 – Cap on cost to consumers – A cap on the total amount of the payments to be made under a consumer lease of household goods should be introduced. The cap should be a multiple of the Base Price of the goods, determined by adding 4 per cent of the Base Price for each whole month of the lease term to the amount of the Base Price. For a lease with a term of greater than 48 months, the term should be deemed to be 48 months for the purposes of the calculation of the cap.
Recommendation 12 – Base Price of goods – The Base Price for new goods should be the recommended retail price or the price agreed in store, where this price is below the recommended retail price. Further work should be done to define the Base Price for second hand goods.
Recommendation 13 – Add-on services and features – The cost (if any) of add-on services and features, apart from delivery, should be included in the cap. A separate one-off delivery fee should be permitted. That fee should be limited to the reasonable costs of delivery of the leased good which appropriately account for any cost savings if there is a bulk delivery of goods to an area.
Recommendation 14 – Consumer leases to which the cap applies – The cap should apply to all leases of household goods including electronic goods.
Further consultation should take place on whether the cap should apply to consumer leases of motor vehicles.
Recommendation 15 –Affordability – A protected earnings amount requirement be introduced for leases of household goods, whereby lessors cannot require consumers to pay more than 10 per cent of their net income in rental payments under consumer leases of household goods, so that the total amount of all rental payments (including under the proposed lease) cannot exceed 10 per cent of their net income in each payment period.
Recommendation 16 – Centrepay implementation – The Department of Human Services consider making the caps in Recommendations 11 and 15 mandatory as soon as practicable for lessors who utilise or seek to utilise the Centrepay system.
Recommendation 17 – Early termination fees – The maximum amount that a lessor can charge on termination of a consumer lease should be imposed by way of a formula or principles that provide an appropriate and reasonable estimate of the lessors’ losses from early repayment.
Recommendation 18 – Ban on the unsolicited marketing of consumer leases – There should be a prohibition on the unsolicited selling of consumer leases of household goods, addressing current unfair practices used to market these goods.

Combined recommendations

Recommendation 19 – Bank statements – Retain the obligation for SACC providers to obtain and consider 90 days of bank statements before providing a SACC, and introduce an equivalent obligation for lessors of household goods. Introduce a prohibition on using information obtained from bank statements for purposes other than compliance with responsible lending obligations. ASIC should continue its discussions with software providers, banking institutions and SACC providers with a view to ensuring that ePayment Code protections are retained where consumers provide their bank account log-in details in order for a SACC provider to comply with their obligation to obtain 90 days of bank statements, for responsible lending purposes.
Recommendation 20 – Documenting suitability assessments – Introduce a requirement that SACC providers and lessors under a consumer lease are required at the time the assessment is made to document in writing their assessment that a proposed contract or lease is suitable.
Recommendation 21 – Warning statements – Introduce a requirement for lessors under consumer leases of household goods to provide consumers with a warning statement, designed to assist consumers to make better decisions as to whether to enter into a consumer lease, including by informing consumers of the availability of alternatives to these leases. In relation to both the proposed warning statement for consumer leases of household goods and the current warning statement in respect of SACCs, provide ASIC with the power to modify the requirements for the statement (including the content and when the warning statement has to be provided) to maximise the impact on consumers.
Recommendation 22 – Disclosure – Introduce a requirement that SACC providers and lessors under a consumer lease of household goods be required to disclose the cost of their products as an APR. Introduce a requirement that lessors under a consumer lease of household goods be required to disclose the Base Price of the goods being leased, and the difference between the Base Price and the total payments under the lease.

The Government is also consulting on whether the recommendations relating to consumer leases should apply to all regulated consumer leases (including motor vehicles) rather than only leases of household goods, and how second hand goods should be treated.